| Param | Original file | Final file |
|---|---|---|
| Filename | modeM0/AS1A09_059T01_9000003706_25353cztM0_level2.evt | modeM0/AS1A09_059T01_9000003706_25353cztM0_level2_quad_clean.evt |
| Size (bytes) | 941,662,080 | 185,927,040 |
| Size | 898.0 MB | 177.3 MB |
| Events in quadrant A | 6,450,236 | 1,203,617 |
| Events in quadrant B | 6,510,823 | 1,210,571 |
| Events in quadrant C | 6,855,111 | 1,158,050 |
| Events in quadrant D | 7,793,191 | 1,131,004 |
| Mode M0 | |||
|---|---|---|---|
| Quadrant | BADHDUFLAG | Total packets | Discarded packets |
| A | 0 | 28073 | 0 |
| B | 0 | 28093 | 0 |
| C | 0 | 29106 | 0 |
| D | 0 | 32625 | 0 |
| Mode M9 | |||
|---|---|---|---|
| Quadrant | BADHDUFLAG | Total packets | Discarded packets |
| A | 0 | 16 | 0 |
| B | 0 | 16 | 0 |
| C | 0 | 16 | 0 |
| D | 0 | 16 | 0 |
| Quadrant | Total seconds | Saturated seconds | Saturation percentage |
|---|---|---|---|
| A | 13434 | 64 | 0.476403% |
| B | 13435 | 69 | 0.513584% |
| C | 13434 | 182 | 1.354771% |
| D | 13434 | 304 | 2.262915% |
Noise dominated data is calculated using 1-second bins in cleaned event files. If a bin has >2000 counts, and if more than 50% of those come from <1% of pixels, then it is considered to be noise-dominated and hence unusable.
| Quadrant | # 1 sec bins | Bins with >0 counts | Bins with >2000 counts | High rate bins dominated by noise | Noise dominated (total time) | Noise dominated (detector-on time) | Marked lightcurve |
|---|---|---|---|---|---|---|---|
| A | 15044 | 13437 | 13 | 13 | 0.09% | 0.10% |  |
| B | 15045 | 13438 | 4 | 4 | 0.03% | 0.03% |  |
| C | 15044 | 13437 | 12 | 12 | 0.08% | 0.09% |  |
| D | 15044 | 13436 | 227 | 227 | 1.51% | 1.69% |  |
Top three noisy pixels from each quadrant. If the there are fewer than three noisy pixels in the level2.evt file, extra rows are filled as -1
| Pixel properties | Quadrant properties | ||||||
|---|---|---|---|---|---|---|---|
| Quadrant | DetID | PixID | Counts | Sigma | Mean | Median | Sigma |
| A | 6 | 16 | 200810 | 617.32 | 1610 | 1575 | 322.7 |
| A | 4 | 2 | 41135 | 122.57 | 1610 | 1575 | 322.7 |
| A | 13 | 254 | 21581 | 61.99 | 1610 | 1575 | 322.7 |
| B | 3 | 112 | 96875 | 313.04 | 1598 | 1556 | 304.5 |
| B | 0 | 229 | 59932 | 191.71 | 1598 | 1556 | 304.5 |
| B | 0 | 190 | 51490 | 163.99 | 1598 | 1556 | 304.5 |
| C | 3 | 233 | 511492 | 1415.53 | 1546 | 1553 | 360.2 |
| C | 14 | 238 | 247661 | 683.17 | 1546 | 1553 | 360.2 |
| C | 9 | 54 | 51714 | 139.24 | 1546 | 1553 | 360.2 |
| D | 12 | 233 | 682651 | 1805.85 | 1556 | 1511 | 377.2 |
| D | 8 | 195 | 576667 | 1524.86 | 1556 | 1511 | 377.2 |
| D | 1 | 52 | 456422 | 1206.06 | 1556 | 1511 | 377.2 |
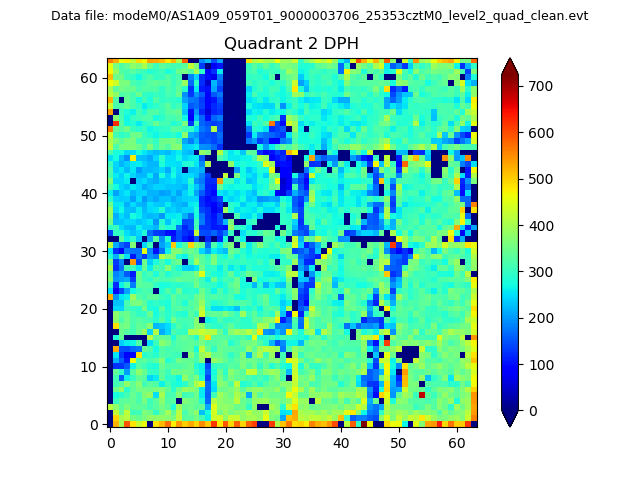
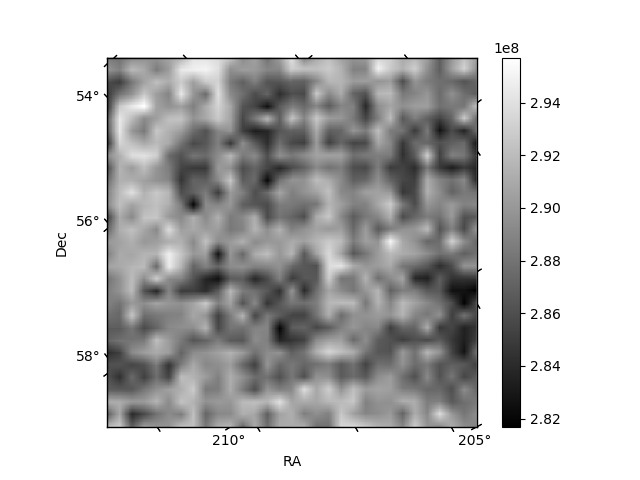
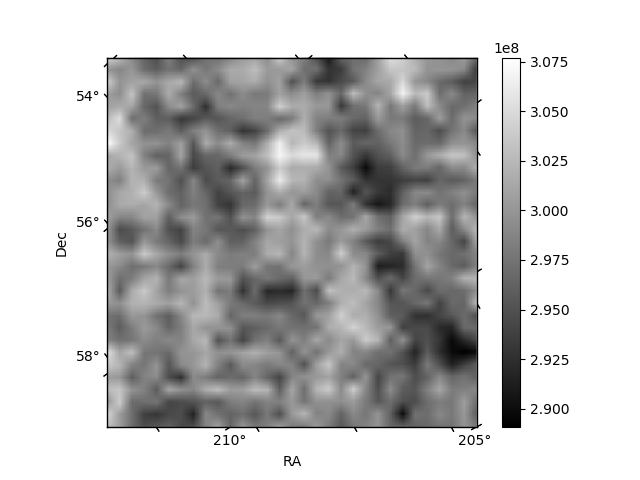
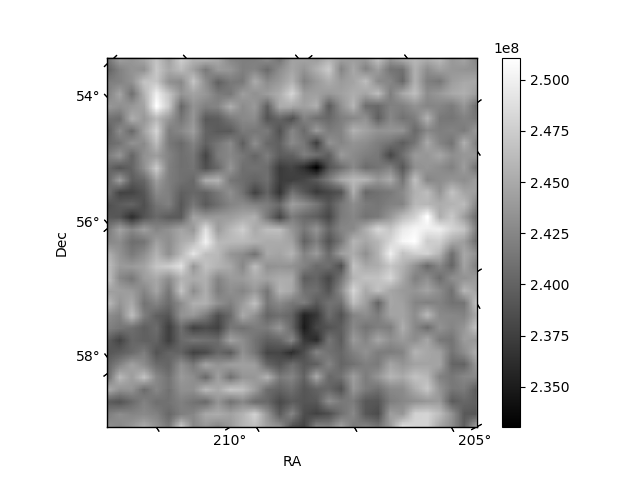
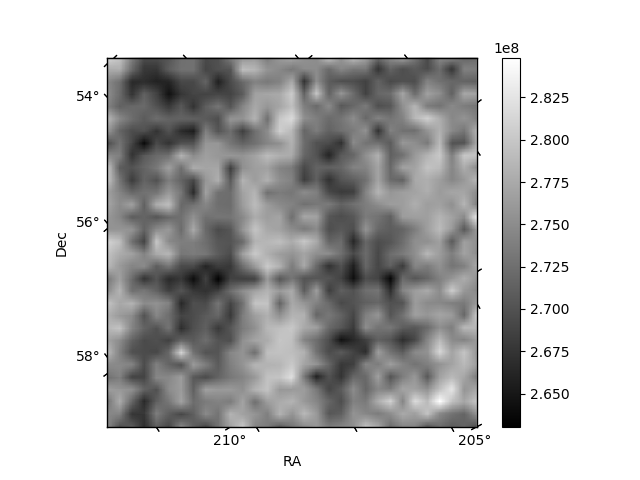
Histogram calculated using DETX and DETY for each event in the final _common_clean file
| Quadrant A | 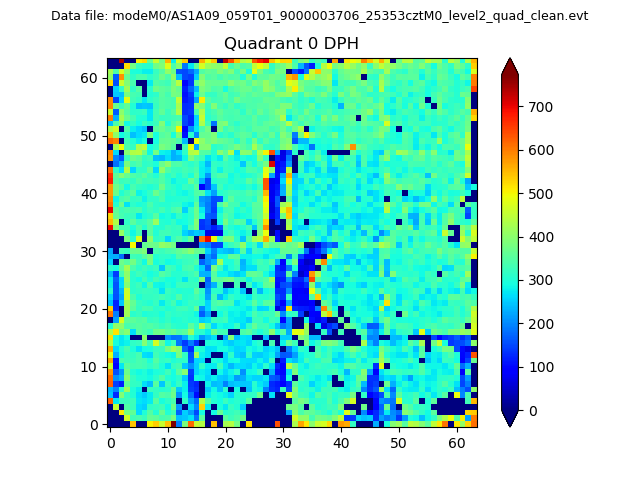 |
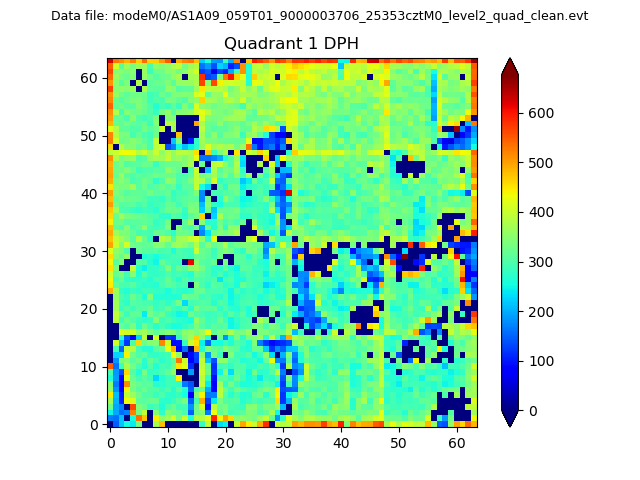 |
Quadrant B |
|---|---|---|---|
| Quadrant D | 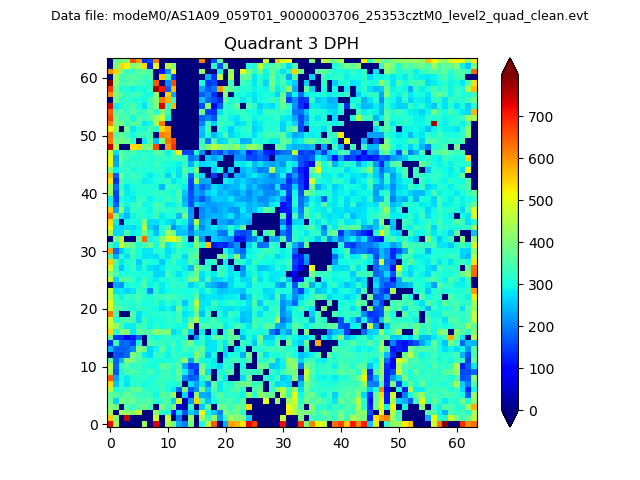 |
 |
Quadrant C |
| Plot type | Count rate plots | Images |
|---|---|---|
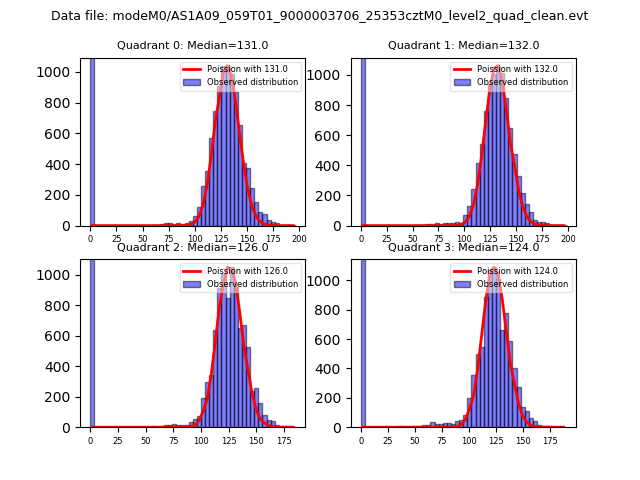
| Comparison with Poisson distribution Blue bars denote a histogram of data divided into 1 sec bins. Red curve is a Poisson curve with rate = median count rate of data. |
 |
 |
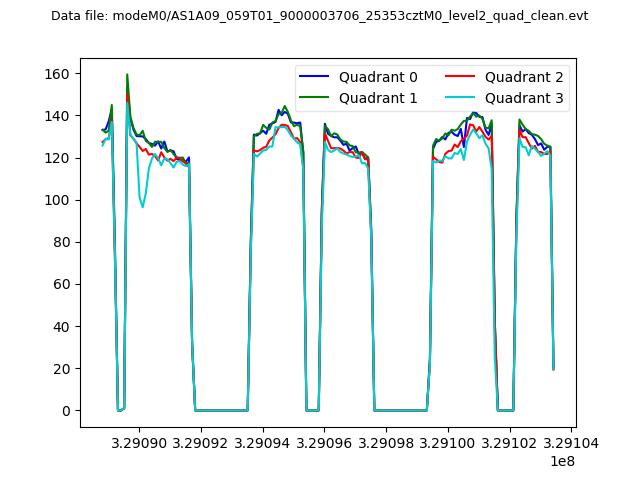
| Quadrant-wise count rates Data is divided into 100 sec bins |
 |
|
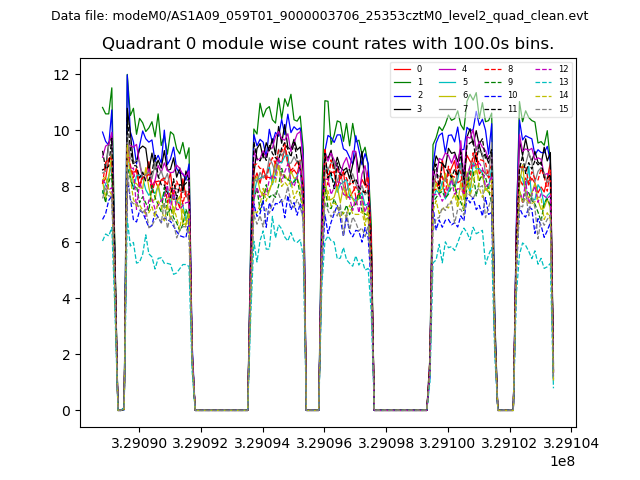
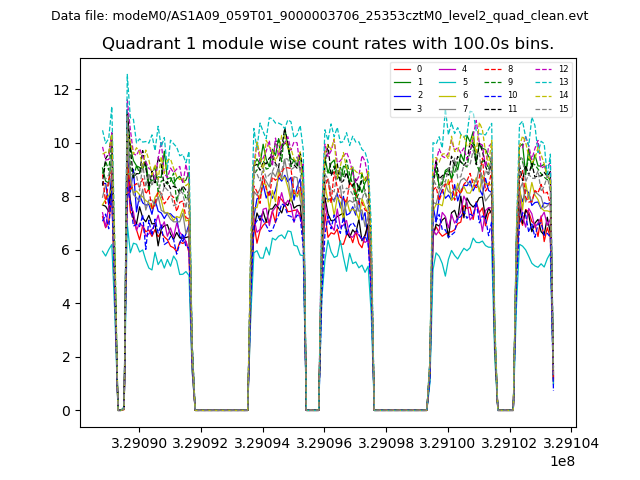
| Module-wise count rates for Quadrant A Data is divided into 100 sec bins |
 |
 |
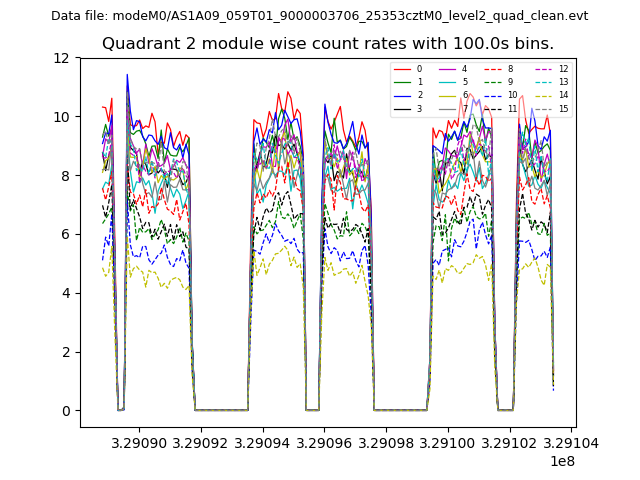
| Module-wise count rates for Quadrant B Data is divided into 100 sec bins |
 |
 |
| Module-wise count rates for Quadrant C Data is divided into 100 sec bins |
 |
 |
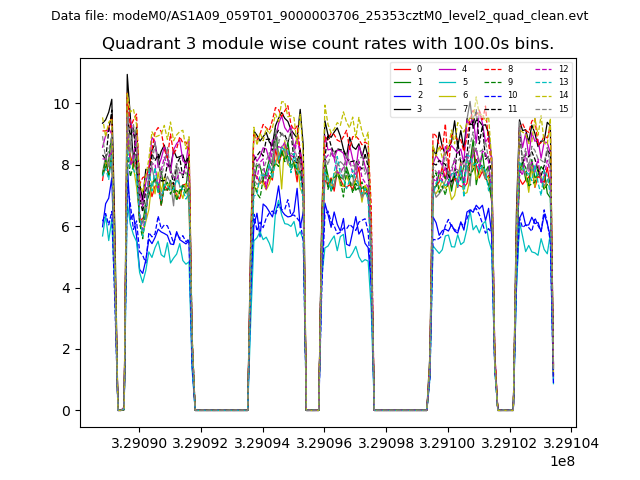
| Module-wise count rates for Quadrant D Data is divided into 100 sec bins |
 |
 |
| Parameter | Plot |
|---|---|
| CZT HV Monitor | 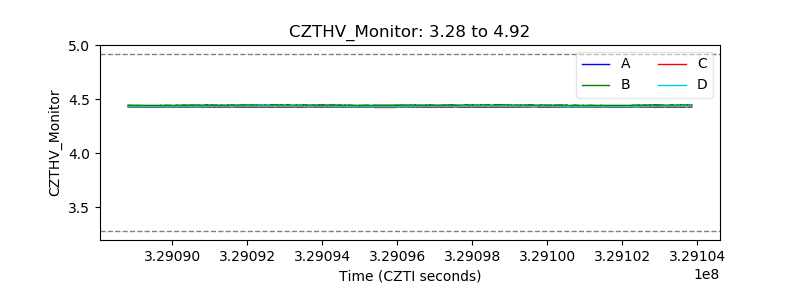 |
| D_VDD | 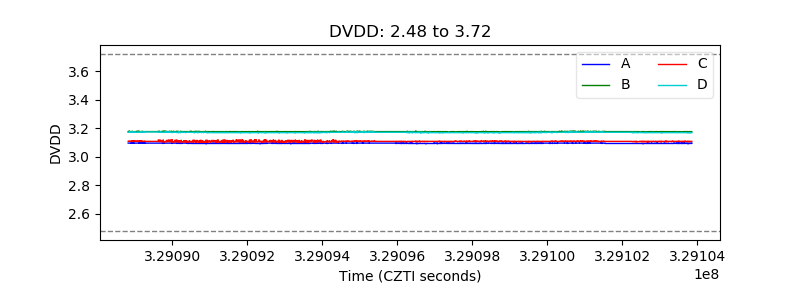 |
| Temperature 1 | 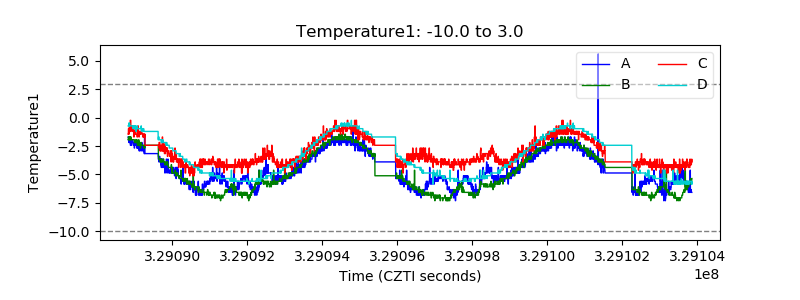 |
| Veto HV Monitor | 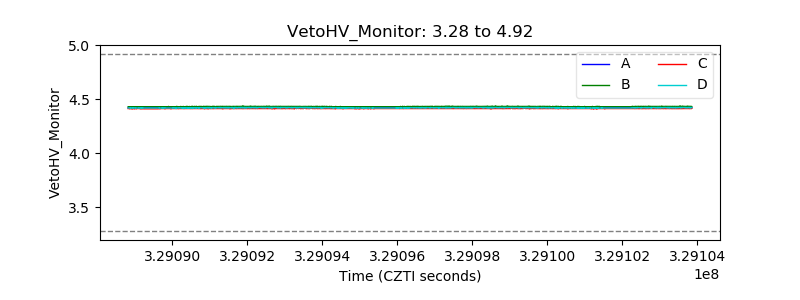 |
| Veto LLD | 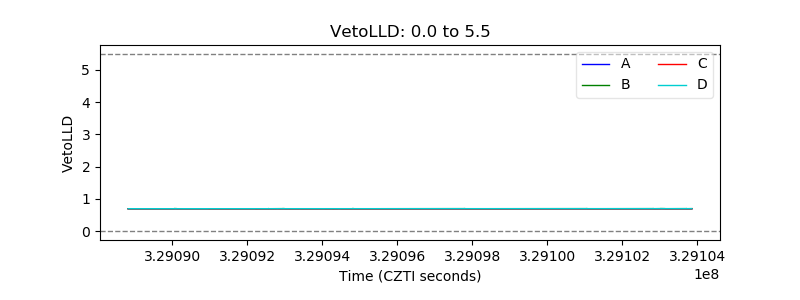 |
| Alpha Counter | 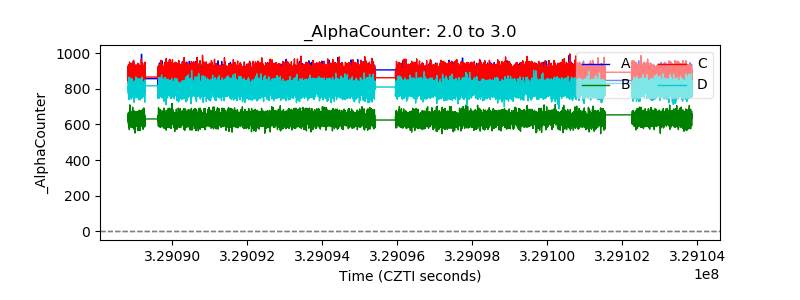 |
| _CPM_Rate | 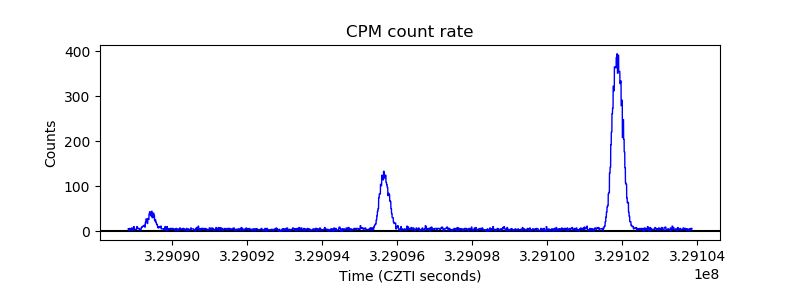 |
| CZT Counter | 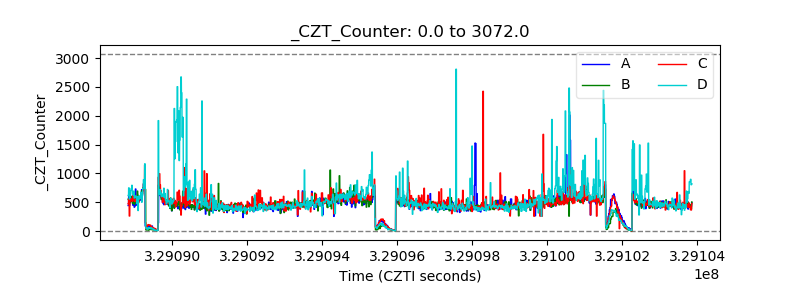 |
| +2.5 Volts monitor |  |
| +5 Volts monitor |  |
| _ROLL_ROT | 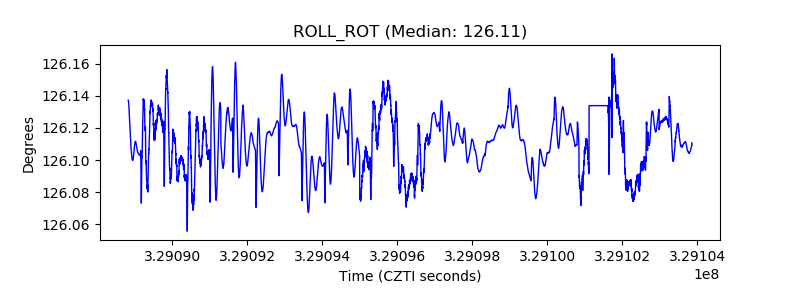 |
| _Roll_DEC | 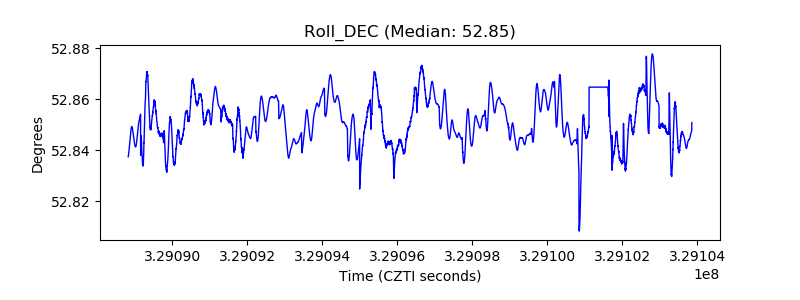 |
| _Roll_RA | 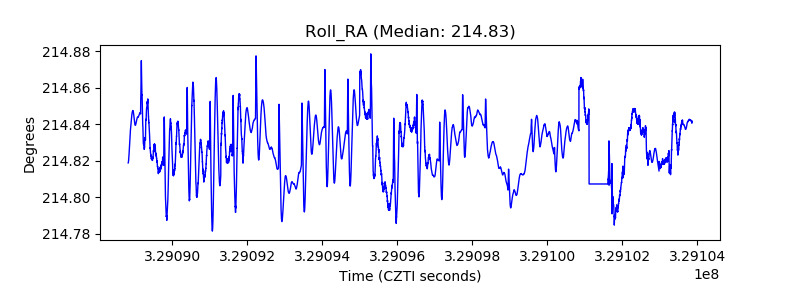 |
| Veto Counter | 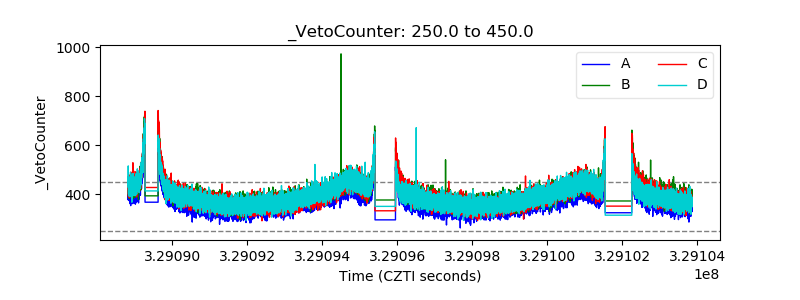 |