| Param | Original file | Final file |
|---|---|---|
| Filename | modeM0/AS1A09_059T01_9000003706_25354cztM0_level2.evt | modeM0/AS1A09_059T01_9000003706_25354cztM0_level2_quad_clean.evt |
| Size (bytes) | 502,300,800 | 87,413,760 |
| Size | 479.0 MB | 83.4 MB |
| Events in quadrant A | 3,388,404 | 561,511 |
| Events in quadrant B | 3,313,317 | 568,115 |
| Events in quadrant C | 3,223,990 | 540,861 |
| Events in quadrant D | 4,827,679 | 505,432 |
| Mode M0 | |||
|---|---|---|---|
| Quadrant | BADHDUFLAG | Total packets | Discarded packets |
| A | 0 | 14209 | 0 |
| B | 0 | 14060 | 0 |
| C | 0 | 13842 | 0 |
| D | 0 | 18877 | 0 |
| Mode M9 | |||
|---|---|---|---|
| Quadrant | BADHDUFLAG | Total packets | Discarded packets |
| A | 0 | 11 | 0 |
| B | 0 | 12 | 0 |
| C | 0 | 12 | 0 |
| D | 0 | 12 | 0 |
| Quadrant | Total seconds | Saturated seconds | Saturation percentage |
|---|---|---|---|
| A | 6756 | 19 | 0.281231% |
| B | 6756 | 32 | 0.473653% |
| C | 6755 | 44 | 0.651369% |
| D | 6755 | 387 | 5.729090% |
Noise dominated data is calculated using 1-second bins in cleaned event files. If a bin has >2000 counts, and if more than 50% of those come from <1% of pixels, then it is considered to be noise-dominated and hence unusable.
| Quadrant | # 1 sec bins | Bins with >0 counts | Bins with >2000 counts | High rate bins dominated by noise | Noise dominated (total time) | Noise dominated (detector-on time) | Marked lightcurve |
|---|---|---|---|---|---|---|---|
| A | 7651 | 6757 | 0 | 0 | 0.00% | 0.00% | 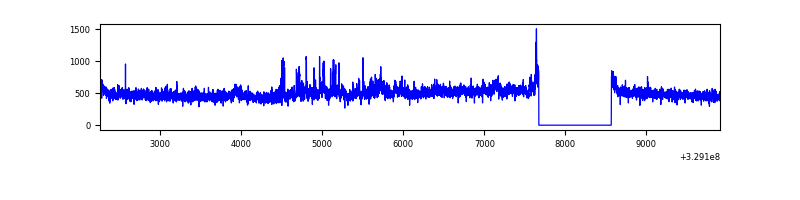 |
| B | 7651 | 6757 | 0 | 0 | 0.00% | 0.00% | 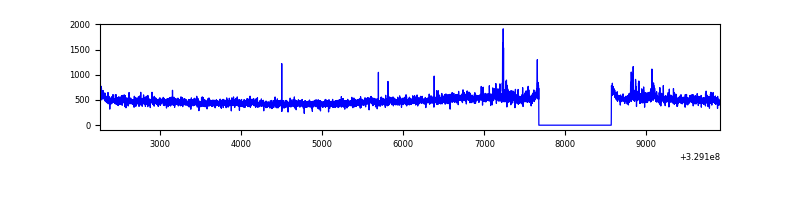 |
| C | 7650 | 6756 | 1 | 1 | 0.01% | 0.01% | 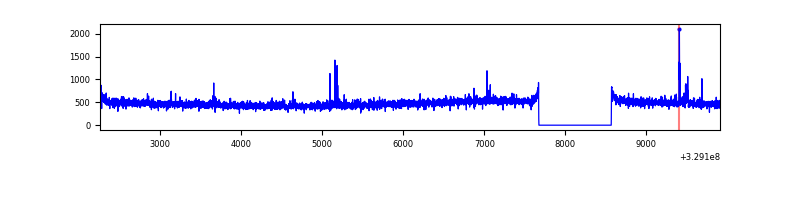 |
| D | 7650 | 6756 | 324 | 324 | 4.24% | 4.80% | 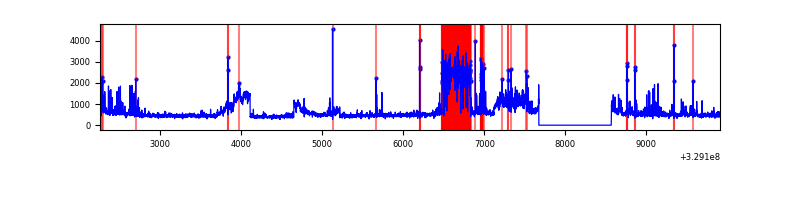 |
Top three noisy pixels from each quadrant. If the there are fewer than three noisy pixels in the level2.evt file, extra rows are filled as -1
| Pixel properties | Quadrant properties | ||||||
|---|---|---|---|---|---|---|---|
| Quadrant | DetID | PixID | Counts | Sigma | Mean | Median | Sigma |
| A | 6 | 16 | 262129 | 1597.77 | 810 | 791 | 163.6 |
| A | 13 | 254 | 10852 | 61.51 | 810 | 791 | 163.6 |
| A | 3 | 137 | 7562 | 41.4 | 810 | 791 | 163.6 |
| B | 3 | 112 | 83492 | 531.13 | 807 | 785 | 155.7 |
| B | 0 | 229 | 35266 | 221.43 | 807 | 785 | 155.7 |
| B | 12 | 111 | 19099 | 117.61 | 807 | 785 | 155.7 |
| C | 14 | 238 | 123478 | 669.63 | 779 | 784 | 183.2 |
| C | 3 | 233 | 35277 | 188.25 | 779 | 784 | 183.2 |
| C | 9 | 54 | 25190 | 133.2 | 779 | 784 | 183.2 |
| D | 12 | 233 | 810987 | 4349.03 | 762 | 740 | 186.3 |
| D | 1 | 52 | 489513 | 2623.51 | 762 | 740 | 186.3 |
| D | 7 | 238 | 364551 | 1952.77 | 762 | 740 | 186.3 |
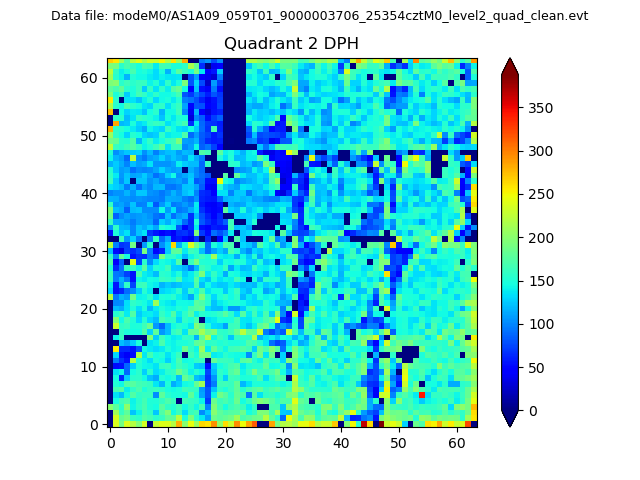
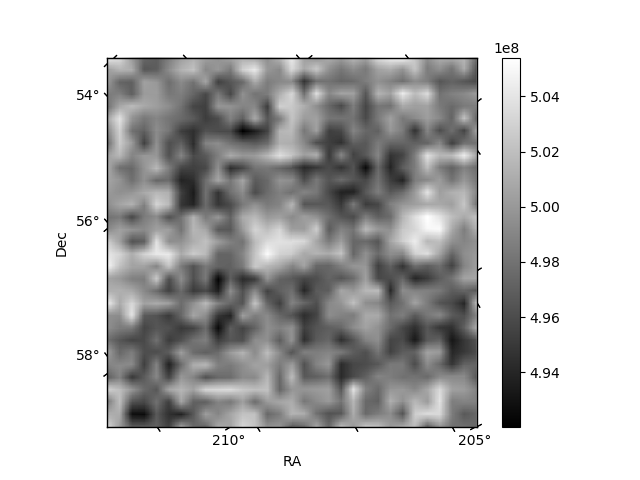
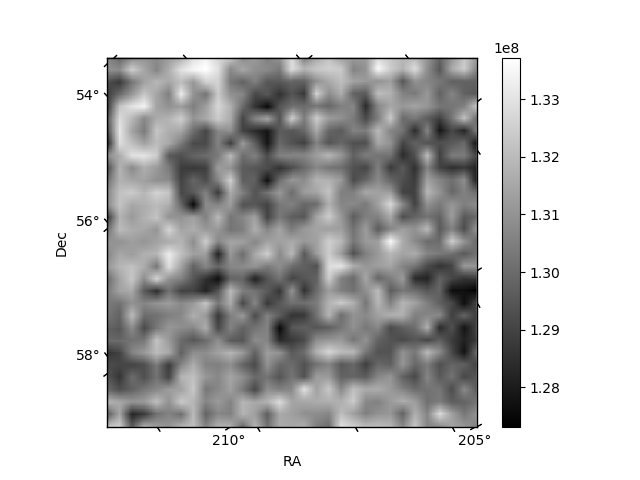
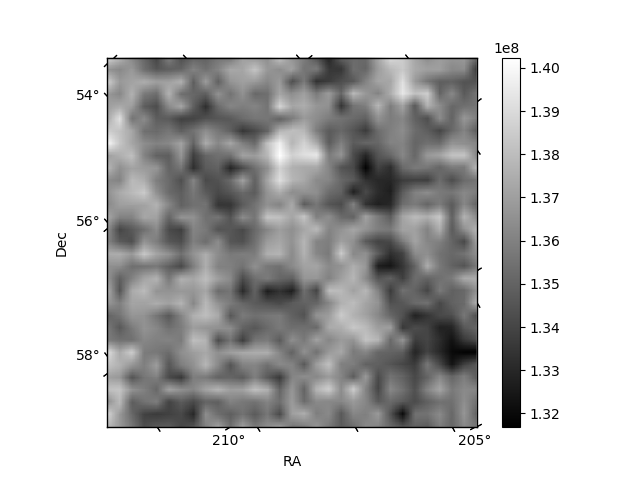
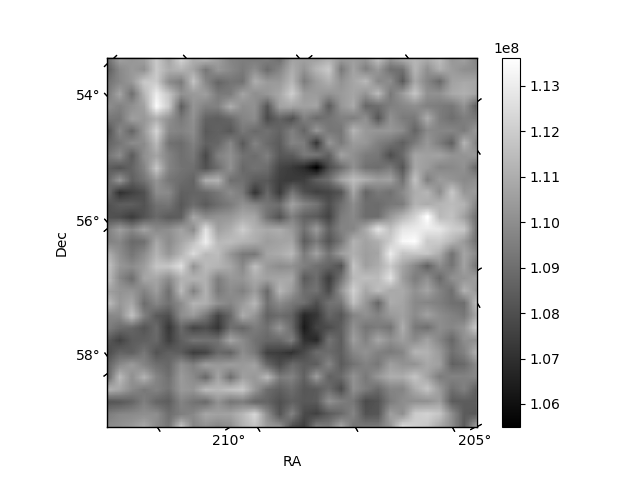
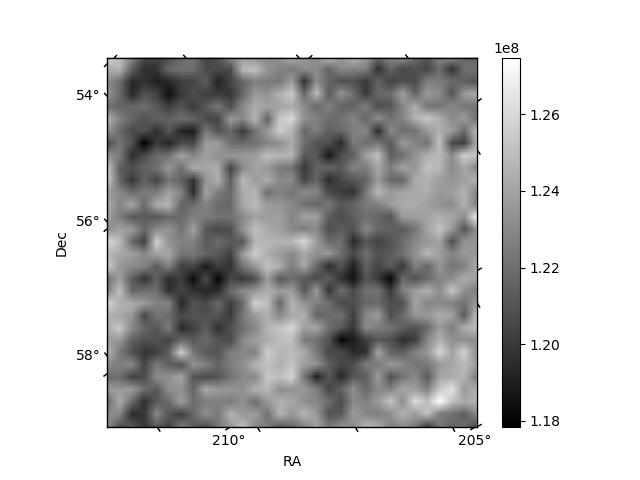
Histogram calculated using DETX and DETY for each event in the final _common_clean file
| Quadrant A | 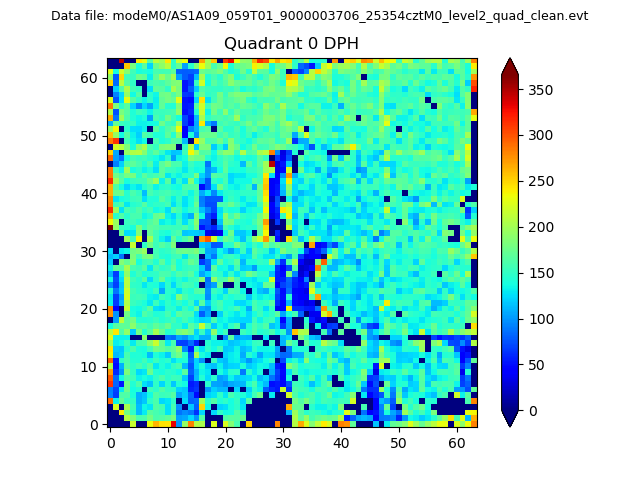 |
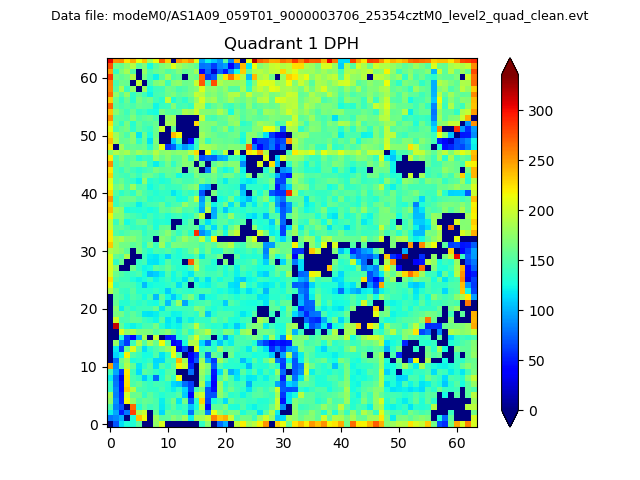 |
Quadrant B |
|---|---|---|---|
| Quadrant D | 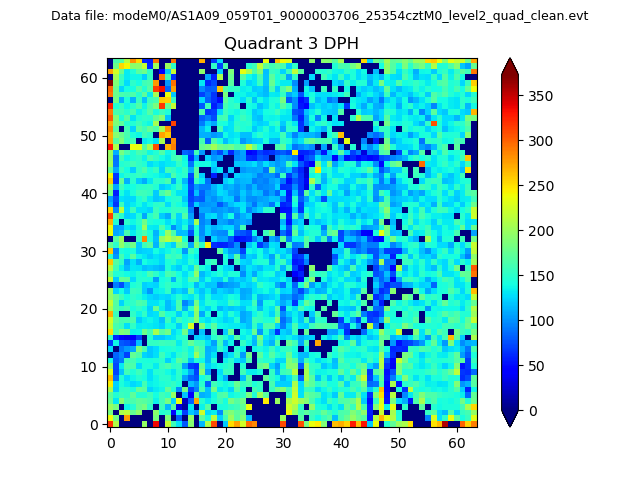 |
 |
Quadrant C |
| Plot type | Count rate plots | Images |
|---|---|---|
| Comparison with Poisson distribution Blue bars denote a histogram of data divided into 1 sec bins. Red curve is a Poisson curve with rate = median count rate of data. |
 |
 |
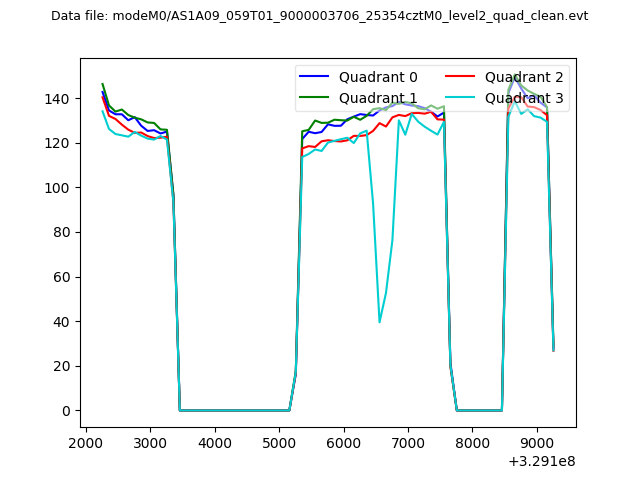
| Quadrant-wise count rates Data is divided into 100 sec bins |
 |
|
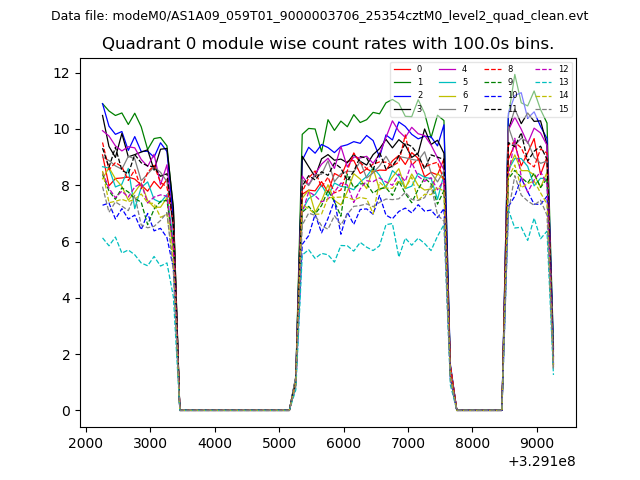
| Module-wise count rates for Quadrant A Data is divided into 100 sec bins |
 |
 |
| Module-wise count rates for Quadrant B Data is divided into 100 sec bins |
 |
 |
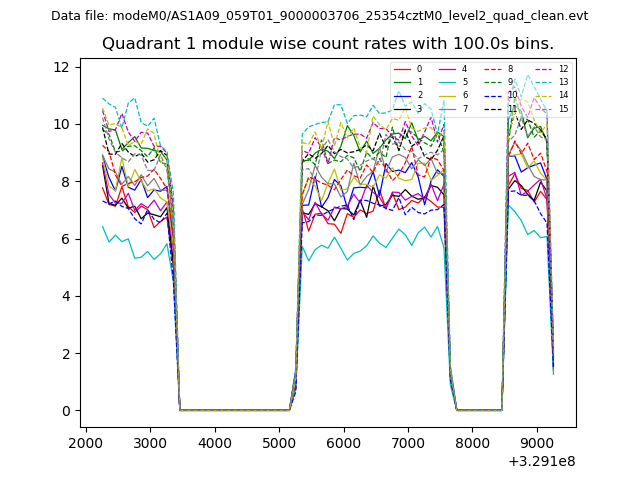
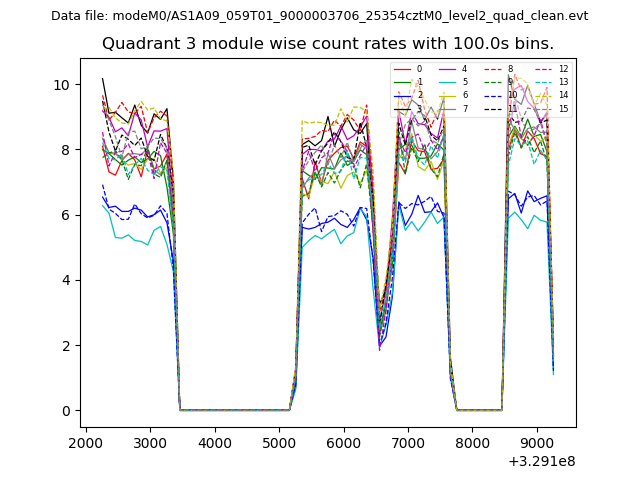
| Module-wise count rates for Quadrant C Data is divided into 100 sec bins |
 |
 |
| Module-wise count rates for Quadrant D Data is divided into 100 sec bins |
 |
 |
| Parameter | Plot |
|---|---|
| CZT HV Monitor |  |
| D_VDD | 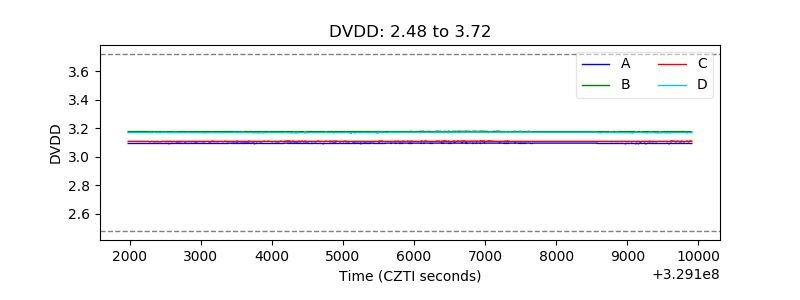 |
| Temperature 1 | 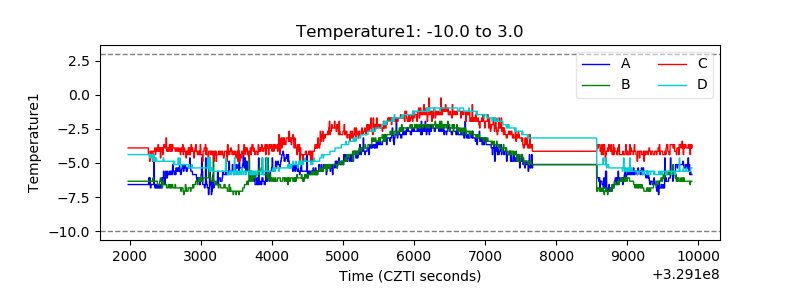 |
| Veto HV Monitor | 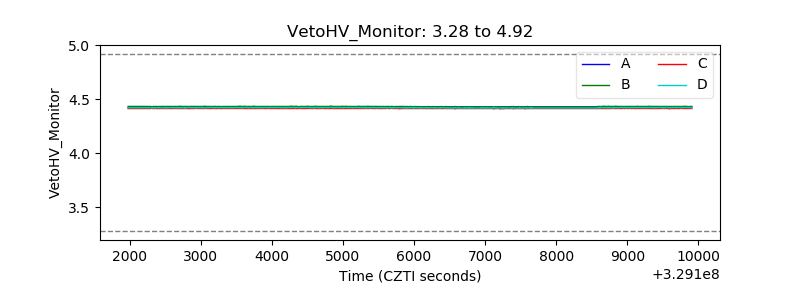 |
| Veto LLD | 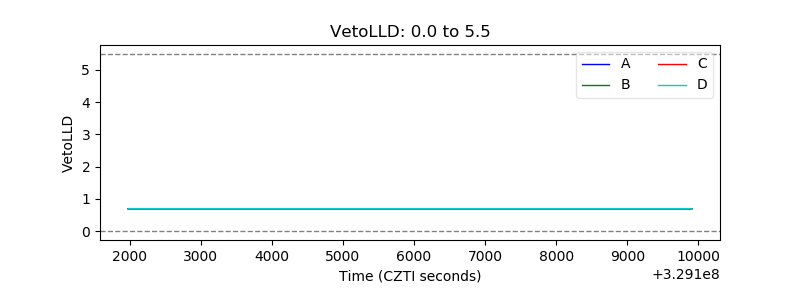 |
| Alpha Counter | 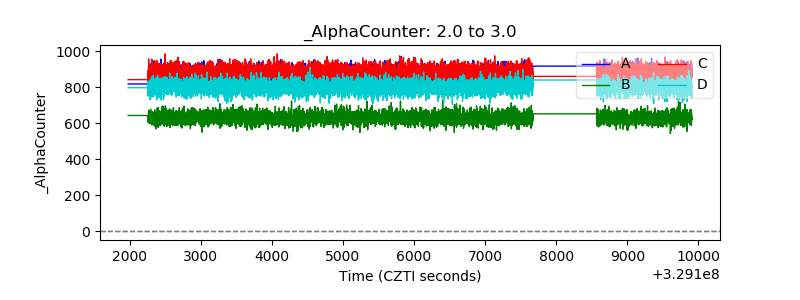 |
| _CPM_Rate | 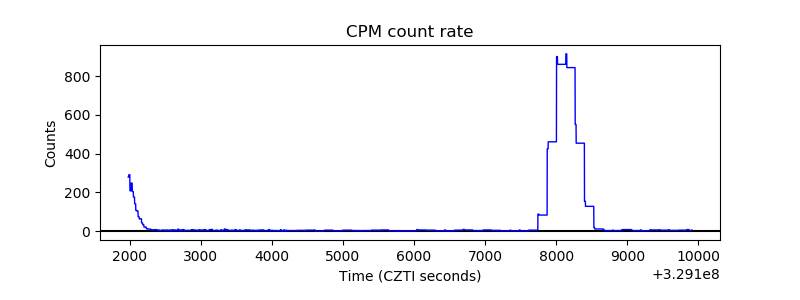 |
| CZT Counter | 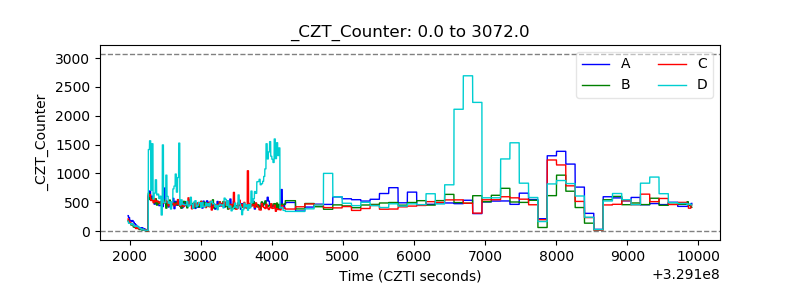 |
| +2.5 Volts monitor |  |
| +5 Volts monitor |  |
| _ROLL_ROT | 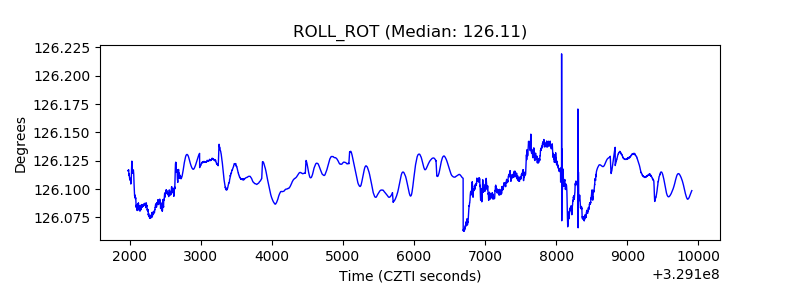 |
| _Roll_DEC | 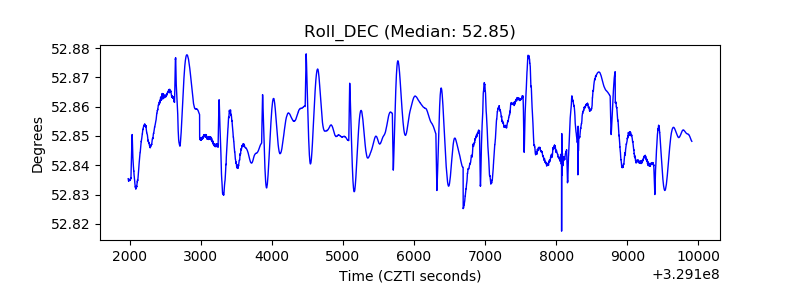 |
| _Roll_RA | 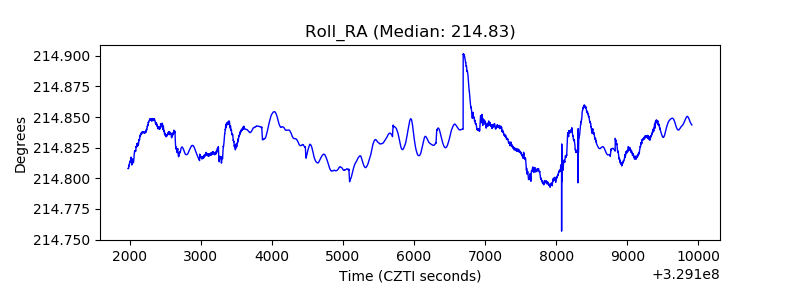 |
| Veto Counter | 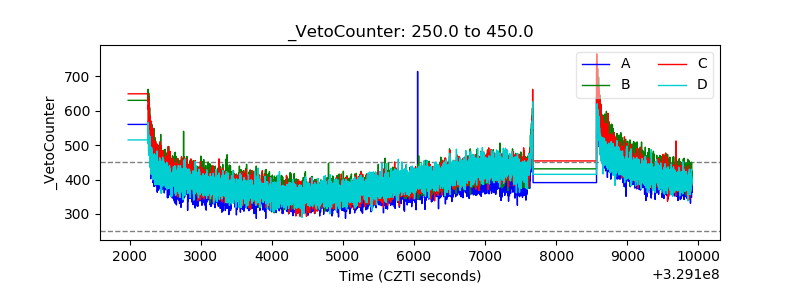 |