| Param | Original file | Final file |
|---|---|---|
| Filename | modeM0/AS1A09_059T01_9000003706_25355cztM0_level2.evt | modeM0/AS1A09_059T01_9000003706_25355cztM0_level2_quad_clean.evt |
| Size (bytes) | 502,462,080 | 81,564,480 |
| Size | 479.2 MB | 77.8 MB |
| Events in quadrant A | 3,843,364 | 509,753 |
| Events in quadrant B | 3,673,793 | 516,277 |
| Events in quadrant C | 3,307,304 | 491,622 |
| Events in quadrant D | 3,932,265 | 479,382 |
| Mode M0 | |||
|---|---|---|---|
| Quadrant | BADHDUFLAG | Total packets | Discarded packets |
| A | 0 | 15861 | 0 |
| B | 0 | 15123 | 0 |
| C | 0 | 14008 | 0 |
| D | 0 | 15996 | 0 |
| Mode M9 | |||
|---|---|---|---|
| Quadrant | BADHDUFLAG | Total packets | Discarded packets |
| A | 0 | 19 | 0 |
| B | 0 | 19 | 0 |
| C | 0 | 19 | 0 |
| D | 0 | 19 | 0 |
| Quadrant | Total seconds | Saturated seconds | Saturation percentage |
|---|---|---|---|
| A | 6783 | 50 | 0.737137% |
| B | 6784 | 65 | 0.958137% |
| C | 6784 | 64 | 0.943396% |
| D | 6784 | 87 | 1.282429% |
Noise dominated data is calculated using 1-second bins in cleaned event files. If a bin has >2000 counts, and if more than 50% of those come from <1% of pixels, then it is considered to be noise-dominated and hence unusable.
| Quadrant | # 1 sec bins | Bins with >0 counts | Bins with >2000 counts | High rate bins dominated by noise | Noise dominated (total time) | Noise dominated (detector-on time) | Marked lightcurve |
|---|---|---|---|---|---|---|---|
| A | 8723 | 6785 | 0 | 0 | 0.00% | 0.00% | 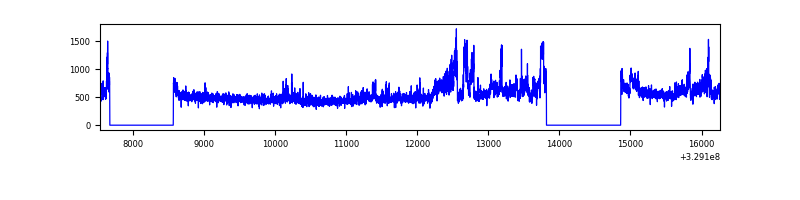 |
| B | 8724 | 6786 | 2 | 2 | 0.02% | 0.03% | 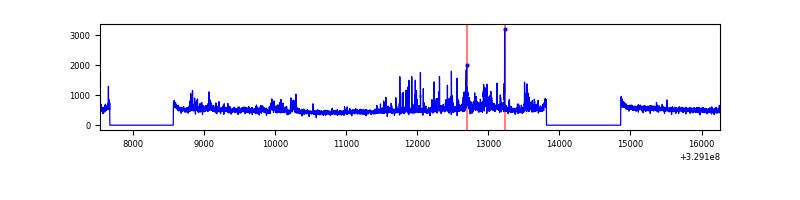 |
| C | 8724 | 6785 | 1 | 1 | 0.01% | 0.01% | 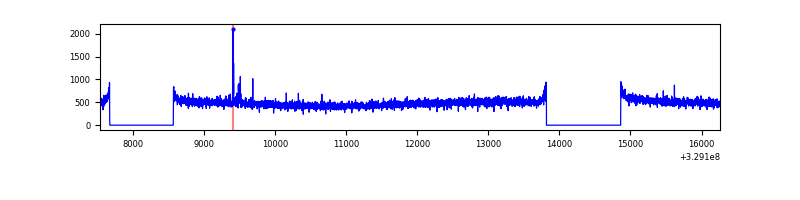 |
| D | 8724 | 6786 | 55 | 55 | 0.63% | 0.81% | 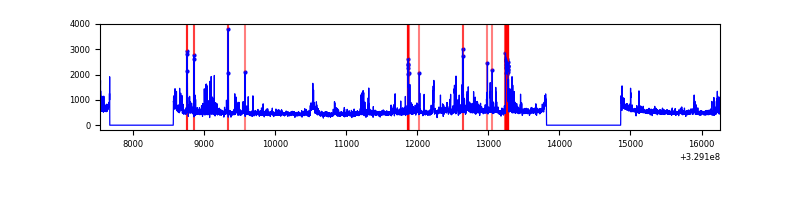 |
Top three noisy pixels from each quadrant. If the there are fewer than three noisy pixels in the level2.evt file, extra rows are filled as -1
| Pixel properties | Quadrant properties | ||||||
|---|---|---|---|---|---|---|---|
| Quadrant | DetID | PixID | Counts | Sigma | Mean | Median | Sigma |
| A | 6 | 16 | 545171 | 3220.6 | 846 | 827 | 169.0 |
| A | 15 | 173 | 28972 | 166.52 | 846 | 827 | 169.0 |
| A | 13 | 254 | 10889 | 59.53 | 846 | 827 | 169.0 |
| B | 3 | 112 | 163977 | 1013.76 | 841 | 819 | 160.9 |
| B | 7 | 219 | 109113 | 672.87 | 841 | 819 | 160.9 |
| B | 7 | 235 | 45269 | 276.18 | 841 | 819 | 160.9 |
| C | 14 | 238 | 130382 | 684.05 | 807 | 814 | 189.4 |
| C | 9 | 54 | 20943 | 106.27 | 807 | 814 | 189.4 |
| C | 3 | 233 | 11333 | 55.53 | 807 | 814 | 189.4 |
| D | 1 | 52 | 350610 | 1774.63 | 816 | 792 | 197.1 |
| D | 8 | 195 | 239734 | 1212.16 | 816 | 792 | 197.1 |
| D | 9 | 35 | 170216 | 859.49 | 816 | 792 | 197.1 |
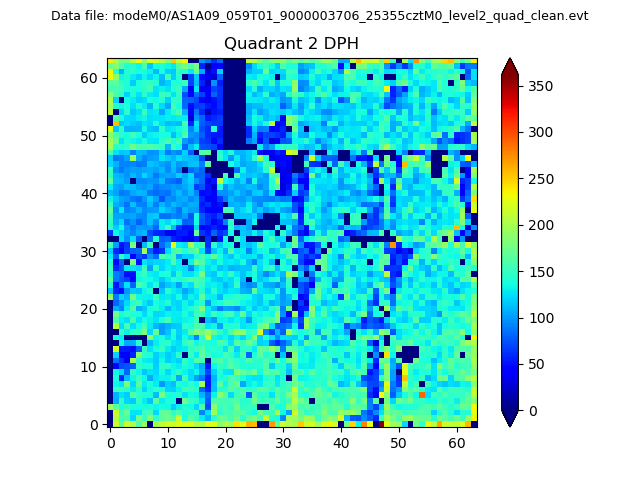
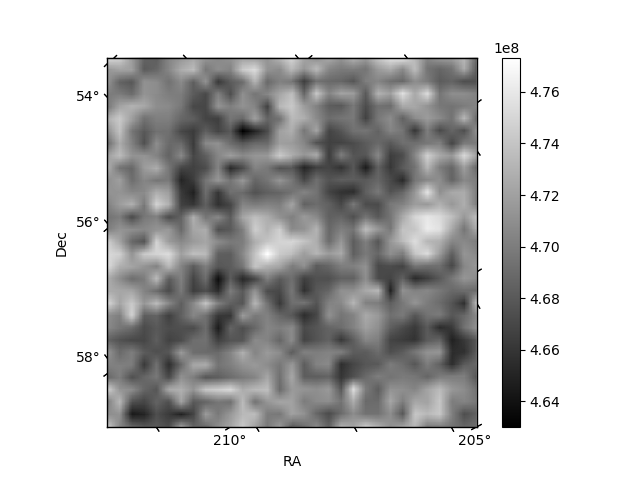
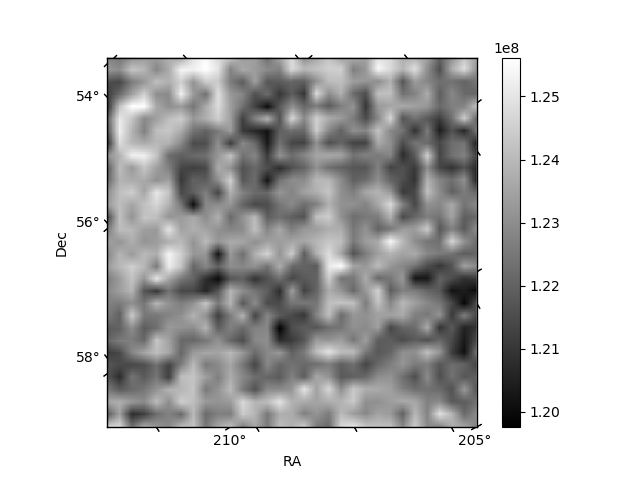
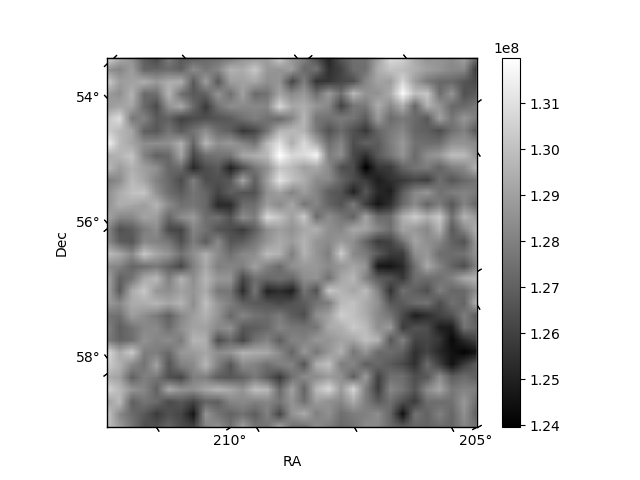
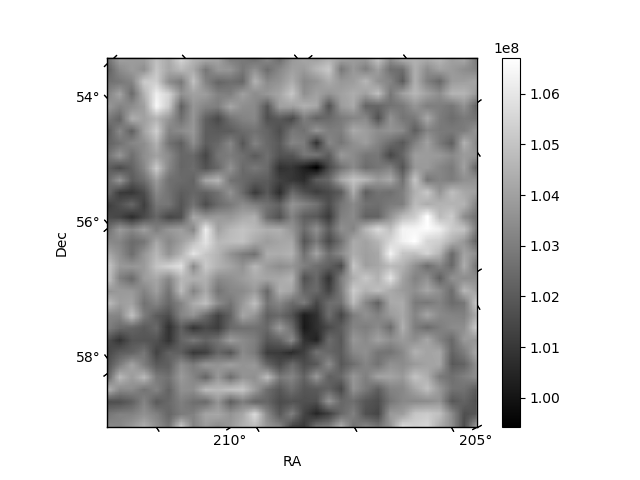
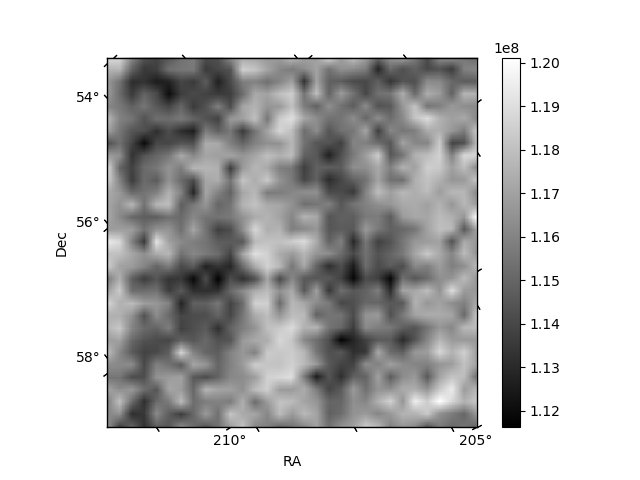
Histogram calculated using DETX and DETY for each event in the final _common_clean file
| Quadrant A | 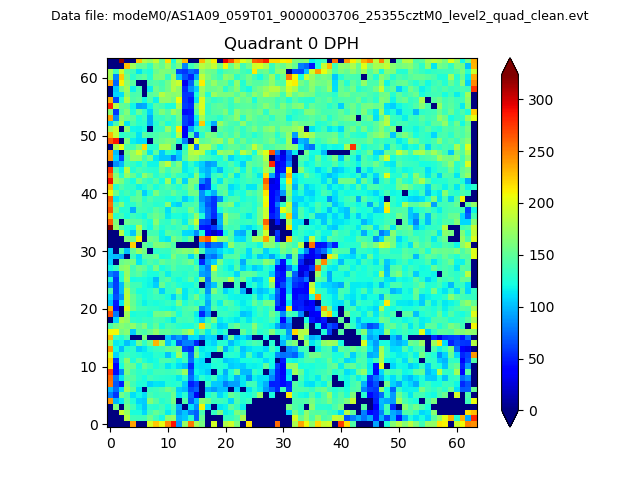 |
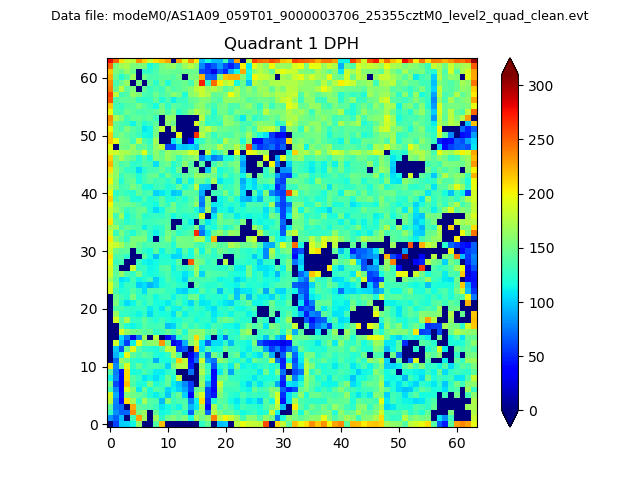 |
Quadrant B |
|---|---|---|---|
| Quadrant D | 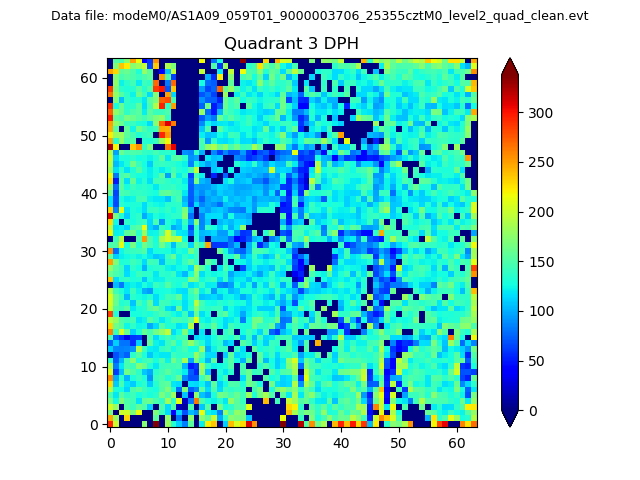 |
 |
Quadrant C |
| Plot type | Count rate plots | Images |
|---|---|---|
| Comparison with Poisson distribution Blue bars denote a histogram of data divided into 1 sec bins. Red curve is a Poisson curve with rate = median count rate of data. |
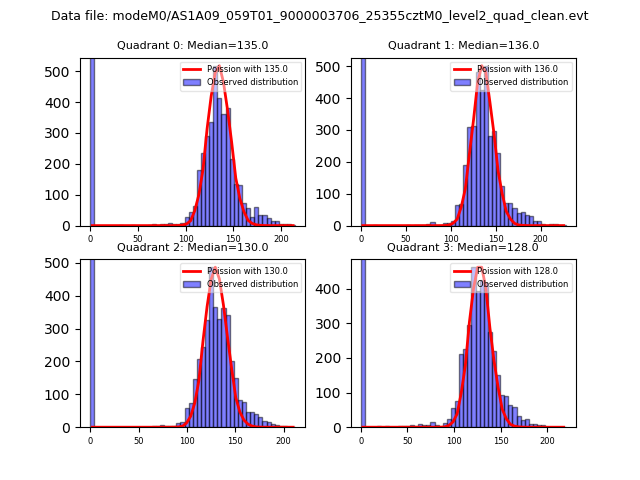 |
 |
| Quadrant-wise count rates Data is divided into 100 sec bins |
 |
|
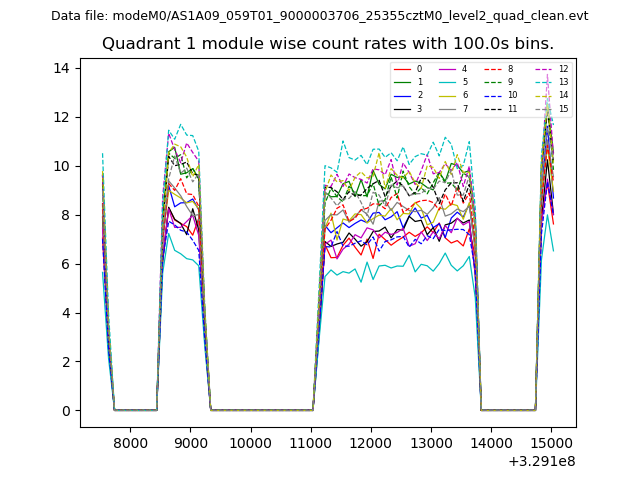
| Module-wise count rates for Quadrant A Data is divided into 100 sec bins |
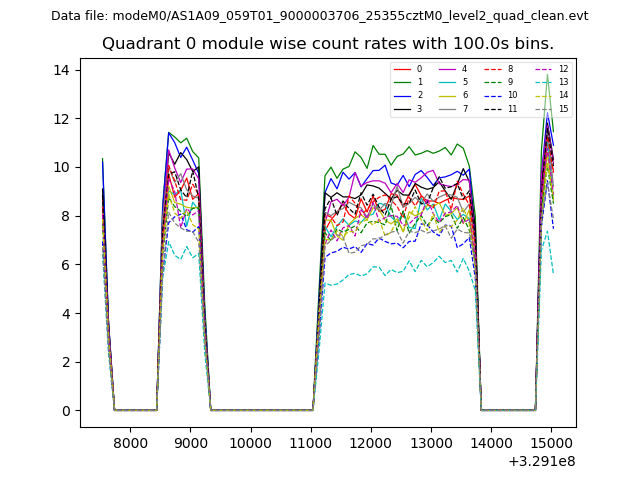 |
 |
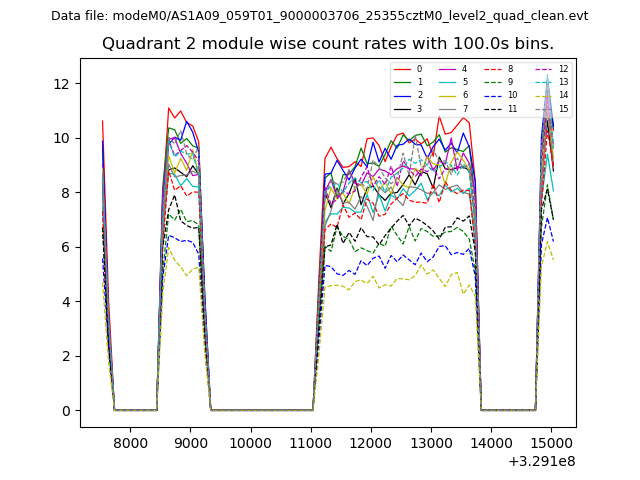
| Module-wise count rates for Quadrant B Data is divided into 100 sec bins |
 |
 |
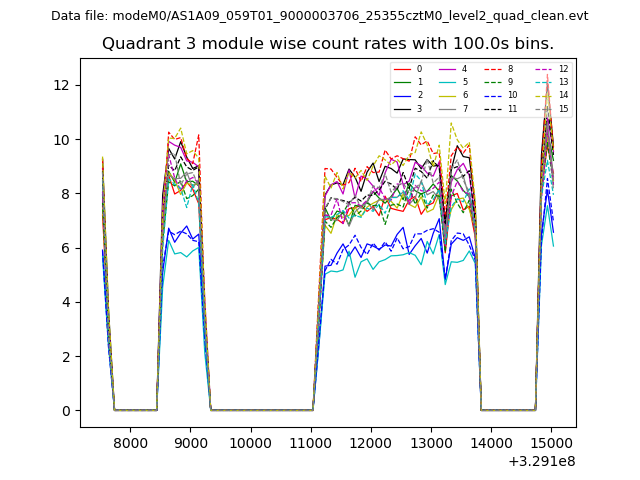
| Module-wise count rates for Quadrant C Data is divided into 100 sec bins |
 |
 |
| Module-wise count rates for Quadrant D Data is divided into 100 sec bins |
 |
 |
| Parameter | Plot |
|---|---|
| CZT HV Monitor | 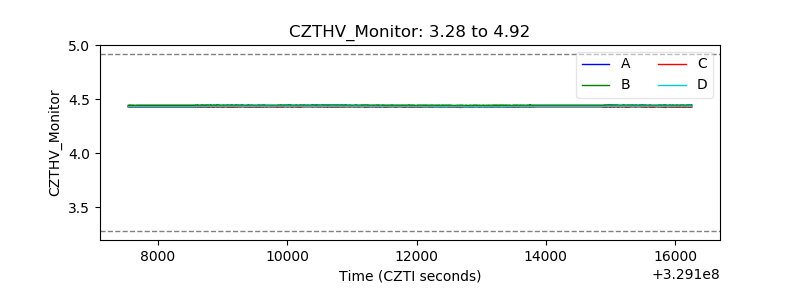 |
| D_VDD | 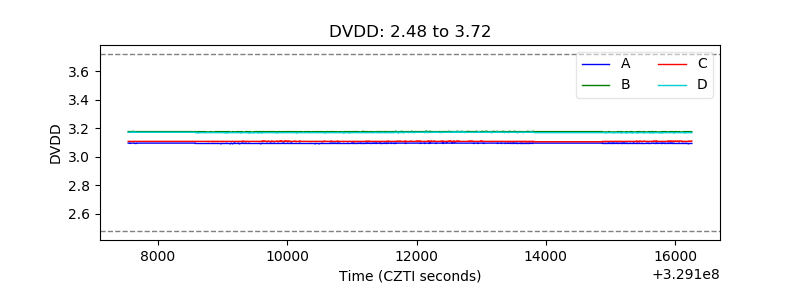 |
| Temperature 1 | 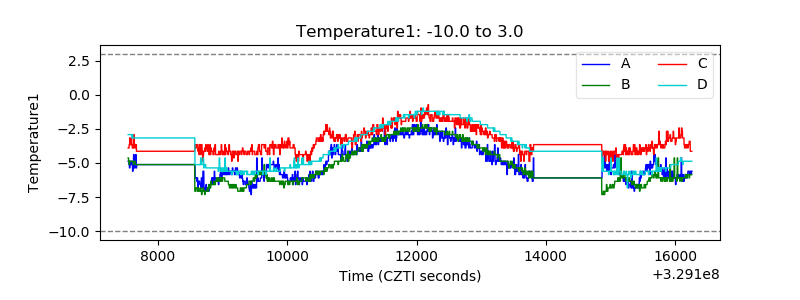 |
| Veto HV Monitor |  |
| Veto LLD | 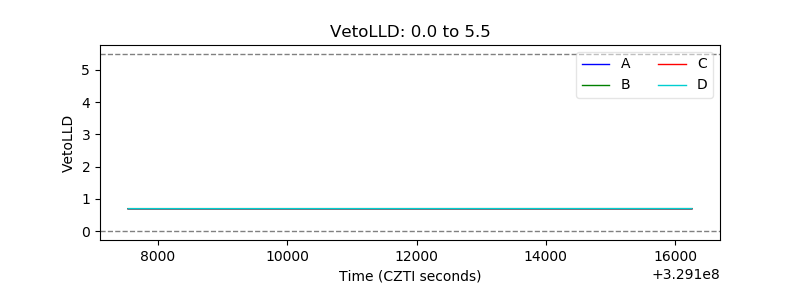 |
| Alpha Counter |  |
| _CPM_Rate |  |
| CZT Counter | 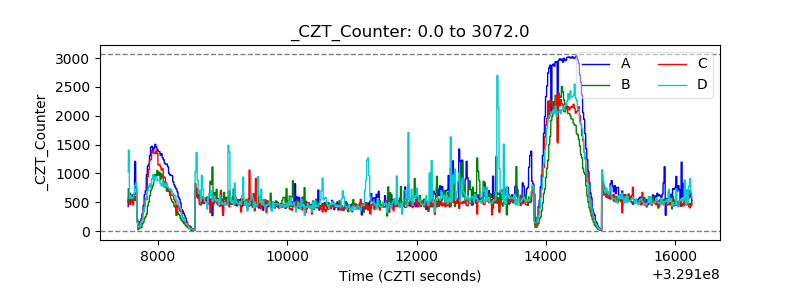 |
| +2.5 Volts monitor |  |
| +5 Volts monitor |  |
| _ROLL_ROT | 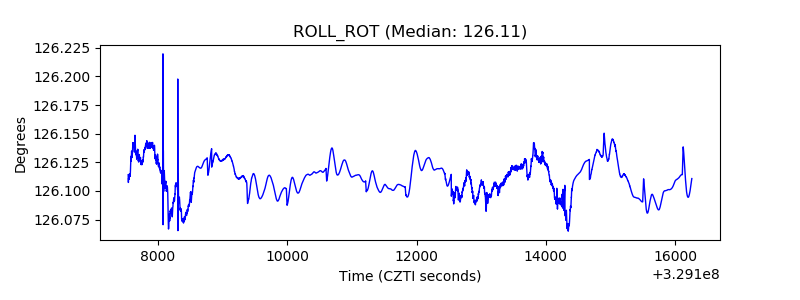 |
| _Roll_DEC | 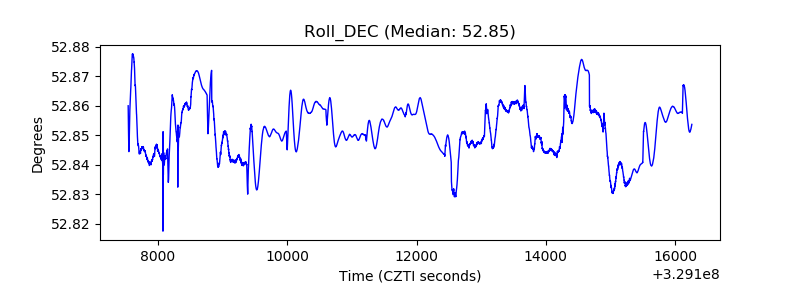 |
| _Roll_RA | 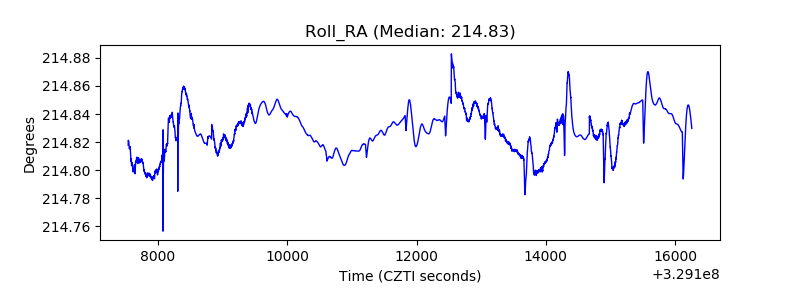 |
| Veto Counter | 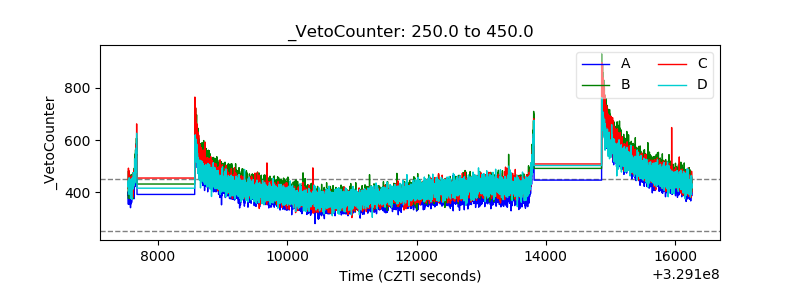 |