| Param | Original file | Final file |
|---|---|---|
| Filename | modeM0/AS1A09_059T01_9000003706_25357cztM0_level2.evt | modeM0/AS1A09_059T01_9000003706_25357cztM0_level2_quad_clean.evt |
| Size (bytes) | 504,195,840 | 71,398,080 |
| Size | 480.8 MB | 68.1 MB |
| Events in quadrant A | 3,811,010 | 439,767 |
| Events in quadrant B | 3,378,428 | 444,939 |
| Events in quadrant C | 3,292,932 | 419,071 |
| Events in quadrant D | 4,349,717 | 408,043 |
| Mode M0 | |||
|---|---|---|---|
| Quadrant | BADHDUFLAG | Total packets | Discarded packets |
| A | 0 | 15502 | 0 |
| B | 0 | 13927 | 0 |
| C | 0 | 13727 | 0 |
| D | 0 | 17147 | 0 |
| Mode M9 | |||
|---|---|---|---|
| Quadrant | BADHDUFLAG | Total packets | Discarded packets |
| A | 0 | 12 | 0 |
| B | 0 | 12 | 0 |
| C | 0 | 12 | 0 |
| D | 0 | 12 | 0 |
| Quadrant | Total seconds | Saturated seconds | Saturation percentage |
|---|---|---|---|
| A | 6454 | 66 | 1.022622% |
| B | 6454 | 76 | 1.177564% |
| C | 6454 | 86 | 1.332507% |
| D | 6455 | 131 | 2.029435% |
Noise dominated data is calculated using 1-second bins in cleaned event files. If a bin has >2000 counts, and if more than 50% of those come from <1% of pixels, then it is considered to be noise-dominated and hence unusable.
| Quadrant | # 1 sec bins | Bins with >0 counts | Bins with >2000 counts | High rate bins dominated by noise | Noise dominated (total time) | Noise dominated (detector-on time) | Marked lightcurve |
|---|---|---|---|---|---|---|---|
| A | 7609 | 6454 | 0 | 0 | 0.00% | 0.00% | 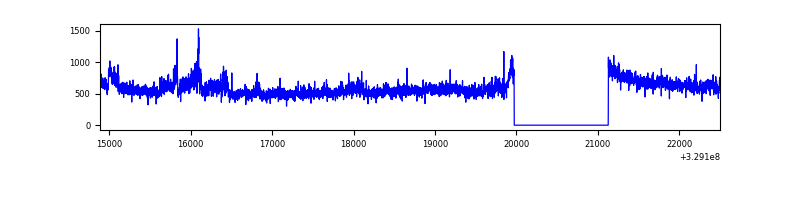 |
| B | 7609 | 6454 | 3 | 3 | 0.04% | 0.05% | 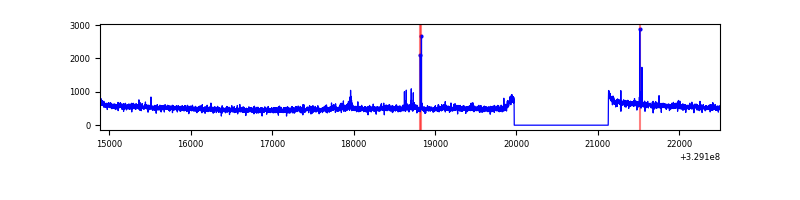 |
| C | 7609 | 6454 | 0 | 0 | 0.00% | 0.00% | 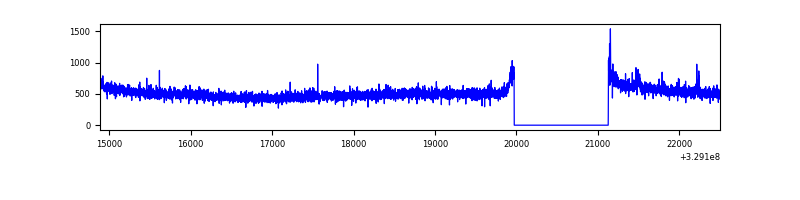 |
| D | 7610 | 6455 | 75 | 75 | 0.99% | 1.16% | 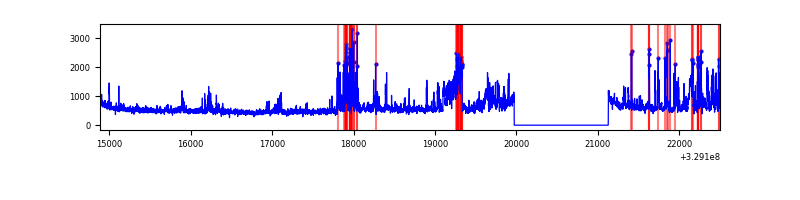 |
Top three noisy pixels from each quadrant. If the there are fewer than three noisy pixels in the level2.evt file, extra rows are filled as -1
| Pixel properties | Quadrant properties | ||||||
|---|---|---|---|---|---|---|---|
| Quadrant | DetID | PixID | Counts | Sigma | Mean | Median | Sigma |
| A | 6 | 16 | 507593 | 2991.86 | 852 | 838 | 169.4 |
| A | 15 | 173 | 17321 | 97.32 | 852 | 838 | 169.4 |
| A | 13 | 254 | 9857 | 53.25 | 852 | 838 | 169.4 |
| B | 3 | 112 | 28394 | 174.57 | 844 | 825 | 157.9 |
| B | 0 | 229 | 22746 | 138.8 | 844 | 825 | 157.9 |
| B | 12 | 111 | 19087 | 115.64 | 844 | 825 | 157.9 |
| C | 14 | 238 | 131000 | 699.57 | 802 | 806 | 186.1 |
| C | 3 | 233 | 31853 | 166.82 | 802 | 806 | 186.1 |
| C | 13 | 61 | 5686 | 26.22 | 802 | 806 | 186.1 |
| D | 9 | 35 | 582622 | 2968.97 | 815 | 792 | 196.0 |
| D | 1 | 52 | 277949 | 1414.28 | 815 | 792 | 196.0 |
| D | 8 | 195 | 203144 | 1032.56 | 815 | 792 | 196.0 |
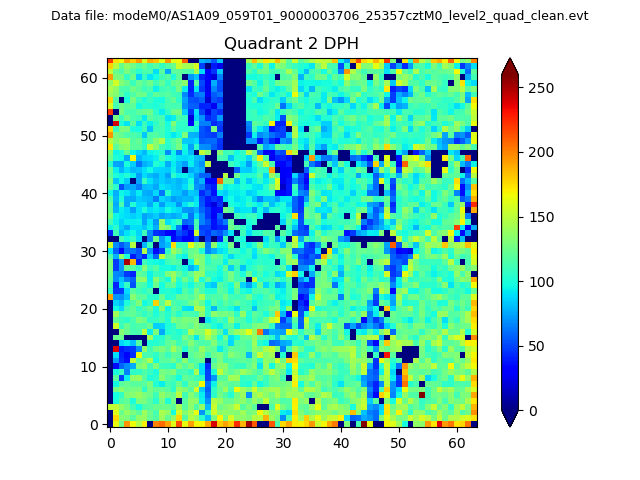
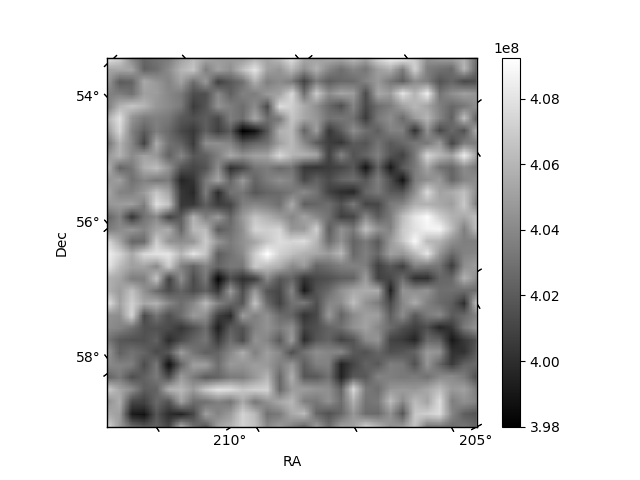
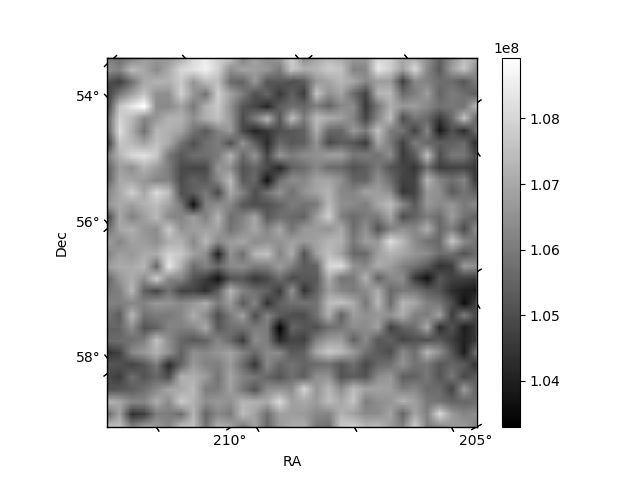
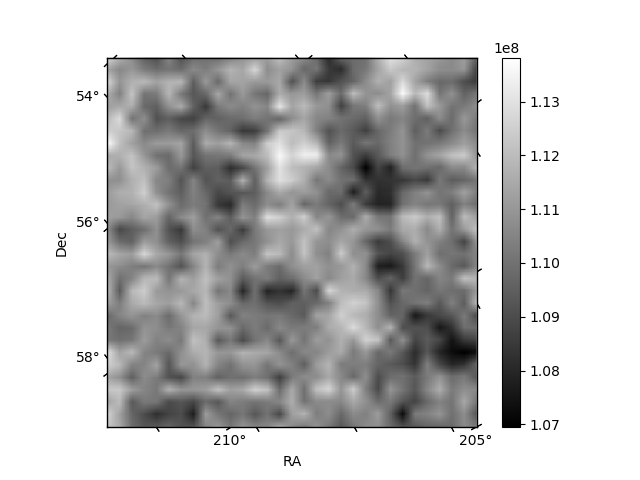
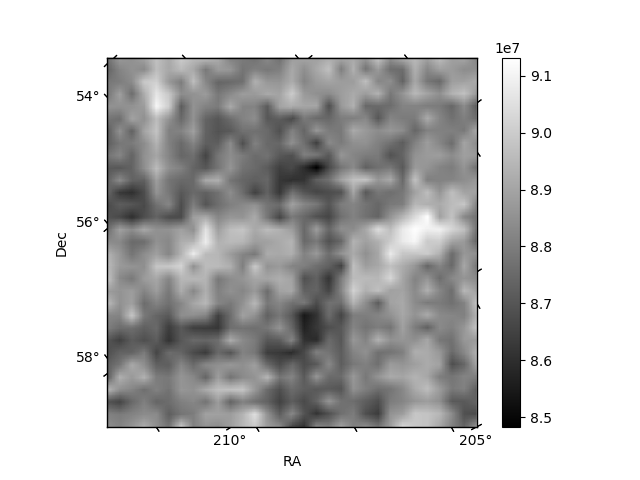
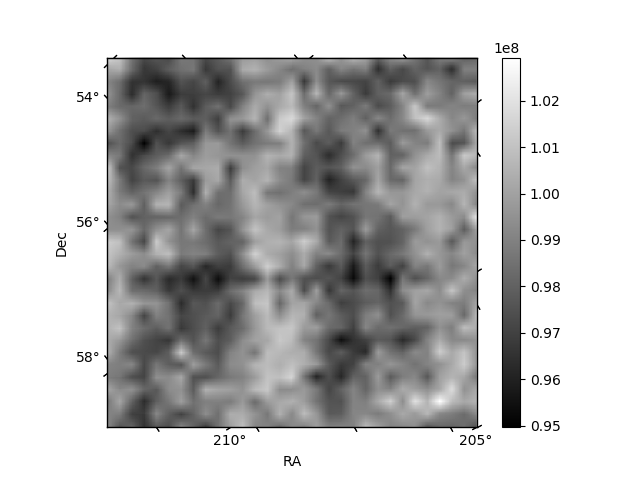
Histogram calculated using DETX and DETY for each event in the final _common_clean file
| Quadrant A | 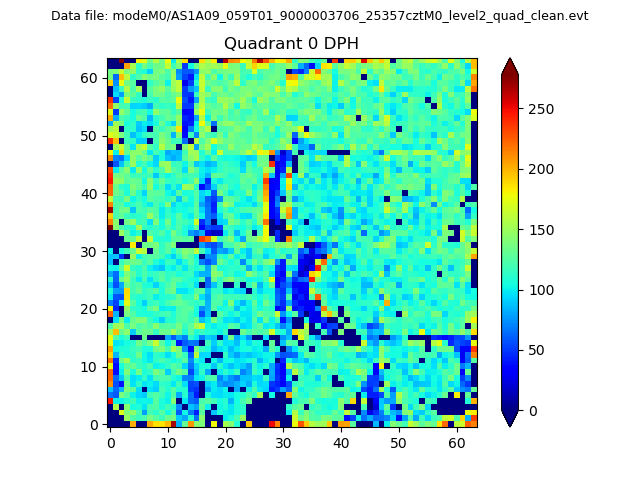 |
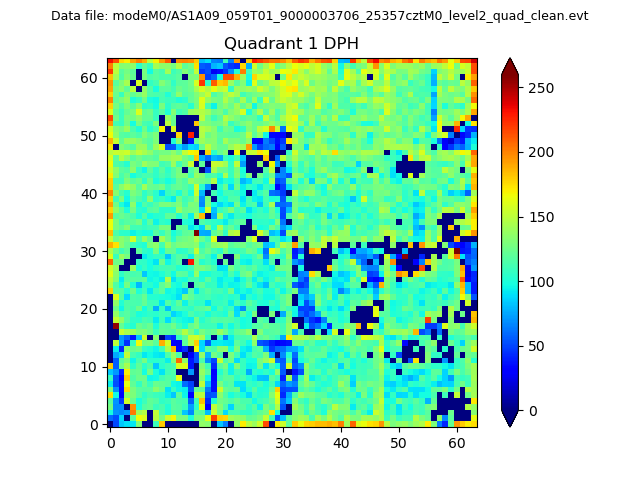 |
Quadrant B |
|---|---|---|---|
| Quadrant D | 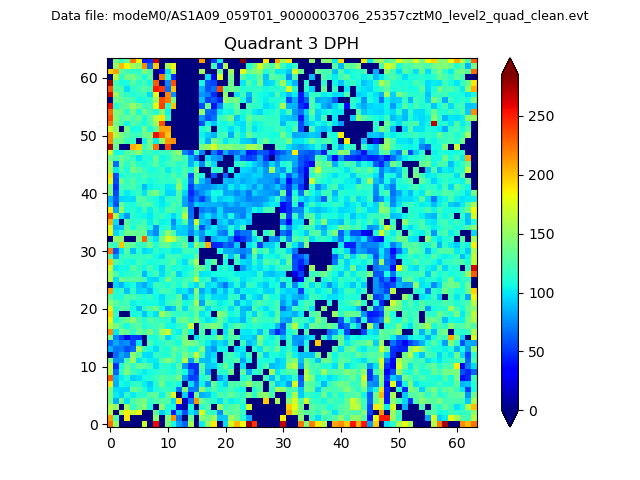 |
 |
Quadrant C |
| Plot type | Count rate plots | Images |
|---|---|---|
| Comparison with Poisson distribution Blue bars denote a histogram of data divided into 1 sec bins. Red curve is a Poisson curve with rate = median count rate of data. |
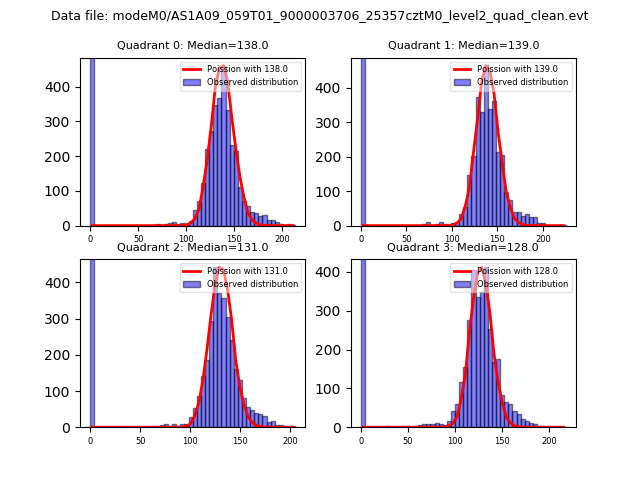 |
 |
| Quadrant-wise count rates Data is divided into 100 sec bins |
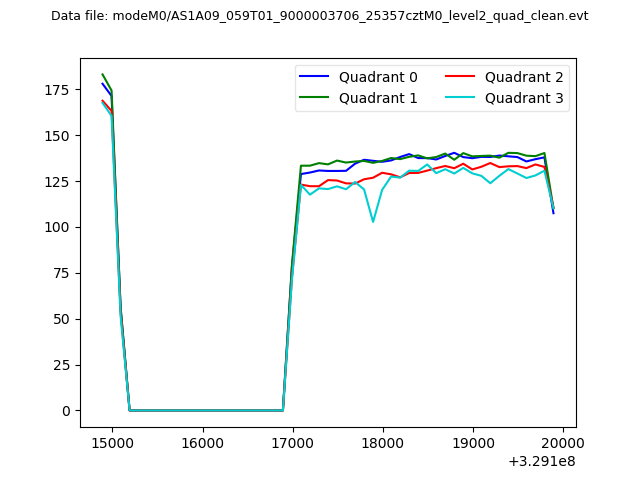 |
|
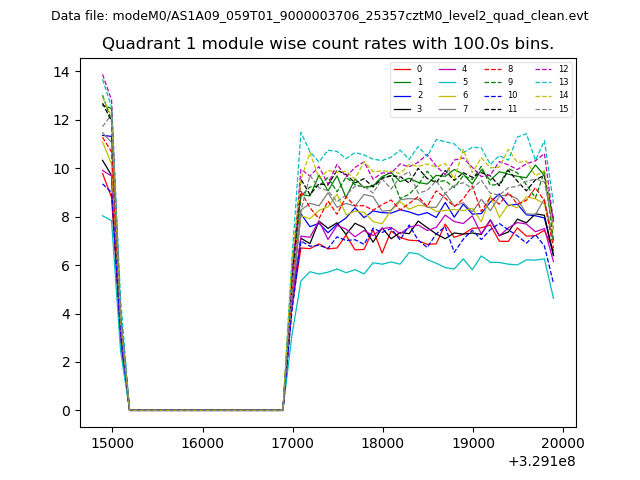
| Module-wise count rates for Quadrant A Data is divided into 100 sec bins |
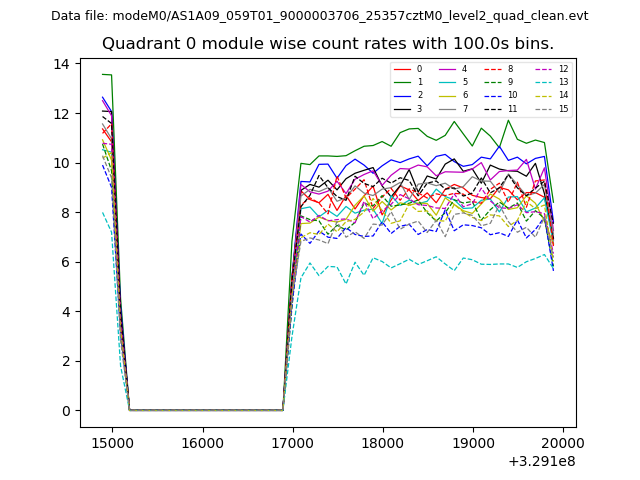 |
 |
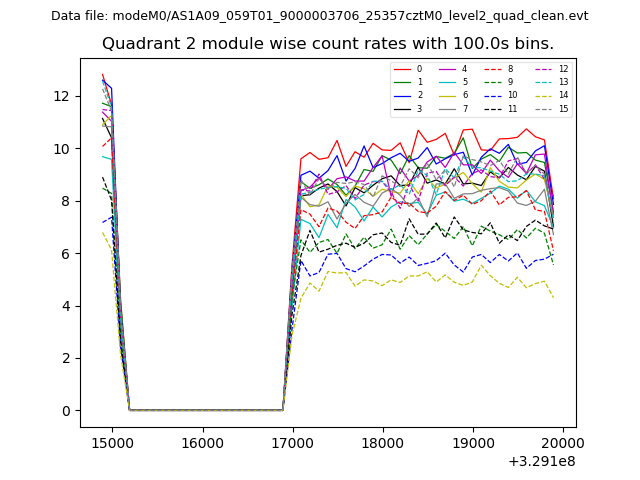
| Module-wise count rates for Quadrant B Data is divided into 100 sec bins |
 |
 |
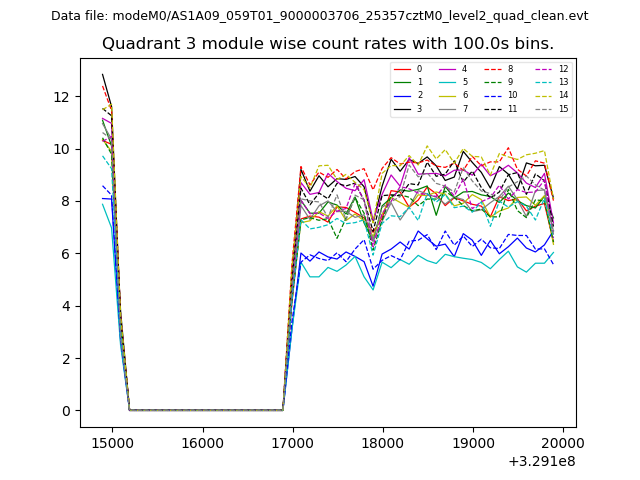
| Module-wise count rates for Quadrant C Data is divided into 100 sec bins |
 |
 |
| Module-wise count rates for Quadrant D Data is divided into 100 sec bins |
 |
 |
| Parameter | Plot |
|---|---|
| CZT HV Monitor | 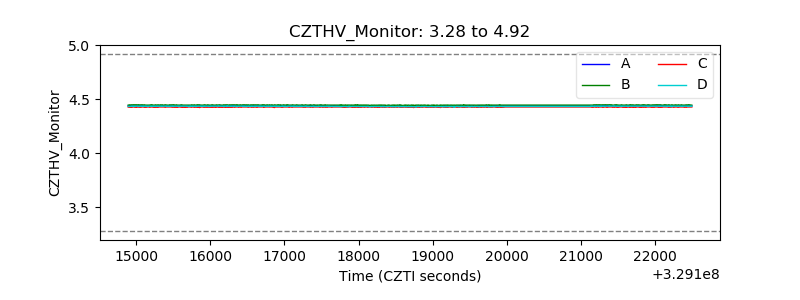 |
| D_VDD | 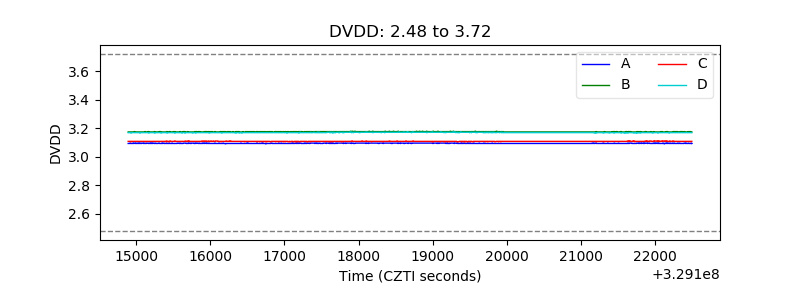 |
| Temperature 1 | 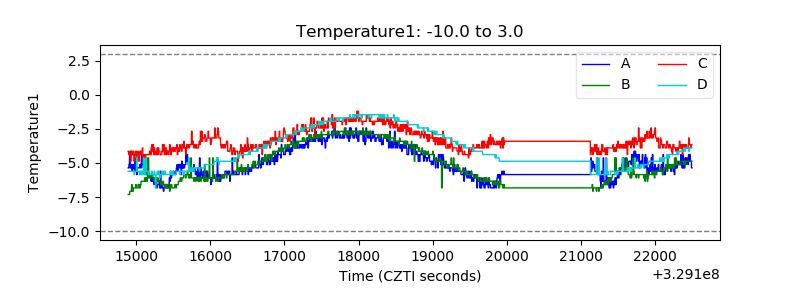 |
| Veto HV Monitor | 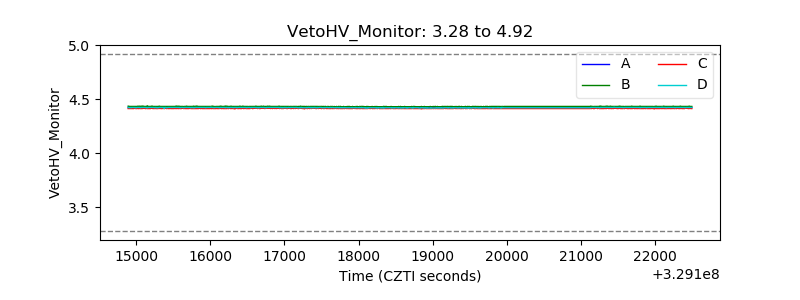 |
| Veto LLD | 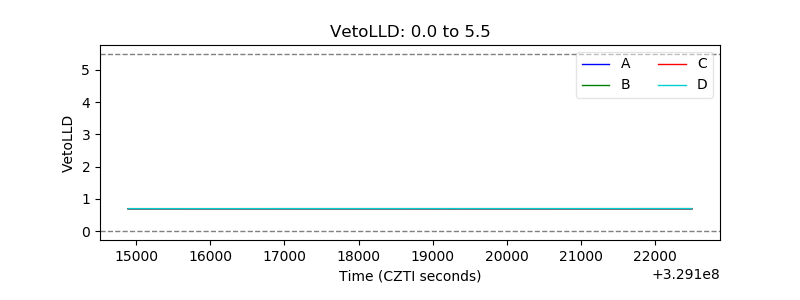 |
| Alpha Counter | 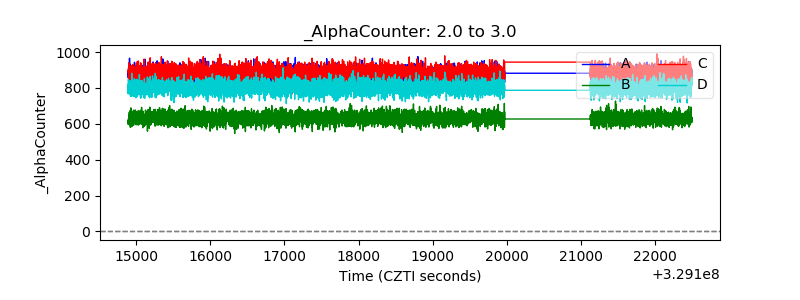 |
| _CPM_Rate | 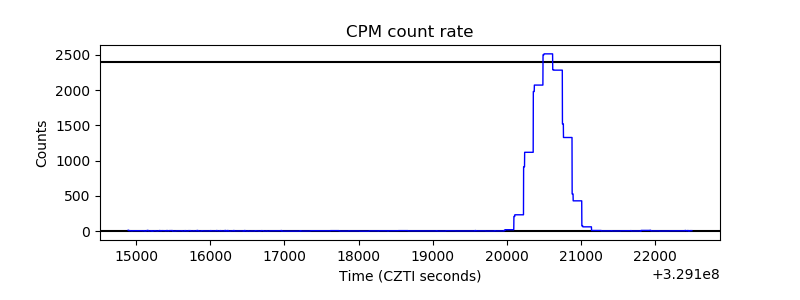 |
| CZT Counter | 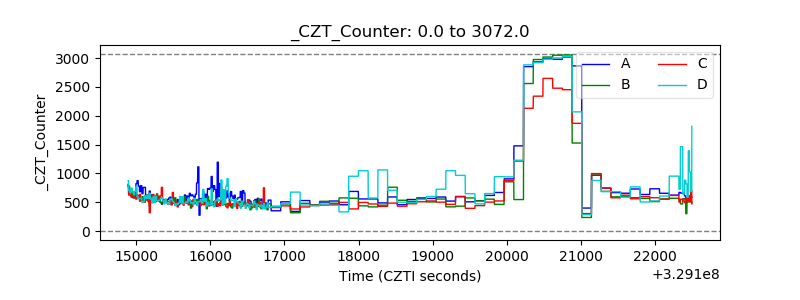 |
| +2.5 Volts monitor |  |
| +5 Volts monitor | 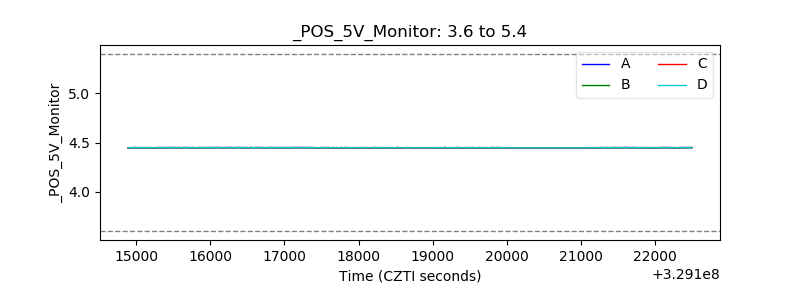 |
| _ROLL_ROT | 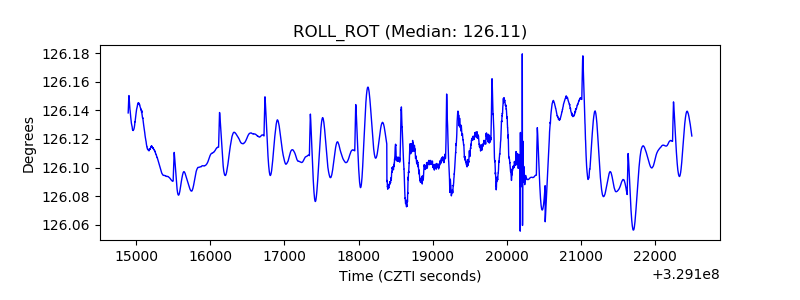 |
| _Roll_DEC | 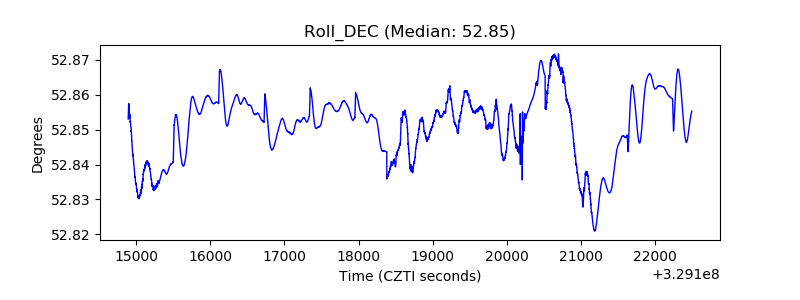 |
| _Roll_RA | 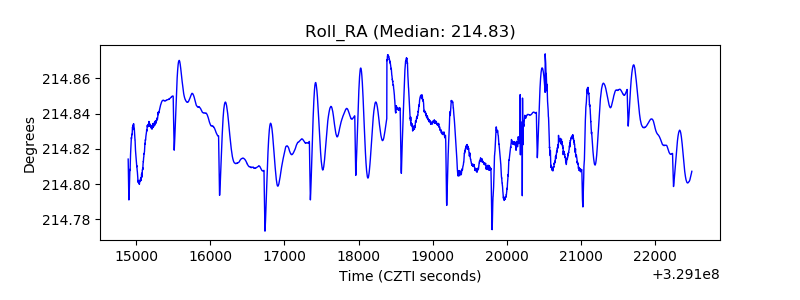 |
| Veto Counter | 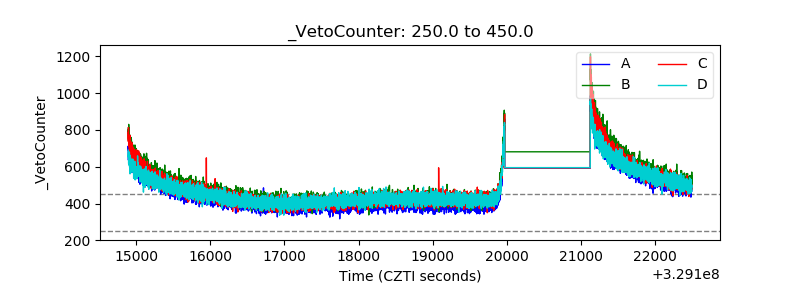 |