| Param | Original file | Final file |
|---|---|---|
| Filename | modeM0/AS1A09_059T01_9000003706_25358cztM0_level2.evt | modeM0/AS1A09_059T01_9000003706_25358cztM0_level2_quad_clean.evt |
| Size (bytes) | 426,689,280 | 62,346,240 |
| Size | 406.9 MB | 59.5 MB |
| Events in quadrant A | 2,852,029 | 406,781 |
| Events in quadrant B | 2,416,461 | 411,039 |
| Events in quadrant C | 3,069,609 | 375,435 |
| Events in quadrant D | 4,273,974 | 372,915 |
| Mode M0 | |||
|---|---|---|---|
| Quadrant | BADHDUFLAG | Total packets | Discarded packets |
| A | 0 | 11649 | 0 |
| B | 0 | 9859 | 0 |
| C | 0 | 12001 | 0 |
| D | 0 | 15991 | 0 |
| Mode M9 | |||
|---|---|---|---|
| Quadrant | BADHDUFLAG | Total packets | Discarded packets |
| A | 0 | 6 | 0 |
| B | 0 | 7 | 0 |
| C | 0 | 7 | 0 |
| D | 0 | 7 | 0 |
| Quadrant | Total seconds | Saturated seconds | Saturation percentage |
|---|---|---|---|
| A | 4572 | 24 | 0.524934% |
| B | 4572 | 25 | 0.546807% |
| C | 4572 | 181 | 3.958880% |
| D | 4572 | 133 | 2.909011% |
Noise dominated data is calculated using 1-second bins in cleaned event files. If a bin has >2000 counts, and if more than 50% of those come from <1% of pixels, then it is considered to be noise-dominated and hence unusable.
| Quadrant | # 1 sec bins | Bins with >0 counts | Bins with >2000 counts | High rate bins dominated by noise | Noise dominated (total time) | Noise dominated (detector-on time) | Marked lightcurve |
|---|---|---|---|---|---|---|---|
| A | 4572 | 4572 | 1 | 1 | 0.02% | 0.02% | 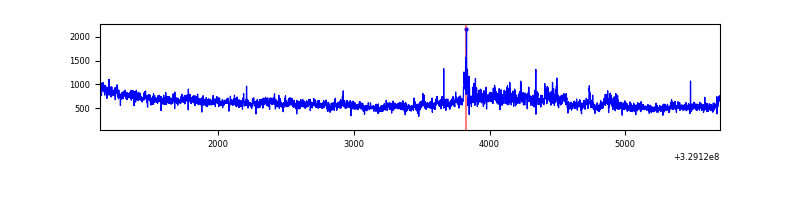 |
| B | 4572 | 4572 | 1 | 1 | 0.02% | 0.02% | 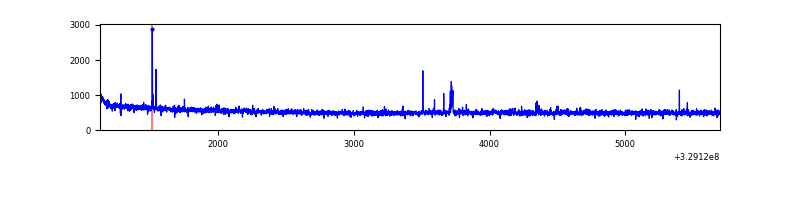 |
| C | 4572 | 4572 | 46 | 46 | 1.01% | 1.01% | 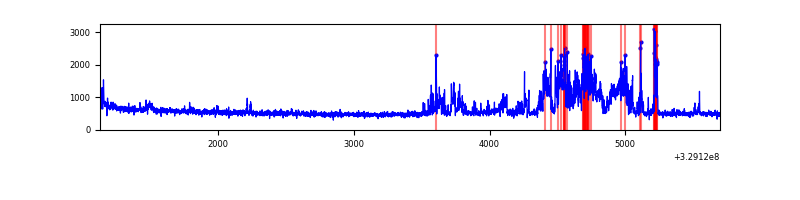 |
| D | 4572 | 4572 | 116 | 116 | 2.54% | 2.54% | 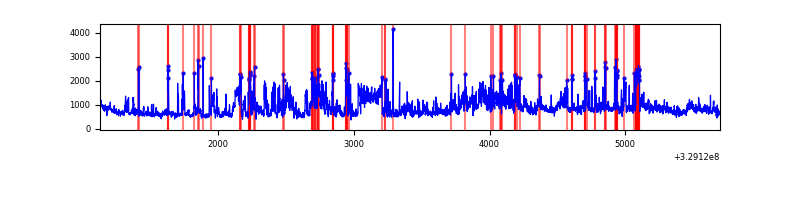 |
Top three noisy pixels from each quadrant. If the there are fewer than three noisy pixels in the level2.evt file, extra rows are filled as -1
| Pixel properties | Quadrant properties | ||||||
|---|---|---|---|---|---|---|---|
| Quadrant | DetID | PixID | Counts | Sigma | Mean | Median | Sigma |
| A | 6 | 16 | 475554 | 3908.59 | 612 | 601 | 121.5 |
| A | 15 | 173 | 12183 | 95.31 | 612 | 601 | 121.5 |
| A | 13 | 254 | 6723 | 50.38 | 612 | 601 | 121.5 |
| B | 0 | 229 | 20850 | 179.81 | 604 | 591 | 112.7 |
| B | 3 | 112 | 19048 | 163.81 | 604 | 591 | 112.7 |
| B | 0 | 190 | 13433 | 113.98 | 604 | 591 | 112.7 |
| C | 9 | 54 | 720123 | 5454.61 | 570 | 575 | 131.9 |
| C | 14 | 238 | 94736 | 713.8 | 570 | 575 | 131.9 |
| C | 3 | 233 | 34678 | 258.52 | 570 | 575 | 131.9 |
| D | 9 | 35 | 1548947 | 10894.45 | 585 | 568 | 142.1 |
| D | 1 | 52 | 346839 | 2436.38 | 585 | 568 | 142.1 |
| D | 8 | 195 | 121319 | 849.61 | 585 | 568 | 142.1 |
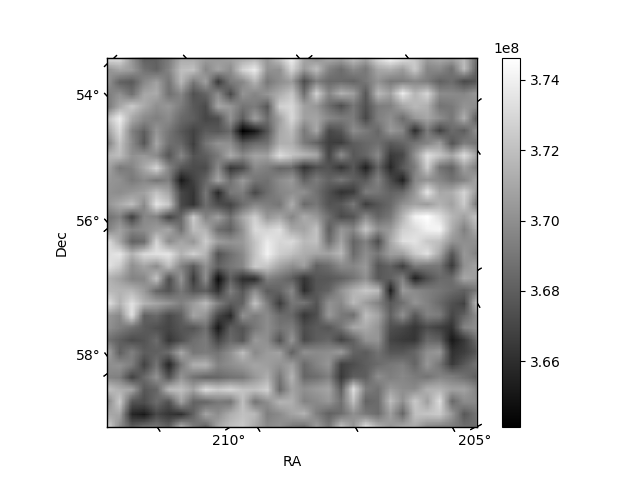
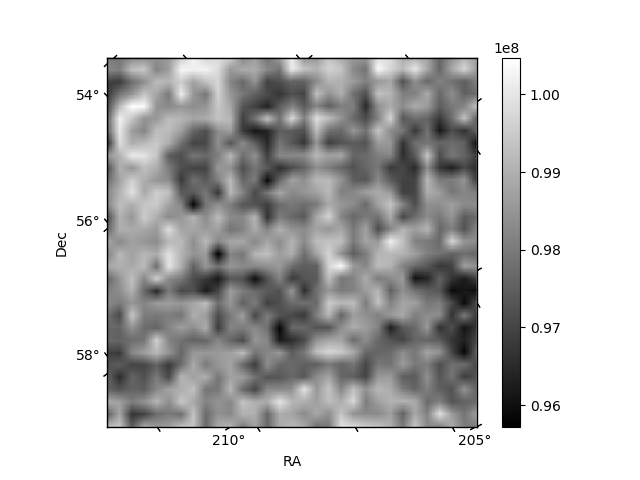
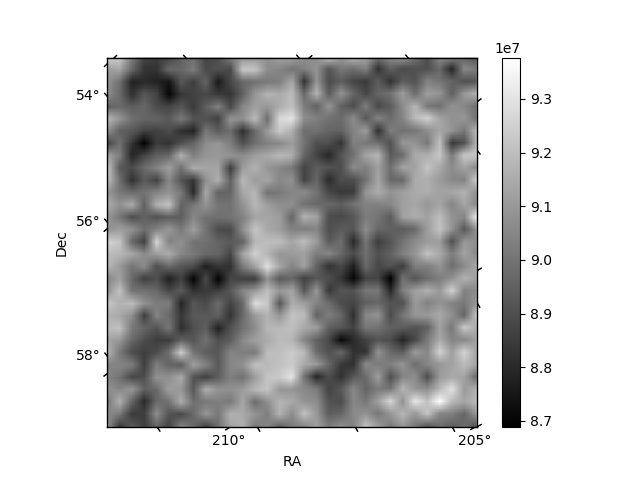
Histogram calculated using DETX and DETY for each event in the final _common_clean file
| Quadrant A | 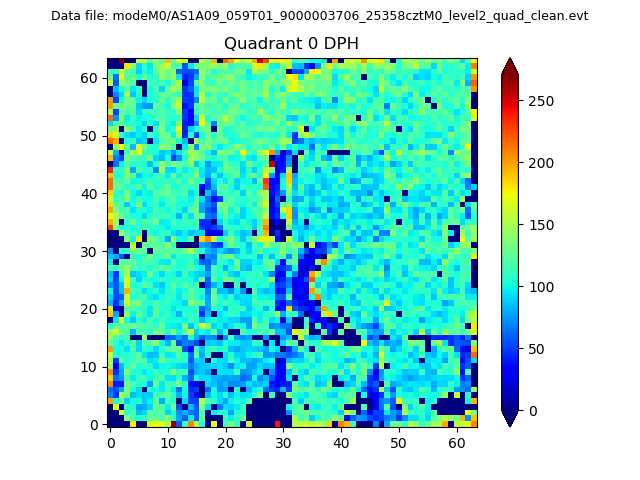 |
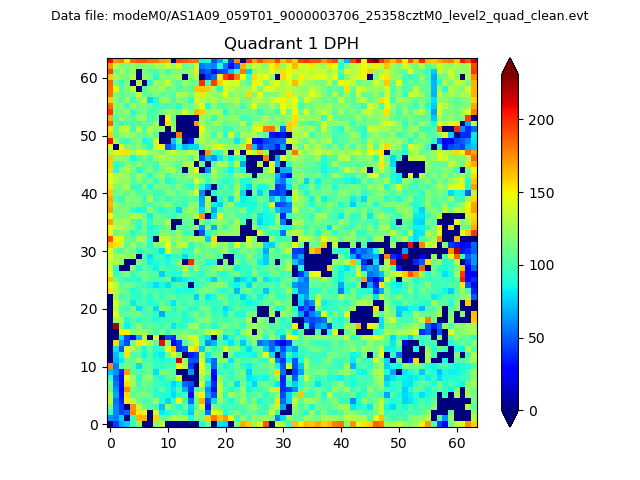 |
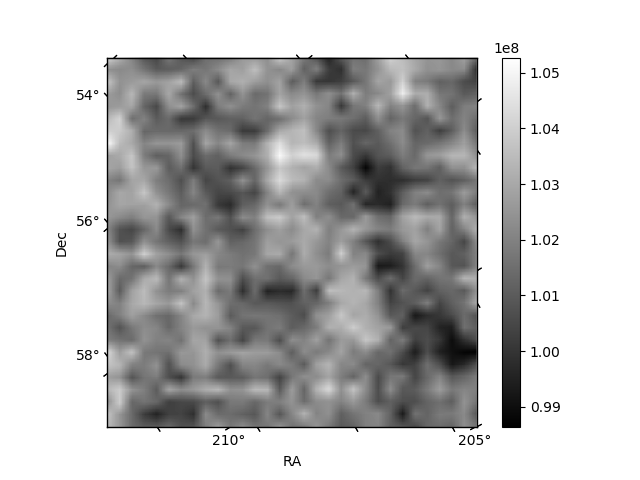
Quadrant B |
|---|---|---|---|
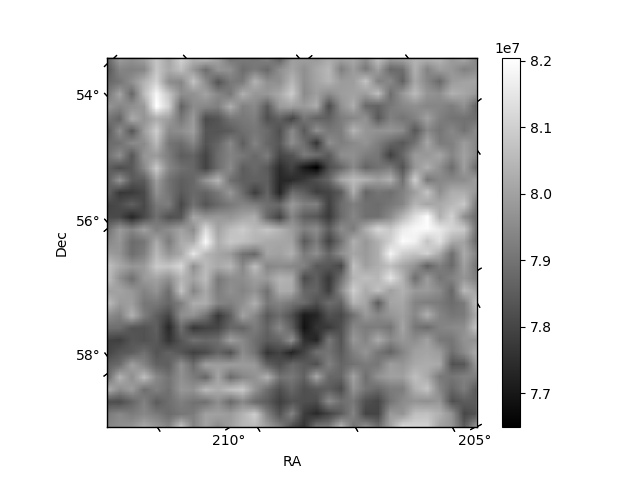
| Quadrant D | 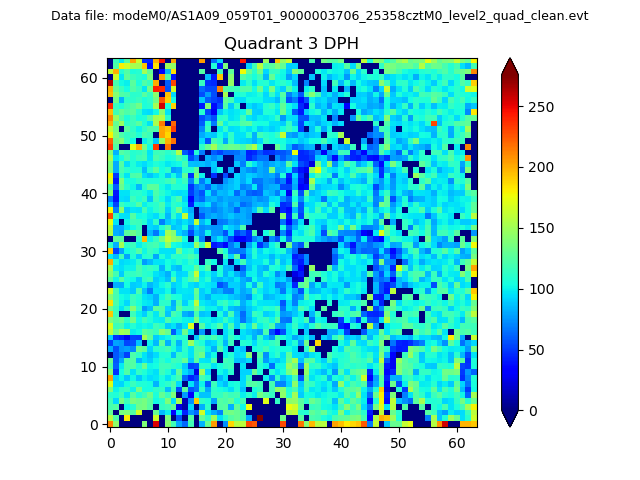 |
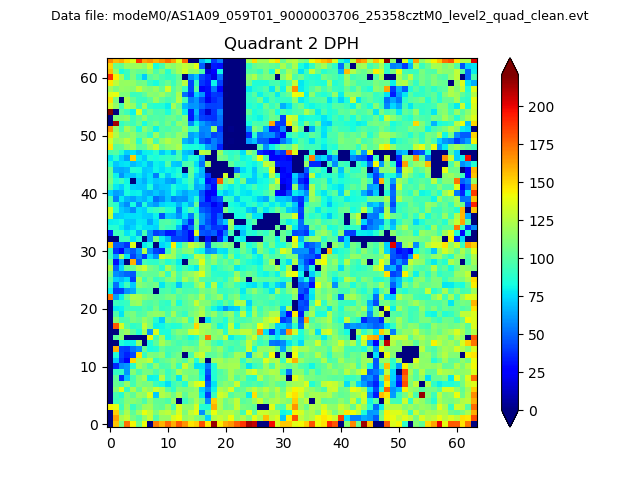 |
Quadrant C |
| Plot type | Count rate plots | Images |
|---|---|---|
| Comparison with Poisson distribution Blue bars denote a histogram of data divided into 1 sec bins. Red curve is a Poisson curve with rate = median count rate of data. |
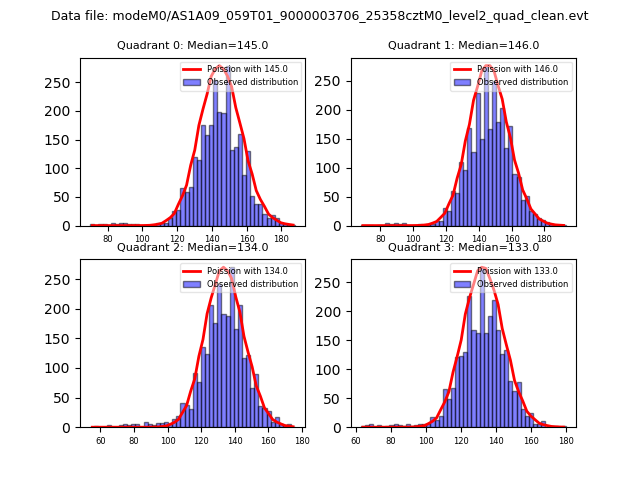 |
 |
| Quadrant-wise count rates Data is divided into 100 sec bins |
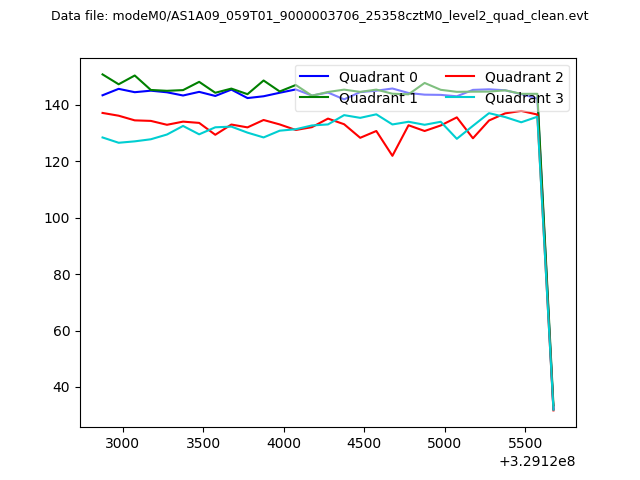 |
|
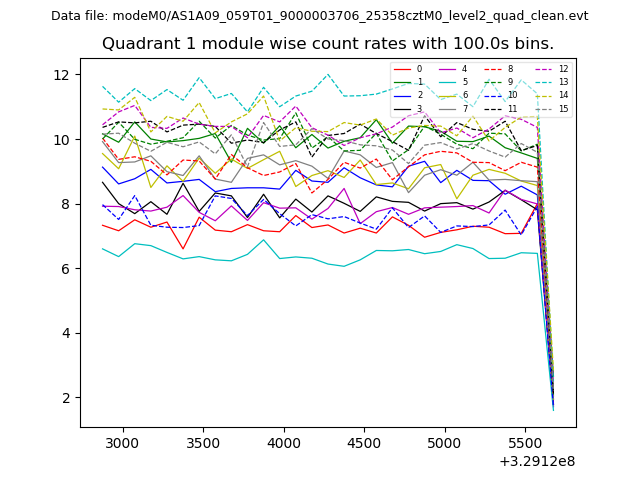
| Module-wise count rates for Quadrant A Data is divided into 100 sec bins |
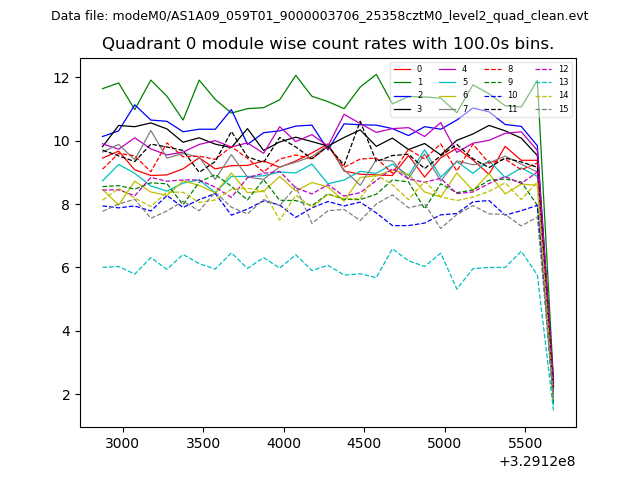 |
 |
| Module-wise count rates for Quadrant B Data is divided into 100 sec bins |
 |
 |
| Module-wise count rates for Quadrant C Data is divided into 100 sec bins |
 |
 |
| Module-wise count rates for Quadrant D Data is divided into 100 sec bins |
 |
 |
| Parameter | Plot |
|---|---|
| CZT HV Monitor |  |
| D_VDD | 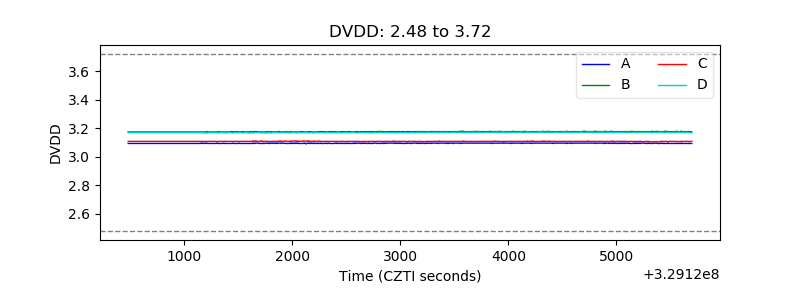 |
| Temperature 1 | 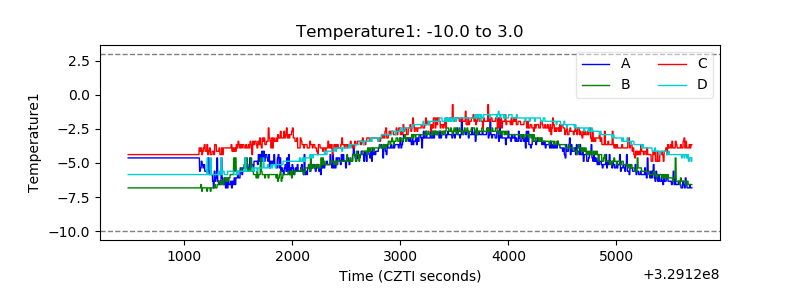 |
| Veto HV Monitor |  |
| Veto LLD | 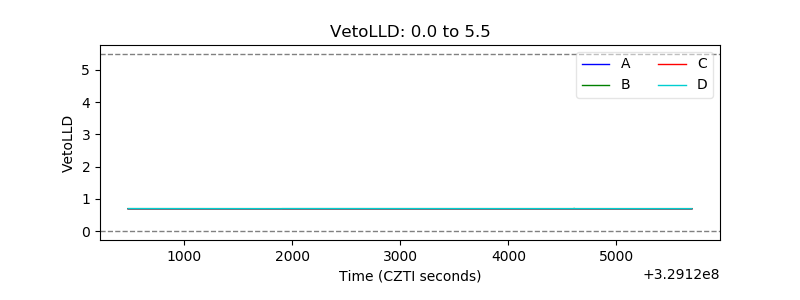 |
| Alpha Counter | 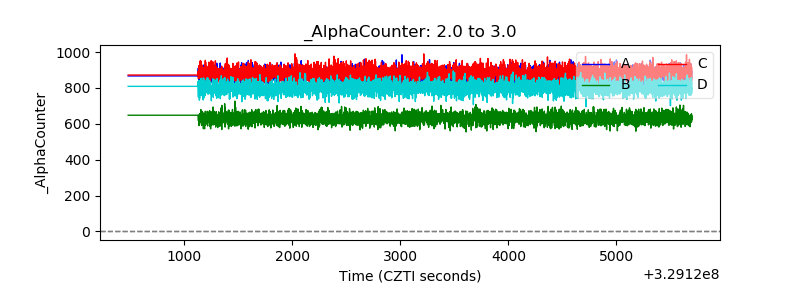 |
| _CPM_Rate | 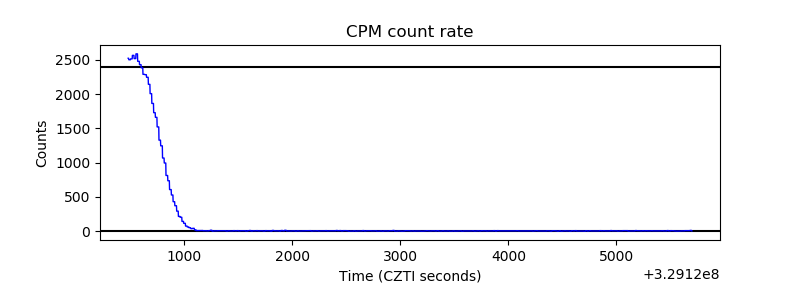 |
| CZT Counter | 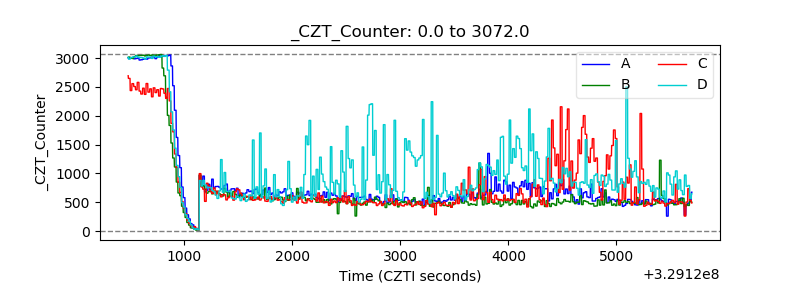 |
| +2.5 Volts monitor | 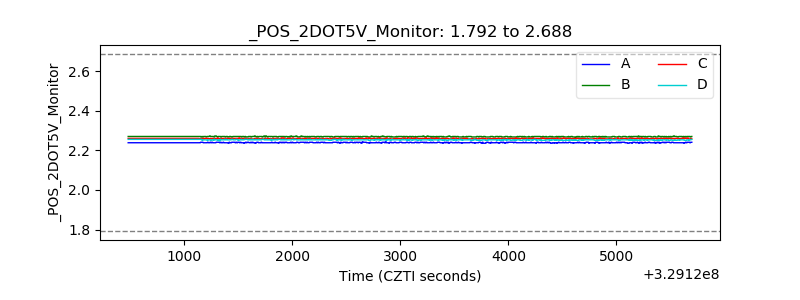 |
| +5 Volts monitor |  |
| _ROLL_ROT |  |
| _Roll_DEC |  |
| _Roll_RA | 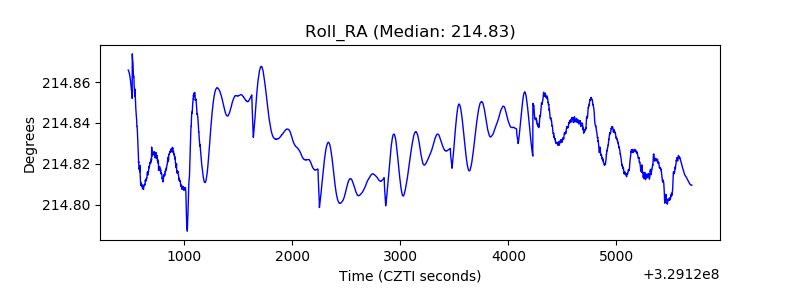 |
| Veto Counter | 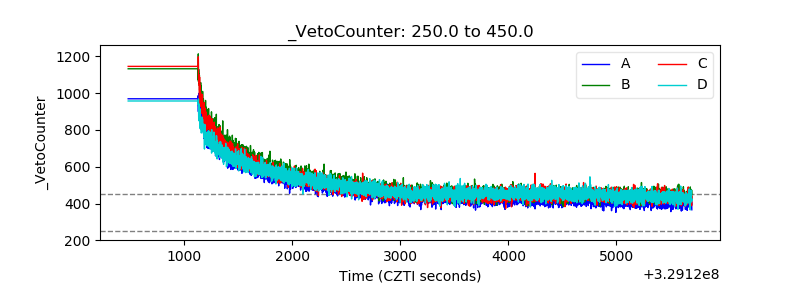 |