| Param | Original file | Final file |
|---|---|---|
| Filename | modeM0/AS1A09_061T02_9000003708cztM0_level2.fits | modeM0/AS1A09_061T02_9000003708cztM0_level2_quad_clean.evt |
| Size (bytes) | 249,906,240 | 159,802,560 |
| Size | 238.3 MB | 152.4 MB |
| Events in quadrant A | 1,618,672 | 877,977 |
| Events in quadrant B | 1,536,328 | 869,287 |
| Events in quadrant C | 1,531,716 | 811,510 |
| Events in quadrant D | 1,355,442 | 752,080 |
| Mode SS | |||
|---|---|---|---|
| Quadrant | BADHDUFLAG | Total packets | Discarded packets |
| A | 0 | 450 | 0 |
| B | 0 | 450 | 0 |
| C | 0 | 450 | 0 |
| D | 0 | 450 | 0 |
| Mode M0 | |||
|---|---|---|---|
| Quadrant | BADHDUFLAG | Total packets | Discarded packets |
| A | 0 | 59477 | 0 |
| B | 0 | 49903 | 0 |
| C | 0 | 50204 | 0 |
| D | 0 | 65365 | 0 |
| Mode M9 | |||
|---|---|---|---|
| Quadrant | BADHDUFLAG | Total packets | Discarded packets |
| A | 0 | 54 | 0 |
| B | 0 | 54 | 0 |
| C | 0 | 54 | 0 |
| D | 0 | 54 | 0 |
| Quadrant | Total seconds | Saturated seconds | Saturation percentage |
|---|---|---|---|
| A | 22185 | 455 | 2.050935% |
| B | 22185 | 439 | 1.978815% |
| C | 22185 | 632 | 2.848772% |
| D | 22185 | 822 | 3.705206% |
Noise dominated data is calculated using 1-second bins in cleaned event files. If a bin has >2000 counts, and if more than 50% of those come from <1% of pixels, then it is considered to be noise-dominated and hence unusable.
| Quadrant | # 1 sec bins | Bins with >0 counts | Bins with >2000 counts | High rate bins dominated by noise | Noise dominated (total time) | Noise dominated (detector-on time) | Marked lightcurve |
|---|---|---|---|---|---|---|---|
| A | 27149 | 22181 | 0 | 0 | 0.00% | 0.00% |  |
| B | 27149 | 22181 | 0 | 0 | 0.00% | 0.00% |  |
| C | 27149 | 22181 | 0 | 0 | 0.00% | 0.00% |  |
| D | 27149 | 22179 | 0 | 0 | 0.00% | 0.00% | 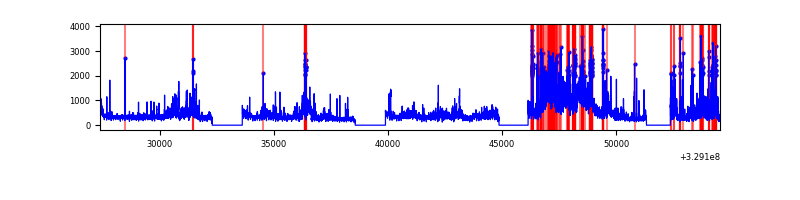 |
Top three noisy pixels from each quadrant. If the there are fewer than three noisy pixels in the level2.evt file, extra rows are filled as -1
| Pixel properties | Quadrant properties | ||||||
|---|---|---|---|---|---|---|---|
| Quadrant | DetID | PixID | Counts | Sigma | Mean | Median | Sigma |
| A | 0 | 29 | 1500 | 10.78 | 422 | 404 | 101.6 |
| A | 7 | 110 | 1230 | 8.13 | 422 | 404 | 101.6 |
| A | 9 | 19 | 1178 | 7.62 | 422 | 404 | 101.6 |
| B | 2 | 9 | 1171 | 9.49 | 408 | 396 | 81.7 |
| B | 3 | 80 | 1024 | 7.69 | 408 | 396 | 81.7 |
| B | 2 | 8 | 985 | 7.21 | 408 | 396 | 81.7 |
| C | 1 | 81 | 1194 | 7.9 | 405 | 386 | 102.2 |
| C | 1 | 80 | 1166 | 7.63 | 405 | 386 | 102.2 |
| C | 3 | 235 | 1023 | 6.23 | 405 | 386 | 102.2 |
| D | 10 | 189 | 982 | 6.15 | 387 | 357 | 101.6 |
| D | 15 | 46 | 952 | 5.85 | 387 | 357 | 101.6 |
| D | 6 | 231 | 948 | 5.82 | 387 | 357 | 101.6 |
Histogram calculated using DETX and DETY for each event in the final _common_clean file
| Quadrant A |  |
 |
Quadrant B |
|---|---|---|---|
| Quadrant D |  |
 |
Quadrant C |
| Plot type | Count rate plots | Images |
|---|---|---|
| Comparison with Poisson distribution Blue bars denote a histogram of data divided into 1 sec bins. Red curve is a Poisson curve with rate = median count rate of data. |
 |
 |
| Quadrant-wise count rates Data is divided into 100 sec bins |
 |
|
| Module-wise count rates for Quadrant A Data is divided into 100 sec bins |
 |
 |
| Module-wise count rates for Quadrant B Data is divided into 100 sec bins |
 |
 |
| Module-wise count rates for Quadrant C Data is divided into 100 sec bins |
 |
 |
| Module-wise count rates for Quadrant D Data is divided into 100 sec bins |
 |
 |
| Parameter | Plot |
|---|---|
| CZT HV Monitor |  |
| D_VDD | 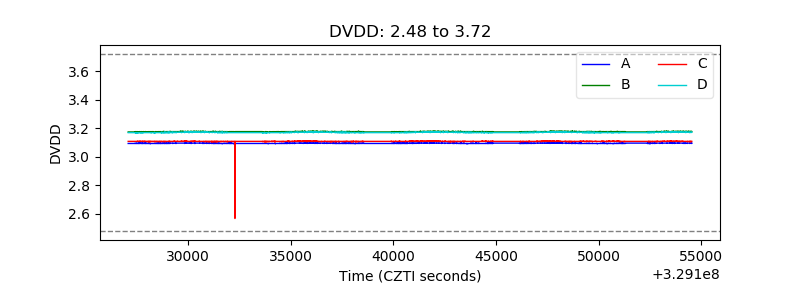 |
| Temperature 1 |  |
| Veto HV Monitor |  |
| Veto LLD |  |
| Alpha Counter |  |
| _CPM_Rate |  |
| CZT Counter |  |
| +2.5 Volts monitor |  |
| +5 Volts monitor |  |
| _ROLL_ROT |  |
| _Roll_DEC |  |
| _Roll_RA |  |
| Veto Counter |  |