| Param | Original file | Final file |
|---|---|---|
| Filename | modeM0/AS1A09_061T02_9000003708_25358cztM0_level2.evt | modeM0/AS1A09_061T02_9000003708_25358cztM0_level2_quad_clean.evt |
| Size (bytes) | 118,031,040 | 36,014,400 |
| Size | 112.6 MB | 34.3 MB |
| Events in quadrant A | 866,967 | 256,252 |
| Events in quadrant B | 825,532 | 261,828 |
| Events in quadrant C | 900,358 | 239,094 |
| Events in quadrant D | 892,228 | 237,039 |
| Mode M0 | |||
|---|---|---|---|
| Quadrant | BADHDUFLAG | Total packets | Discarded packets |
| A | 0 | 3585 | 0 |
| B | 0 | 3442 | 0 |
| C | 0 | 3657 | 0 |
| D | 0 | 3727 | 0 |
| Mode M9 | |||
|---|---|---|---|
| Quadrant | BADHDUFLAG | Total packets | Discarded packets |
| A | 0 | 4 | 0 |
| B | 0 | 4 | 0 |
| C | 0 | 4 | 0 |
| D | 0 | 4 | 0 |
| Quadrant | Total seconds | Saturated seconds | Saturation percentage |
|---|---|---|---|
| A | 1284 | 16 | 1.246106% |
| B | 1284 | 17 | 1.323988% |
| C | 1283 | 69 | 5.378020% |
| D | 1283 | 31 | 2.416212% |
Noise dominated data is calculated using 1-second bins in cleaned event files. If a bin has >2000 counts, and if more than 50% of those come from <1% of pixels, then it is considered to be noise-dominated and hence unusable.
| Quadrant | # 1 sec bins | Bins with >0 counts | Bins with >2000 counts | High rate bins dominated by noise | Noise dominated (total time) | Noise dominated (detector-on time) | Marked lightcurve |
|---|---|---|---|---|---|---|---|
| A | 1284 | 1284 | 0 | 0 | 0.00% | 0.00% | 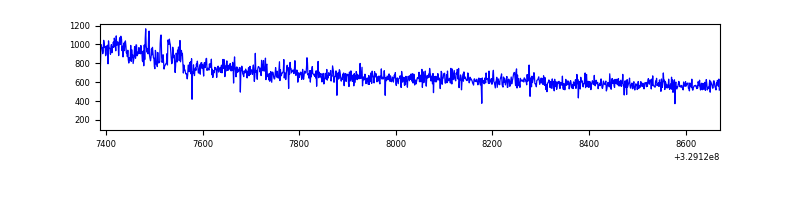 |
| B | 1284 | 1284 | 0 | 0 | 0.00% | 0.00% | 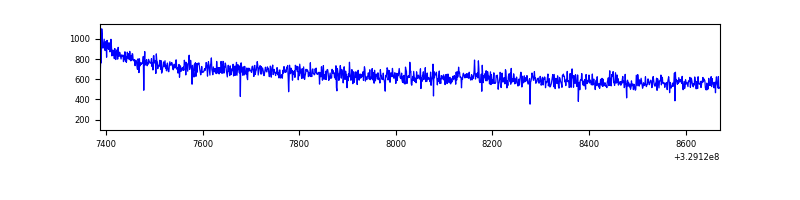 |
| C | 1283 | 1283 | 1 | 1 | 0.08% | 0.08% | 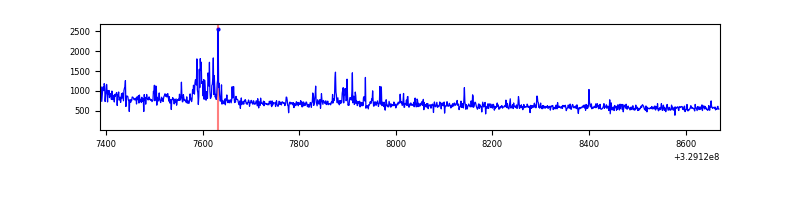 |
| D | 1283 | 1283 | 3 | 3 | 0.23% | 0.23% | 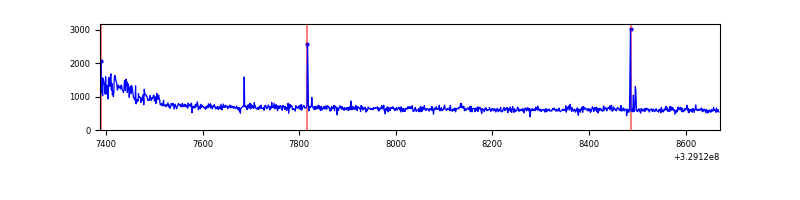 |
Top three noisy pixels from each quadrant. If the there are fewer than three noisy pixels in the level2.evt file, extra rows are filled as -1
| Pixel properties | Quadrant properties | ||||||
|---|---|---|---|---|---|---|---|
| Quadrant | DetID | PixID | Counts | Sigma | Mean | Median | Sigma |
| A | 6 | 16 | 41716 | 964.51 | 213 | 210 | 43.0 |
| A | 0 | 226 | 1866 | 38.48 | 213 | 210 | 43.0 |
| A | 13 | 254 | 1699 | 34.6 | 213 | 210 | 43.0 |
| B | 12 | 111 | 4090 | 96.68 | 211 | 206 | 40.2 |
| B | 3 | 112 | 3773 | 88.79 | 211 | 206 | 40.2 |
| B | 11 | 111 | 3750 | 88.22 | 211 | 206 | 40.2 |
| C | 3 | 233 | 71482 | 1494.01 | 204 | 205 | 47.7 |
| C | 14 | 238 | 34008 | 708.53 | 204 | 205 | 47.7 |
| C | 13 | 61 | 1378 | 24.59 | 204 | 205 | 47.7 |
| D | 1 | 52 | 47542 | 934.34 | 207 | 202 | 50.7 |
| D | 9 | 35 | 43240 | 849.43 | 207 | 202 | 50.7 |
| D | 8 | 195 | 11030 | 213.71 | 207 | 202 | 50.7 |
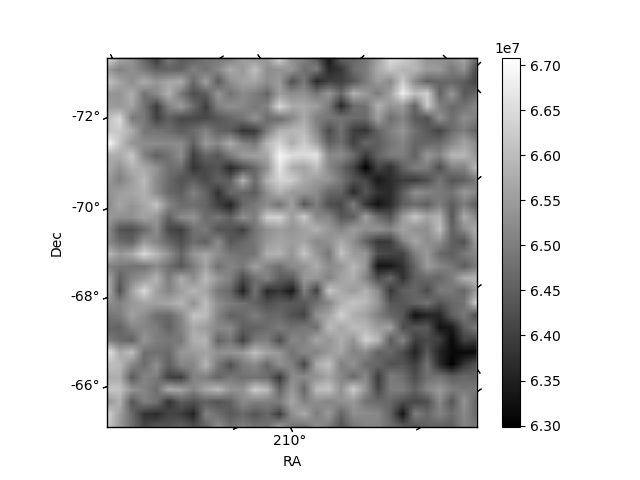
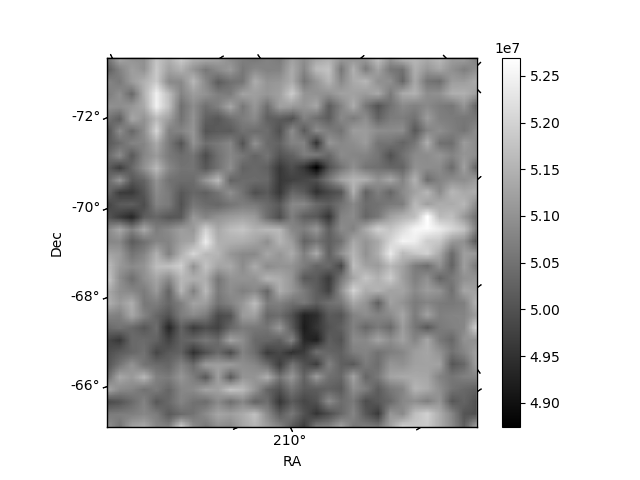
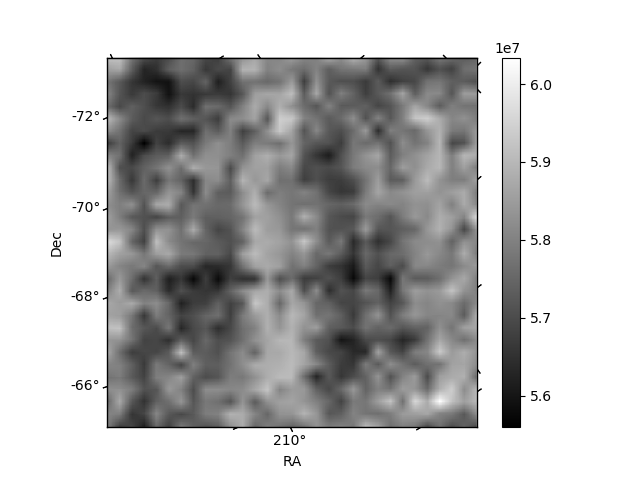
Histogram calculated using DETX and DETY for each event in the final _common_clean file
| Quadrant A |  |
 |
Quadrant B |
|---|---|---|---|
| Quadrant D |  |
 |
Quadrant C |
| Plot type | Count rate plots | Images |
|---|---|---|
| Comparison with Poisson distribution Blue bars denote a histogram of data divided into 1 sec bins. Red curve is a Poisson curve with rate = median count rate of data. |
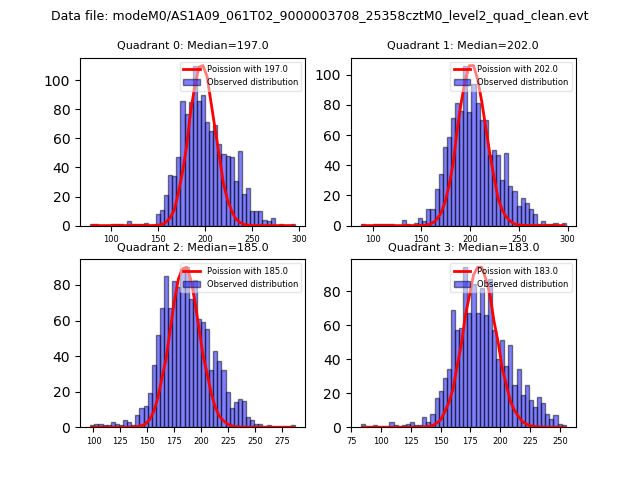 |
 |
| Quadrant-wise count rates Data is divided into 100 sec bins |
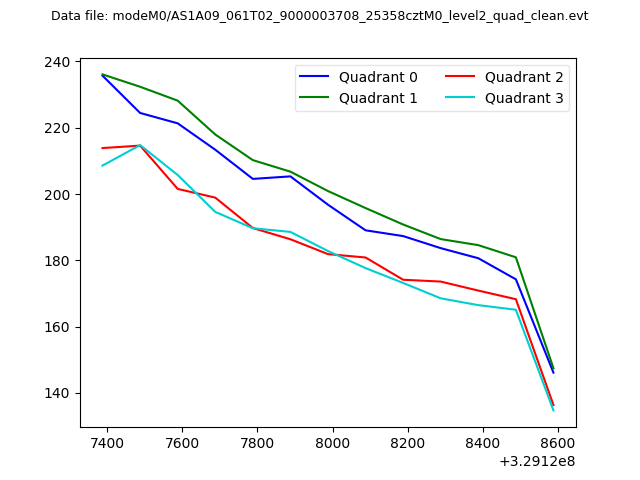 |
|
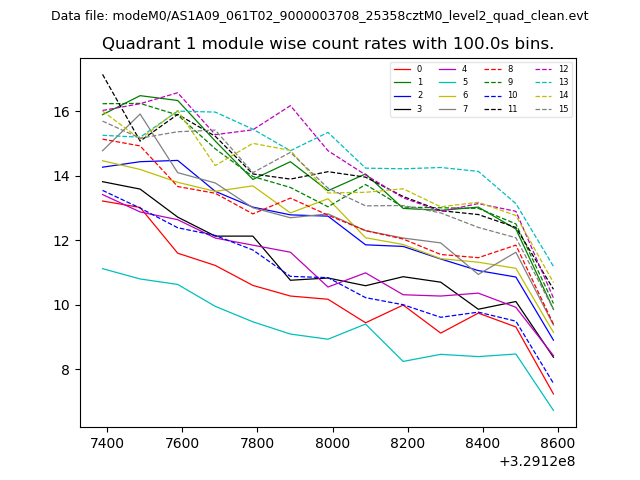
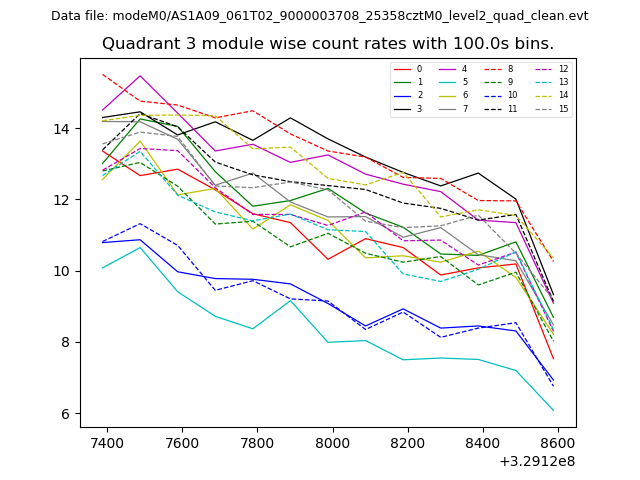
| Module-wise count rates for Quadrant A Data is divided into 100 sec bins |
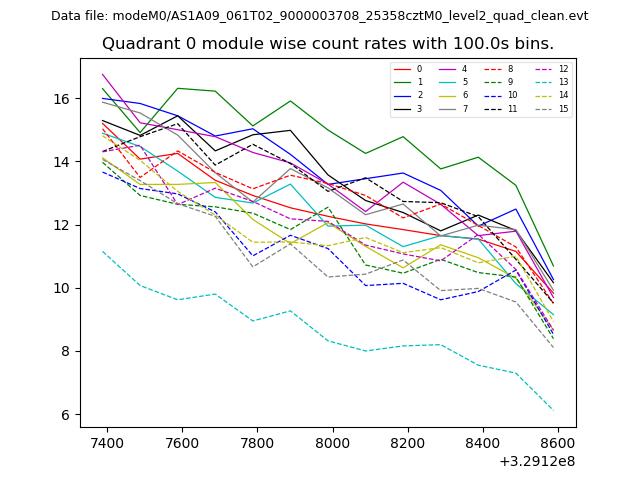 |
 |
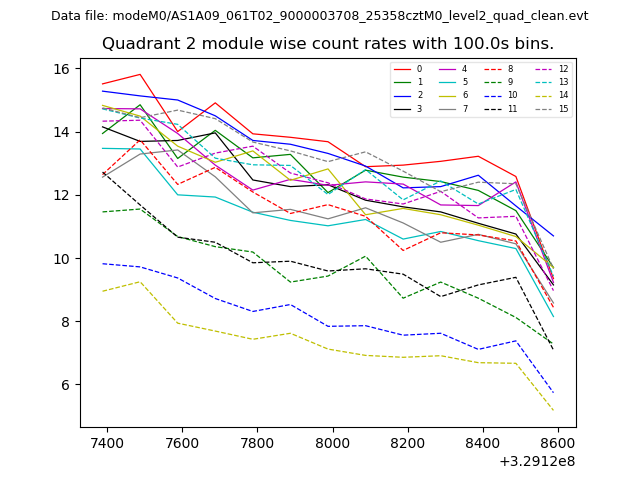
| Module-wise count rates for Quadrant B Data is divided into 100 sec bins |
 |
 |
| Module-wise count rates for Quadrant C Data is divided into 100 sec bins |
 |
 |
| Module-wise count rates for Quadrant D Data is divided into 100 sec bins |
 |
 |
| Parameter | Plot |
|---|---|
| CZT HV Monitor | 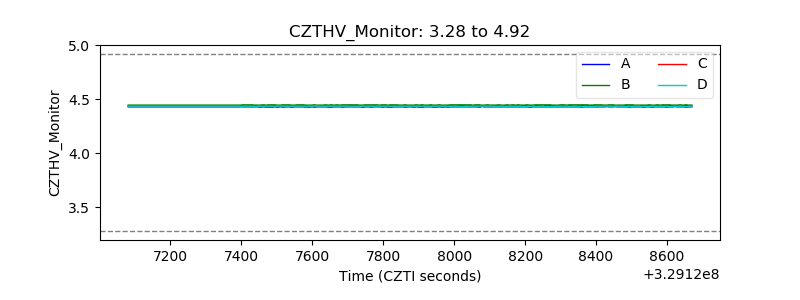 |
| D_VDD | 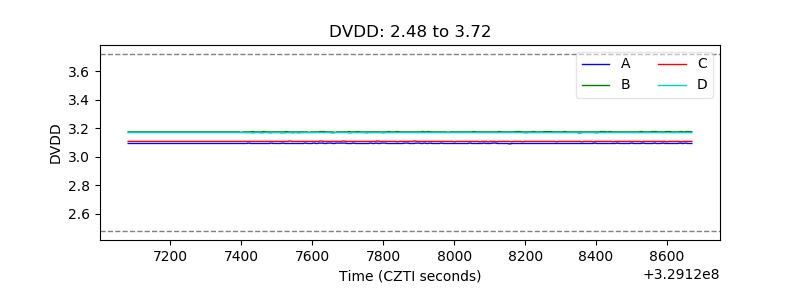 |
| Temperature 1 | 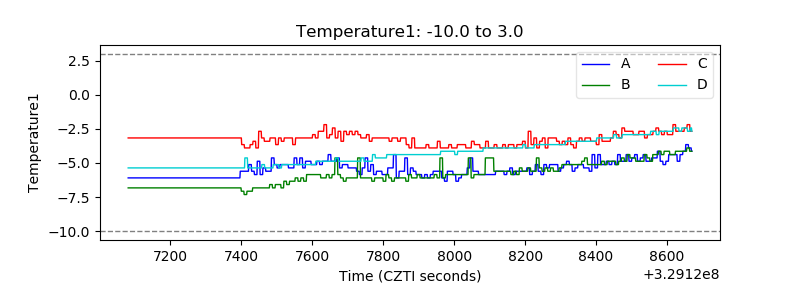 |
| Veto HV Monitor |  |
| Veto LLD | 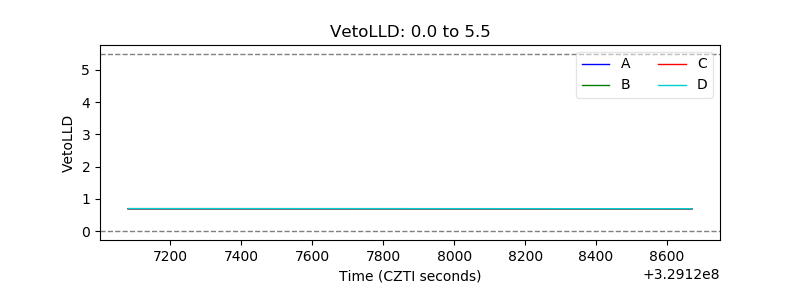 |
| Alpha Counter | 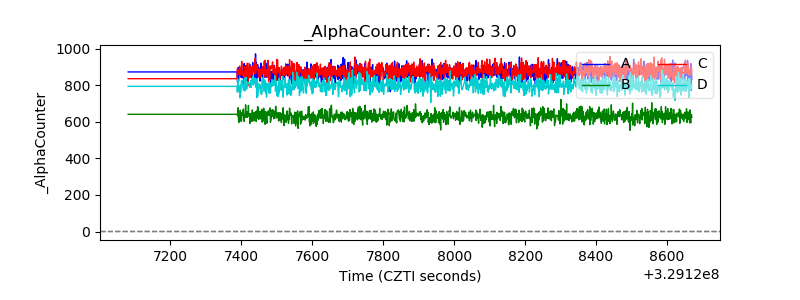 |
| _CPM_Rate | 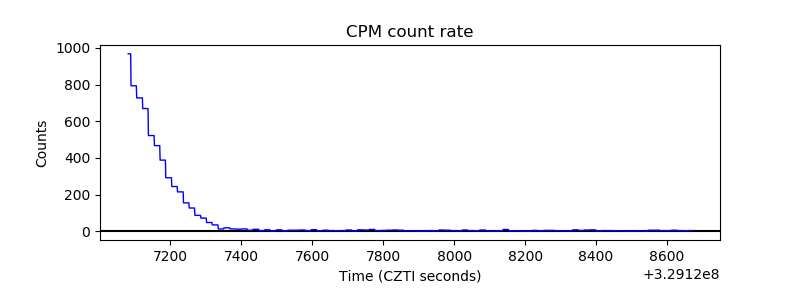 |
| CZT Counter |  |
| +2.5 Volts monitor |  |
| +5 Volts monitor | 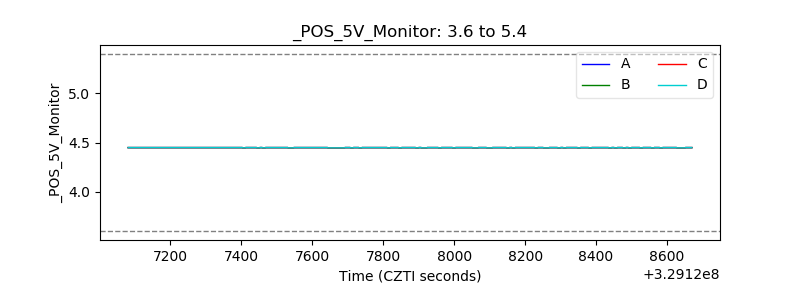 |
| _ROLL_ROT |  |
| _Roll_DEC |  |
| _Roll_RA |  |
| Veto Counter | 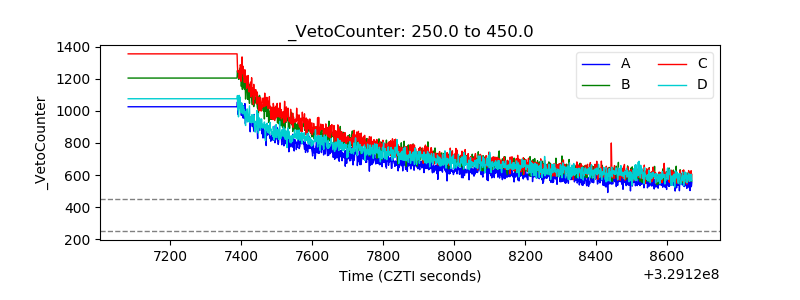 |