| Param | Original file | Final file |
|---|---|---|
| Filename | modeM0/AS1A09_061T02_9000003708_25359cztM0_level2.evt | modeM0/AS1A09_061T02_9000003708_25359cztM0_level2_quad_clean.evt |
| Size (bytes) | 495,397,440 | 144,648,000 |
| Size | 472.4 MB | 137.9 MB |
| Events in quadrant A | 3,859,336 | 1,013,688 |
| Events in quadrant B | 3,386,812 | 1,027,115 |
| Events in quadrant C | 3,379,736 | 969,067 |
| Events in quadrant D | 3,971,695 | 953,669 |
| Mode M0 | |||
|---|---|---|---|
| Quadrant | BADHDUFLAG | Total packets | Discarded packets |
| A | 0 | 15997 | 0 |
| B | 0 | 13921 | 0 |
| C | 0 | 14019 | 0 |
| D | 0 | 16117 | 0 |
| Mode M9 | |||
|---|---|---|---|
| Quadrant | BADHDUFLAG | Total packets | Discarded packets |
| A | 0 | 13 | 0 |
| B | 0 | 13 | 0 |
| C | 0 | 13 | 0 |
| D | 0 | 13 | 0 |
| Quadrant | Total seconds | Saturated seconds | Saturation percentage |
|---|---|---|---|
| A | 5981 | 107 | 1.788998% |
| B | 5981 | 115 | 1.922755% |
| C | 5981 | 181 | 3.026250% |
| D | 5981 | 109 | 1.822438% |
Noise dominated data is calculated using 1-second bins in cleaned event files. If a bin has >2000 counts, and if more than 50% of those come from <1% of pixels, then it is considered to be noise-dominated and hence unusable.
| Quadrant | # 1 sec bins | Bins with >0 counts | Bins with >2000 counts | High rate bins dominated by noise | Noise dominated (total time) | Noise dominated (detector-on time) | Marked lightcurve |
|---|---|---|---|---|---|---|---|
| A | 7296 | 5981 | 0 | 0 | 0.00% | 0.00% | 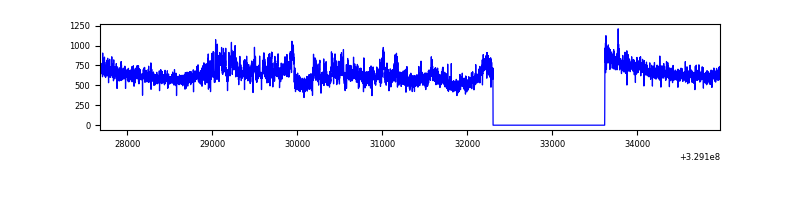 |
| B | 7296 | 5981 | 1 | 1 | 0.01% | 0.02% | 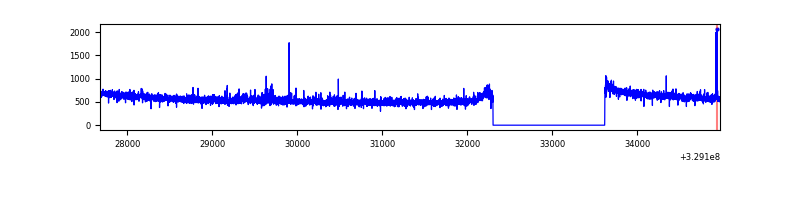 |
| C | 7296 | 5981 | 0 | 0 | 0.00% | 0.00% | 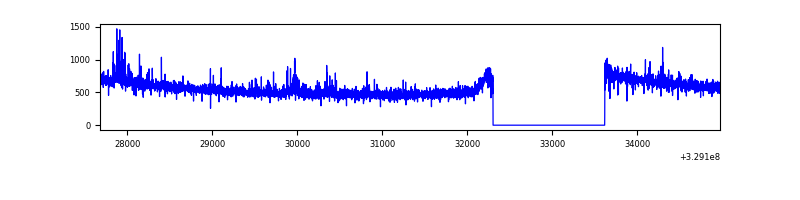 |
| D | 7296 | 5981 | 17 | 17 | 0.23% | 0.28% | 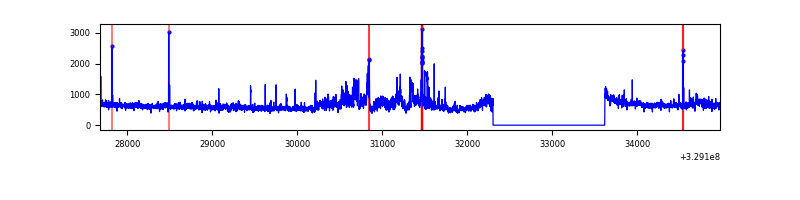 |
Top three noisy pixels from each quadrant. If the there are fewer than three noisy pixels in the level2.evt file, extra rows are filled as -1
| Pixel properties | Quadrant properties | ||||||
|---|---|---|---|---|---|---|---|
| Quadrant | DetID | PixID | Counts | Sigma | Mean | Median | Sigma |
| A | 6 | 16 | 541522 | 3226.1 | 858 | 845 | 167.6 |
| A | 15 | 173 | 10615 | 58.3 | 858 | 845 | 167.6 |
| A | 13 | 254 | 8432 | 45.27 | 858 | 845 | 167.6 |
| B | 3 | 112 | 53000 | 340.23 | 842 | 828 | 153.3 |
| B | 0 | 229 | 28682 | 181.65 | 842 | 828 | 153.3 |
| B | 12 | 111 | 17468 | 108.52 | 842 | 828 | 153.3 |
| C | 14 | 238 | 135440 | 733.4 | 810 | 818 | 183.6 |
| C | 3 | 233 | 86053 | 464.35 | 810 | 818 | 183.6 |
| C | 13 | 61 | 5554 | 25.8 | 810 | 818 | 183.6 |
| D | 1 | 52 | 385390 | 1962.14 | 830 | 807 | 196.0 |
| D | 8 | 195 | 278034 | 1414.41 | 830 | 807 | 196.0 |
| D | 9 | 35 | 131106 | 664.79 | 830 | 807 | 196.0 |
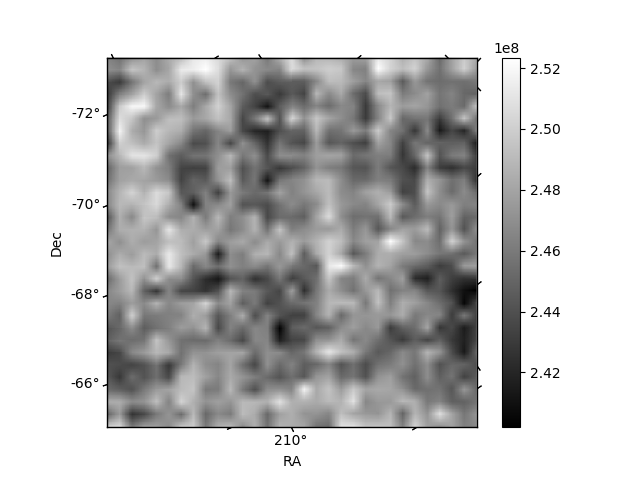
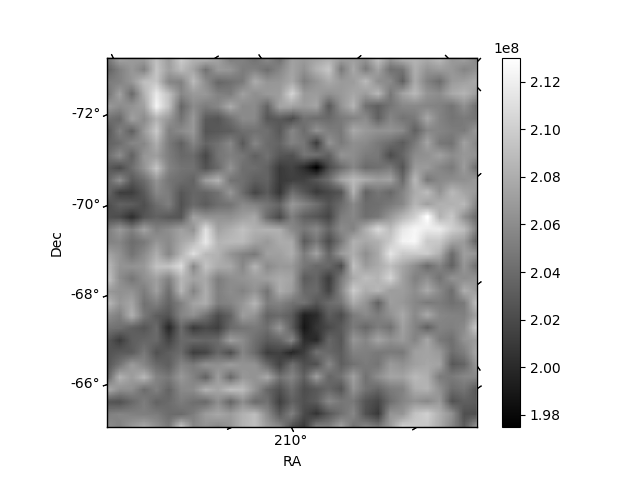
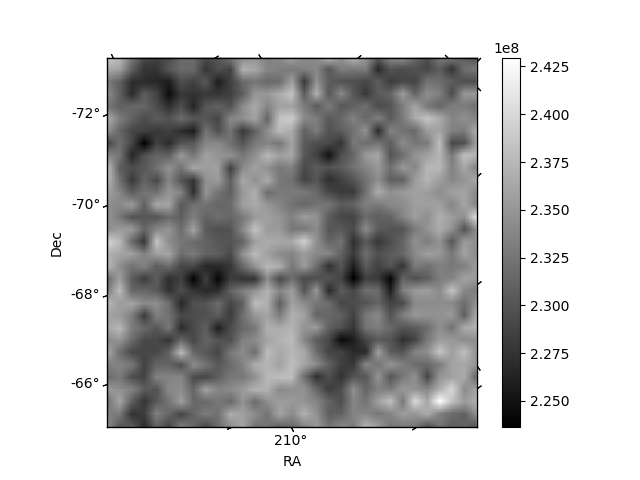
Histogram calculated using DETX and DETY for each event in the final _common_clean file
| Quadrant A | 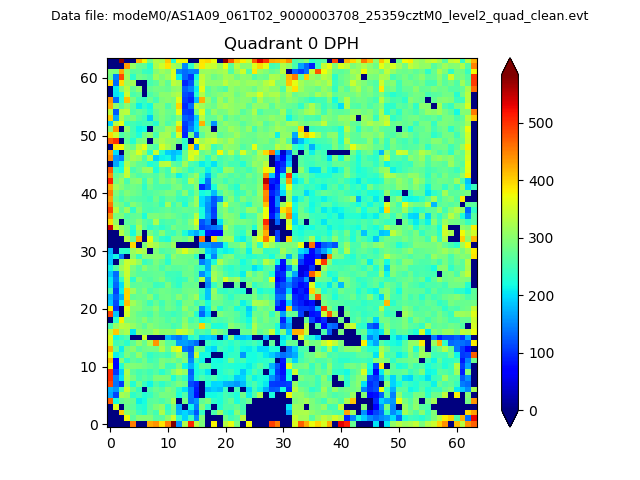 |
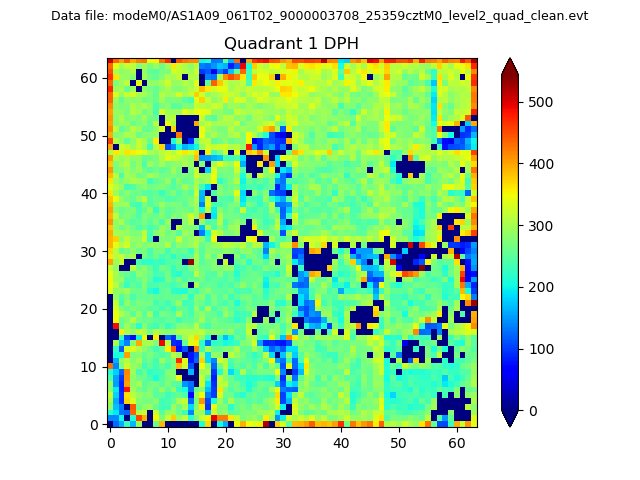 |
Quadrant B |
|---|---|---|---|
| Quadrant D | 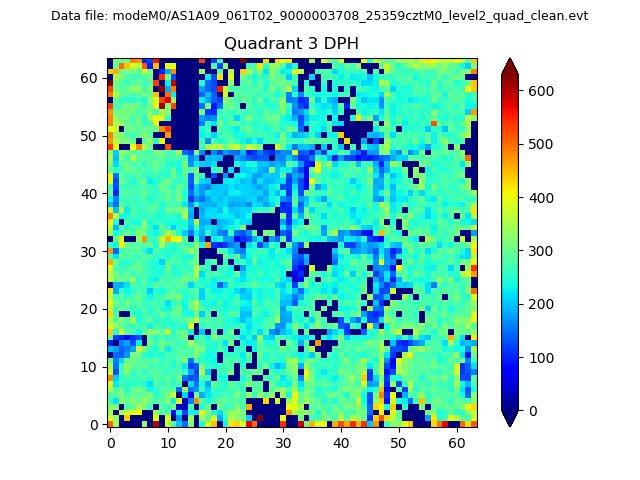 |
 |
Quadrant C |
| Plot type | Count rate plots | Images |
|---|---|---|
| Comparison with Poisson distribution Blue bars denote a histogram of data divided into 1 sec bins. Red curve is a Poisson curve with rate = median count rate of data. |
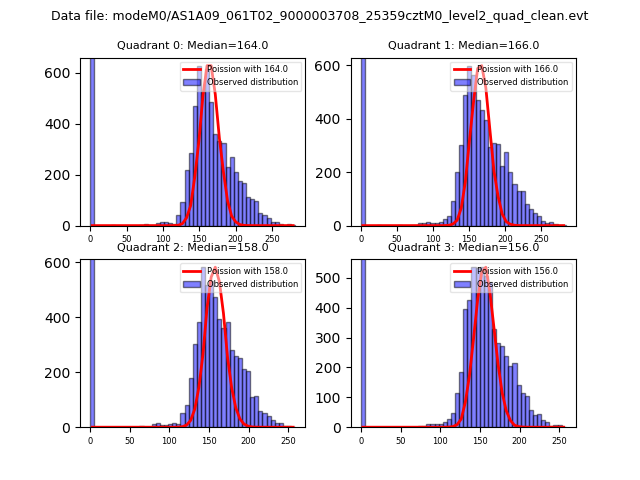 |
 |
| Quadrant-wise count rates Data is divided into 100 sec bins |
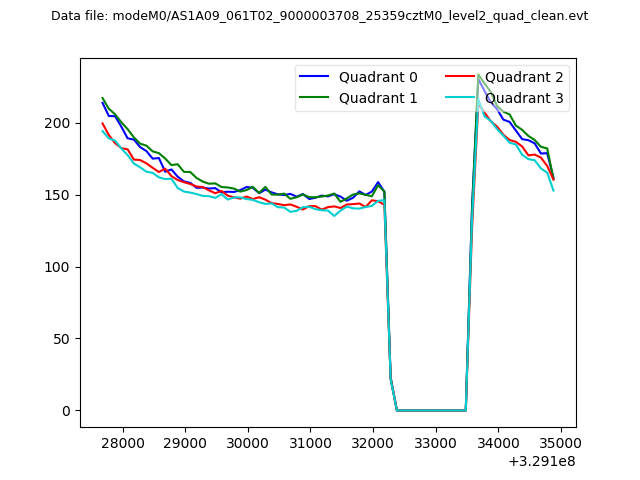 |
|
| Module-wise count rates for Quadrant A Data is divided into 100 sec bins |
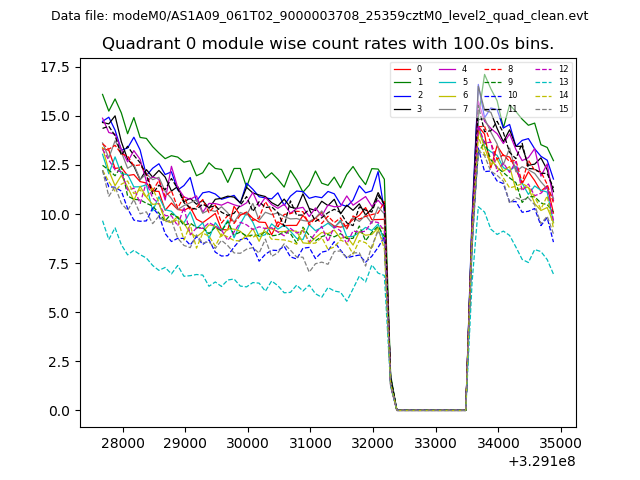 |
 |
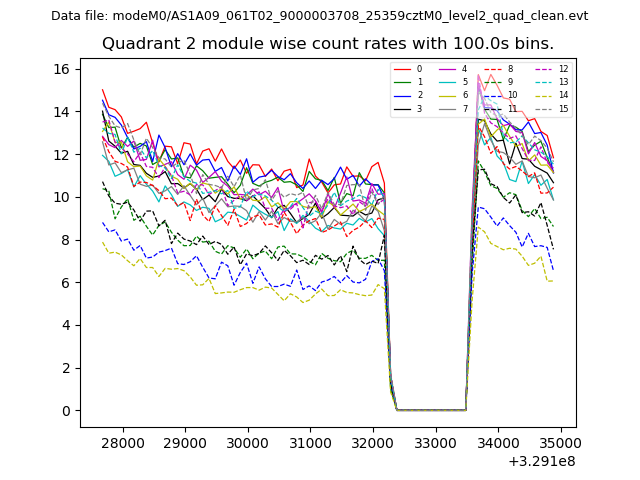
| Module-wise count rates for Quadrant B Data is divided into 100 sec bins |
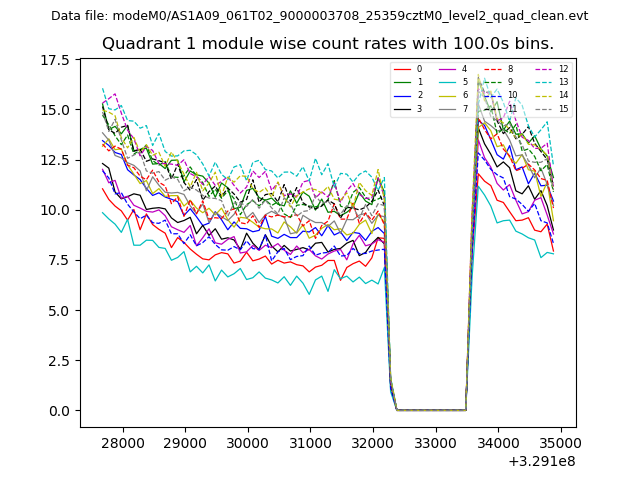 |
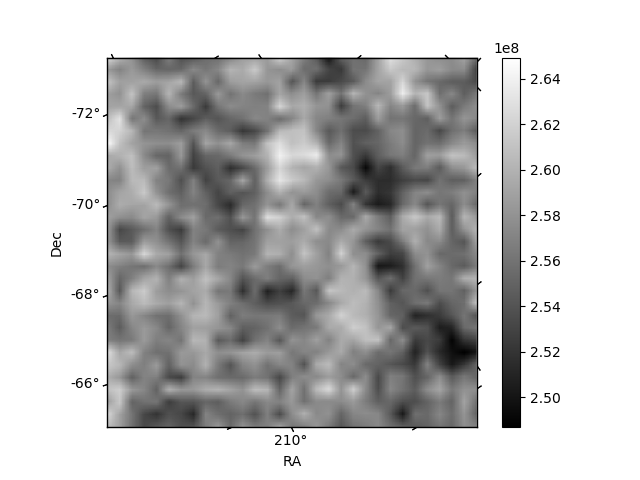 |
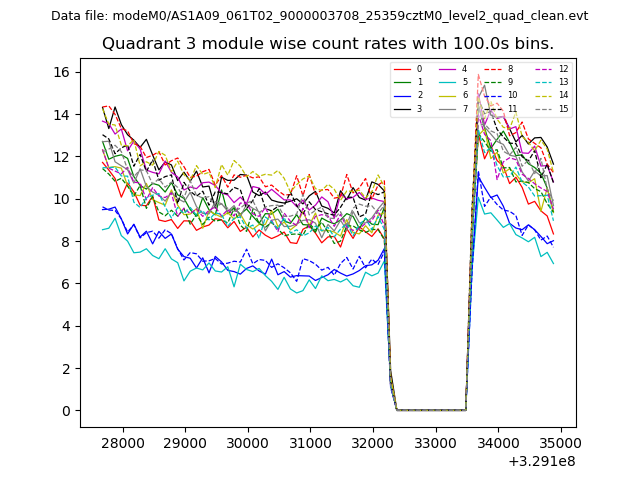
| Module-wise count rates for Quadrant C Data is divided into 100 sec bins |
 |
 |
| Module-wise count rates for Quadrant D Data is divided into 100 sec bins |
 |
 |
| Parameter | Plot |
|---|---|
| CZT HV Monitor | 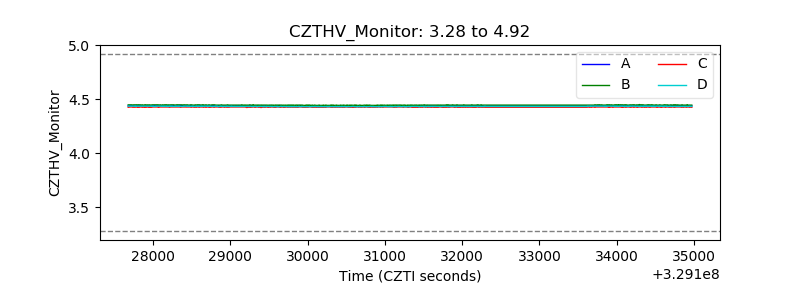 |
| D_VDD | 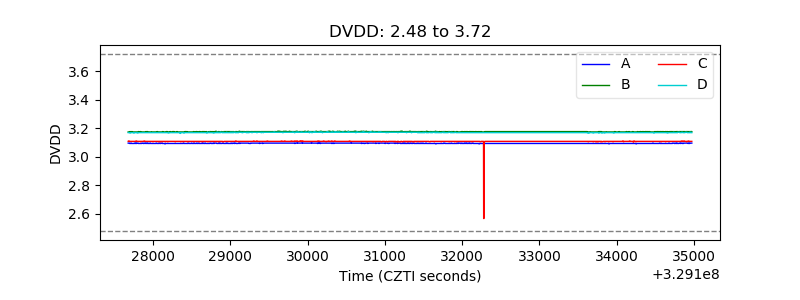 |
| Temperature 1 | 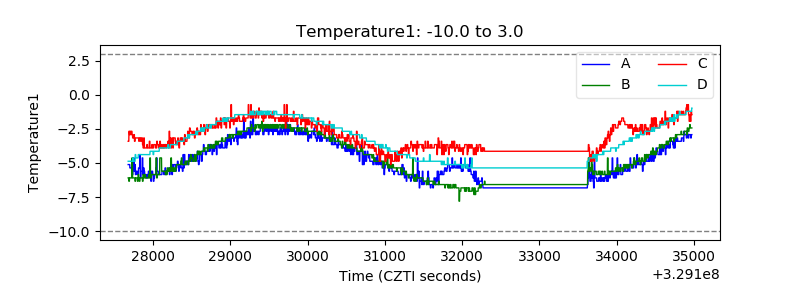 |
| Veto HV Monitor | 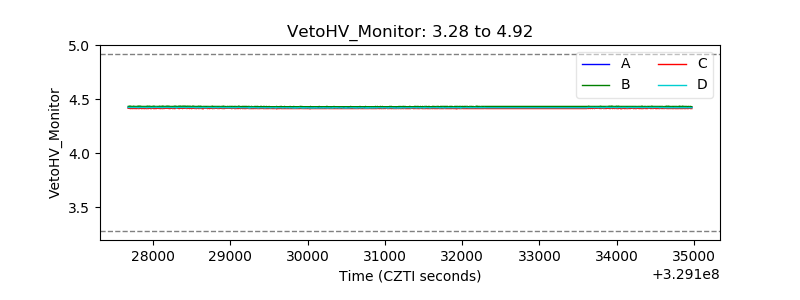 |
| Veto LLD | 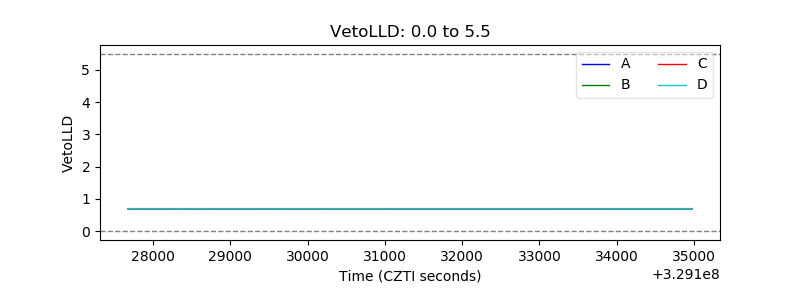 |
| Alpha Counter | 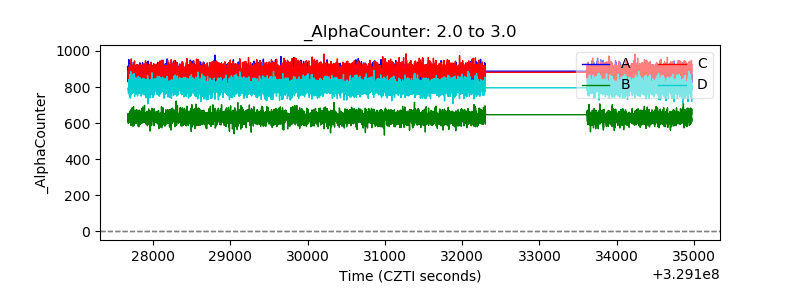 |
| _CPM_Rate | 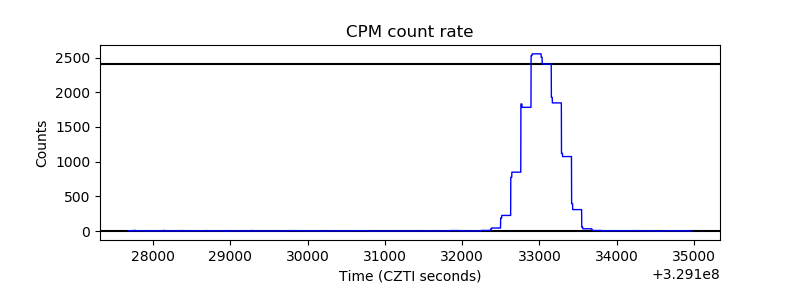 |
| CZT Counter |  |
| +2.5 Volts monitor |  |
| +5 Volts monitor |  |
| _ROLL_ROT |  |
| _Roll_DEC | 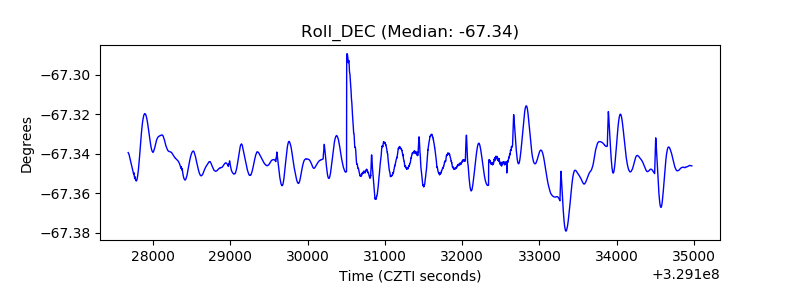 |
| _Roll_RA |  |
| Veto Counter | 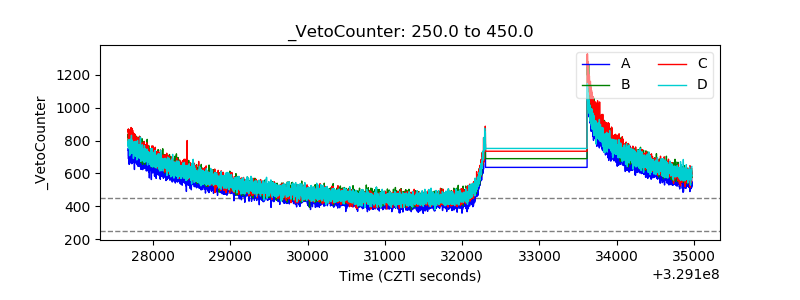 |