| Param | Original file | Final file |
|---|---|---|
| Filename | modeM0/AS1A09_061T02_9000003708_25360cztM0_level2.evt | modeM0/AS1A09_061T02_9000003708_25360cztM0_level2_quad_clean.evt |
| Size (bytes) | 457,047,360 | 133,165,440 |
| Size | 435.9 MB | 127.0 MB |
| Events in quadrant A | 3,538,372 | 933,634 |
| Events in quadrant B | 3,282,950 | 940,864 |
| Events in quadrant C | 3,032,862 | 888,056 |
| Events in quadrant D | 3,606,887 | 878,652 |
| Mode M0 | |||
|---|---|---|---|
| Quadrant | BADHDUFLAG | Total packets | Discarded packets |
| A | 0 | 14900 | 0 |
| B | 0 | 13380 | 0 |
| C | 0 | 12660 | 0 |
| D | 0 | 14657 | 0 |
| Mode M9 | |||
|---|---|---|---|
| Quadrant | BADHDUFLAG | Total packets | Discarded packets |
| A | 0 | 14 | 0 |
| B | 0 | 14 | 0 |
| C | 0 | 14 | 0 |
| D | 0 | 14 | 0 |
| Quadrant | Total seconds | Saturated seconds | Saturation percentage |
|---|---|---|---|
| A | 5613 | 142 | 2.529841% |
| B | 5613 | 152 | 2.707999% |
| C | 5613 | 174 | 3.099947% |
| D | 5614 | 144 | 2.565016% |
Noise dominated data is calculated using 1-second bins in cleaned event files. If a bin has >2000 counts, and if more than 50% of those come from <1% of pixels, then it is considered to be noise-dominated and hence unusable.
| Quadrant | # 1 sec bins | Bins with >0 counts | Bins with >2000 counts | High rate bins dominated by noise | Noise dominated (total time) | Noise dominated (detector-on time) | Marked lightcurve |
|---|---|---|---|---|---|---|---|
| A | 6938 | 5613 | 0 | 0 | 0.00% | 0.00% | 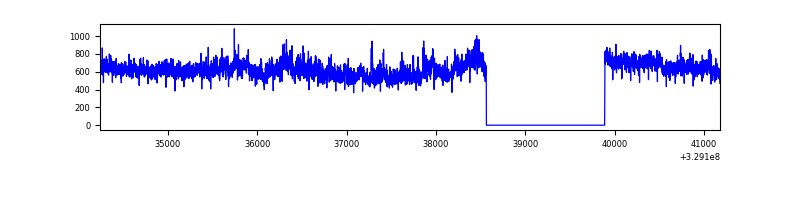 |
| B | 6938 | 5613 | 1 | 1 | 0.01% | 0.02% | 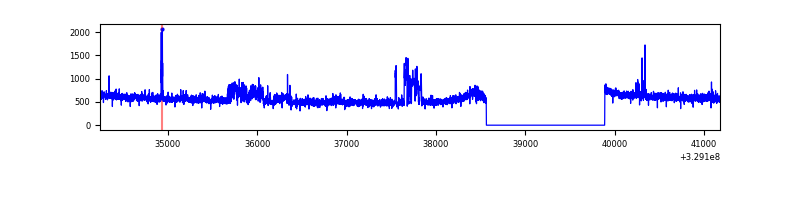 |
| C | 6938 | 5613 | 0 | 0 | 0.00% | 0.00% | 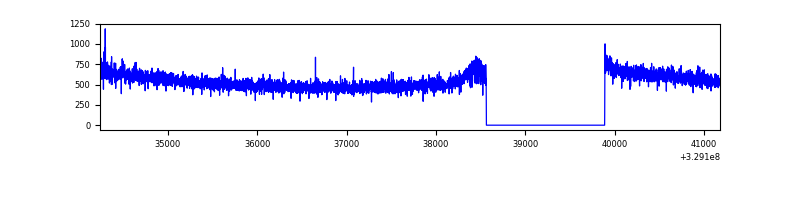 |
| D | 6939 | 5614 | 24 | 24 | 0.35% | 0.43% | 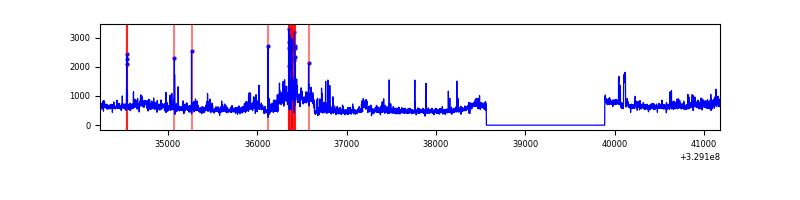 |
Top three noisy pixels from each quadrant. If the there are fewer than three noisy pixels in the level2.evt file, extra rows are filled as -1
| Pixel properties | Quadrant properties | ||||||
|---|---|---|---|---|---|---|---|
| Quadrant | DetID | PixID | Counts | Sigma | Mean | Median | Sigma |
| A | 6 | 16 | 475242 | 3079.62 | 789 | 778 | 154.1 |
| A | 15 | 173 | 17932 | 111.34 | 789 | 778 | 154.1 |
| A | 13 | 254 | 8521 | 50.26 | 789 | 778 | 154.1 |
| B | 3 | 112 | 109699 | 776.69 | 772 | 757 | 140.3 |
| B | 12 | 1 | 81332 | 574.45 | 772 | 757 | 140.3 |
| B | 0 | 229 | 47378 | 332.38 | 772 | 757 | 140.3 |
| C | 14 | 238 | 123573 | 734.05 | 741 | 749 | 167.3 |
| C | 3 | 233 | 16673 | 95.17 | 741 | 749 | 167.3 |
| C | 13 | 61 | 5116 | 26.1 | 741 | 749 | 167.3 |
| D | 1 | 52 | 365451 | 1991.78 | 764 | 742 | 183.1 |
| D | 8 | 195 | 268581 | 1462.74 | 764 | 742 | 183.1 |
| D | 12 | 233 | 37616 | 201.38 | 764 | 742 | 183.1 |
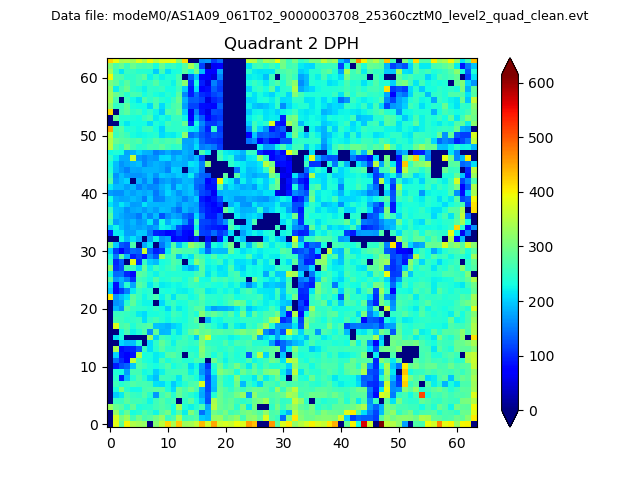
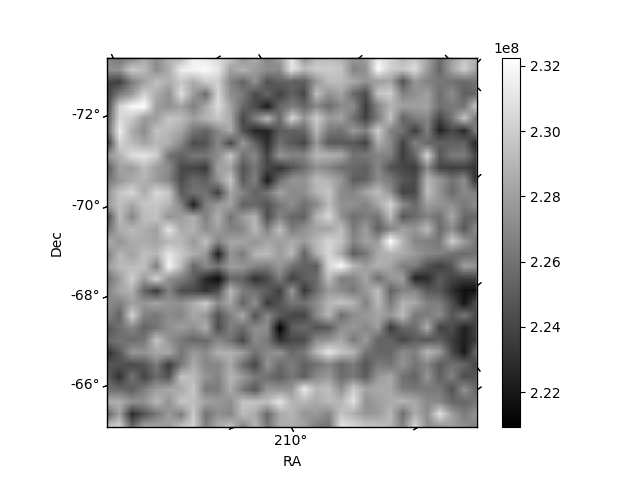
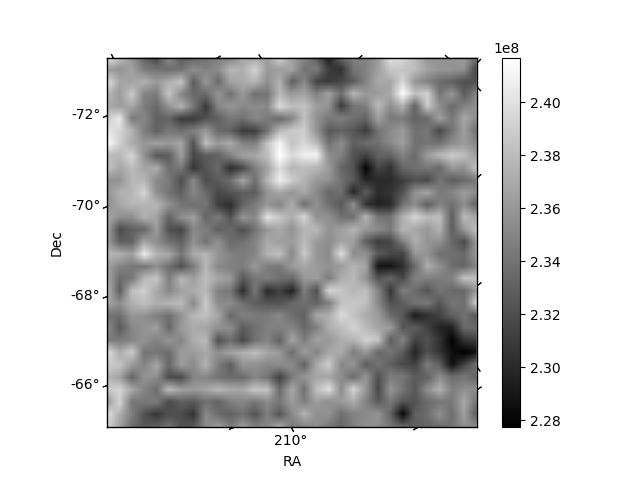
Histogram calculated using DETX and DETY for each event in the final _common_clean file
| Quadrant A | 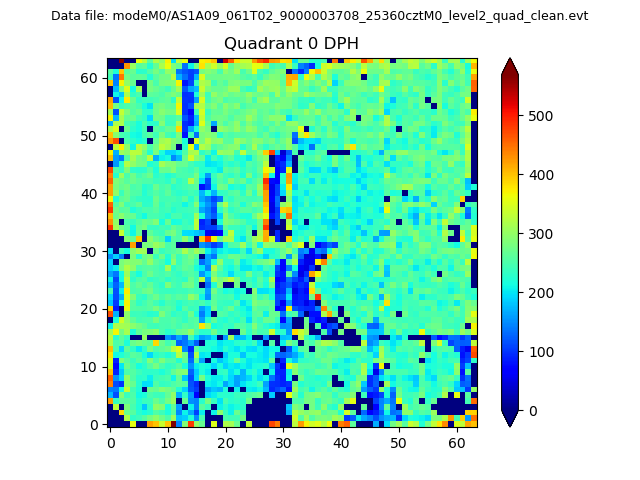 |
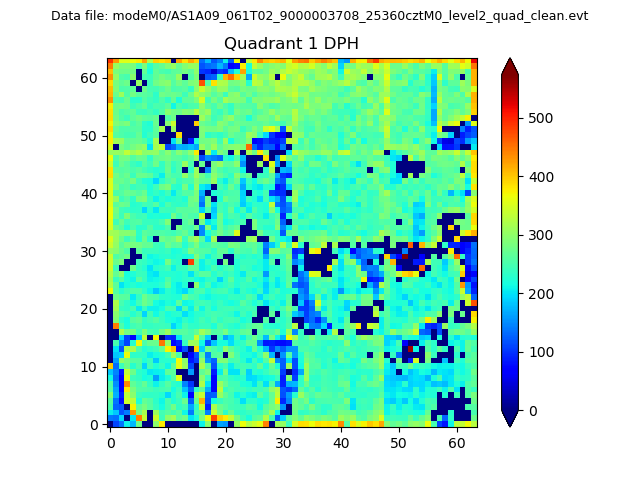 |
Quadrant B |
|---|---|---|---|
| Quadrant D | 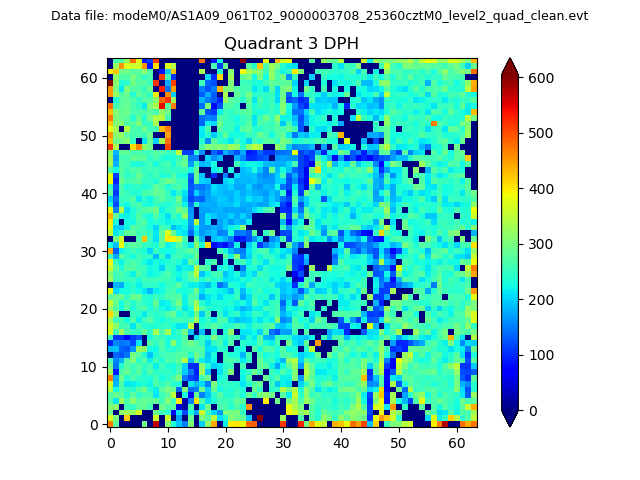 |
 |
Quadrant C |
| Plot type | Count rate plots | Images |
|---|---|---|
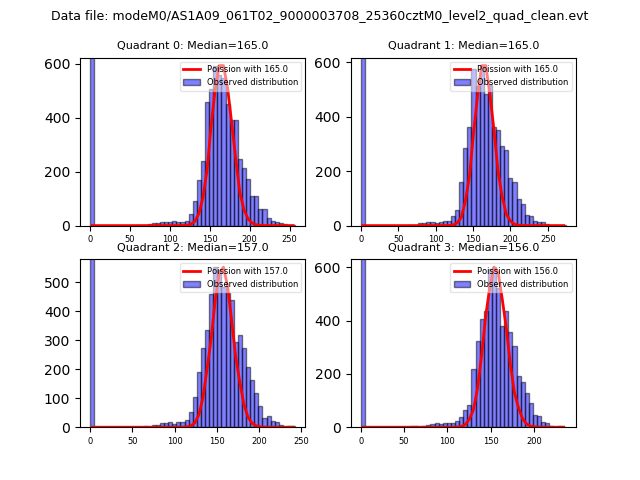
| Comparison with Poisson distribution Blue bars denote a histogram of data divided into 1 sec bins. Red curve is a Poisson curve with rate = median count rate of data. |
 |
 |
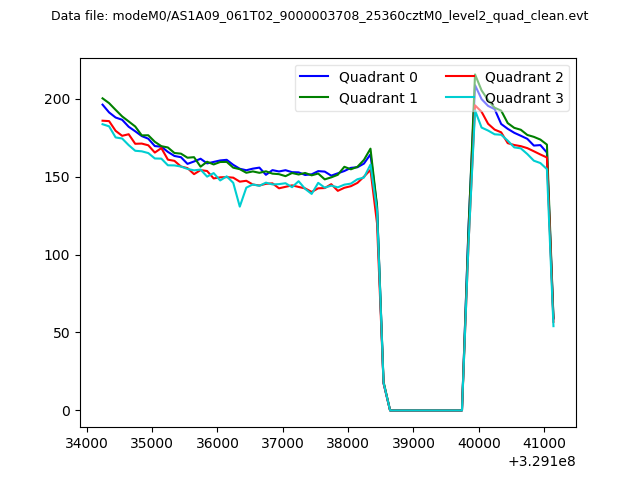
| Quadrant-wise count rates Data is divided into 100 sec bins |
 |
|
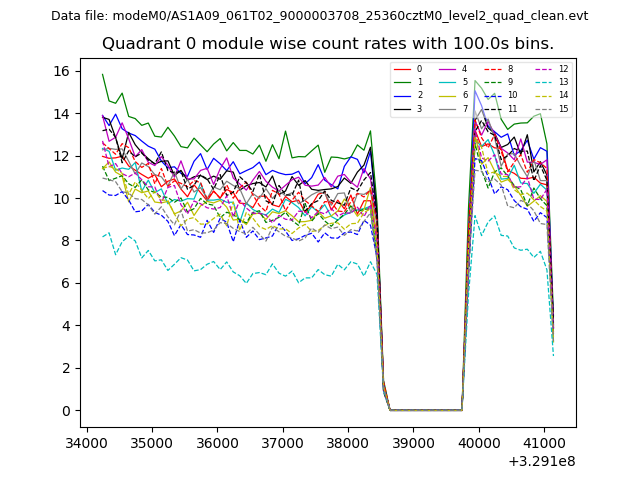
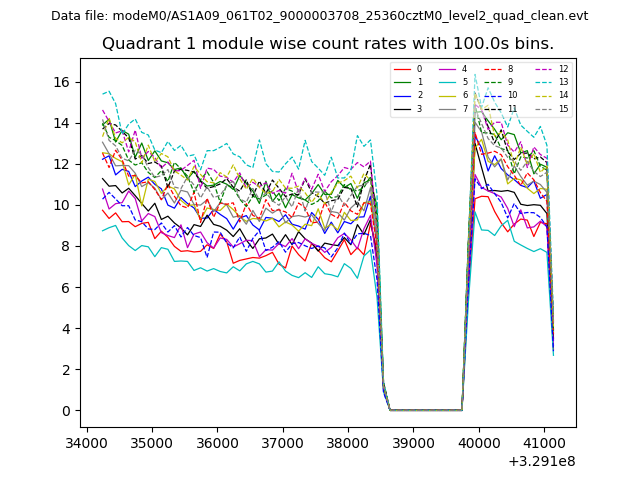
| Module-wise count rates for Quadrant A Data is divided into 100 sec bins |
 |
 |
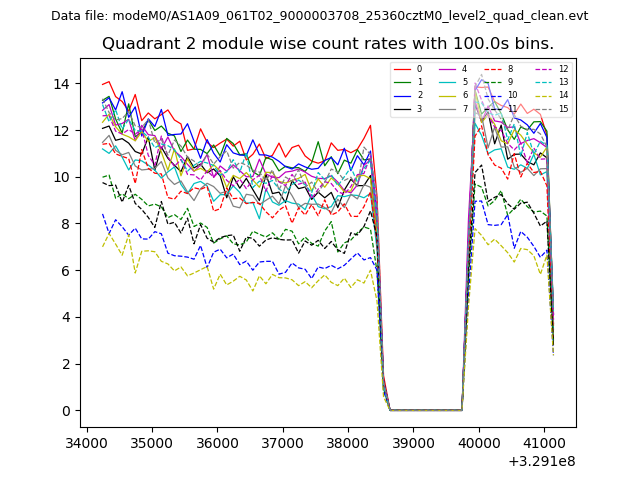
| Module-wise count rates for Quadrant B Data is divided into 100 sec bins |
 |
 |
| Module-wise count rates for Quadrant C Data is divided into 100 sec bins |
 |
 |
| Module-wise count rates for Quadrant D Data is divided into 100 sec bins |
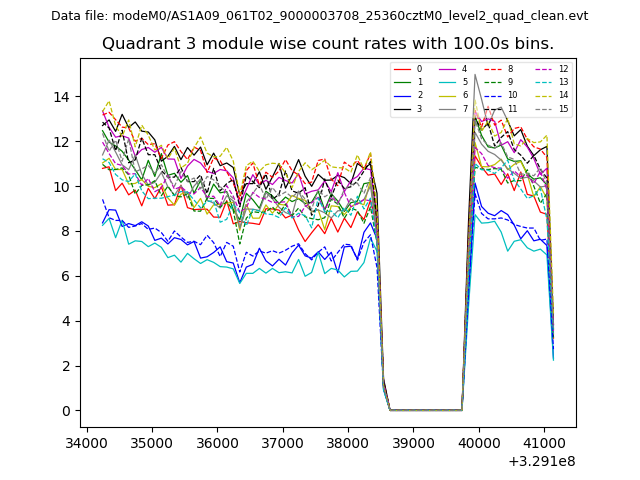 |
 |
| Parameter | Plot |
|---|---|
| CZT HV Monitor | 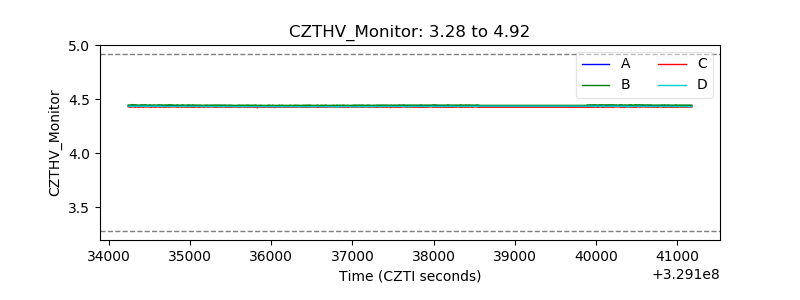 |
| D_VDD | 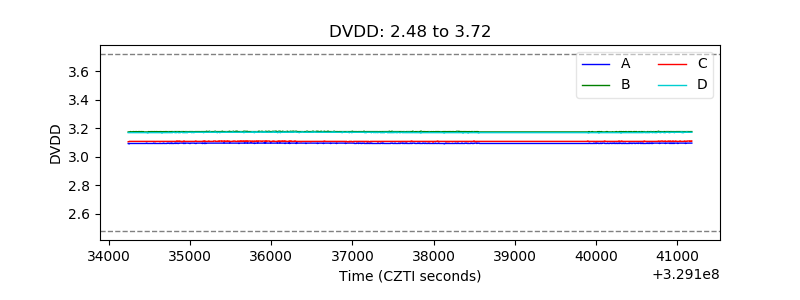 |
| Temperature 1 | 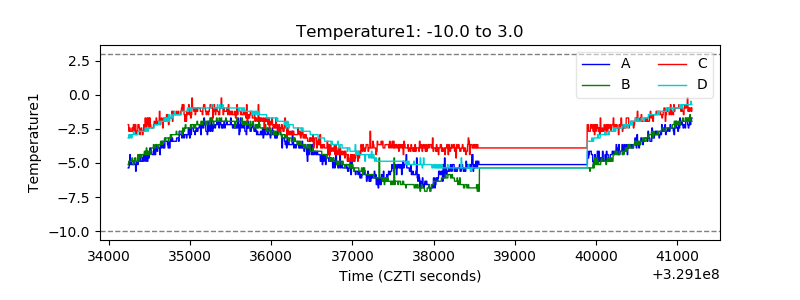 |
| Veto HV Monitor |  |
| Veto LLD | 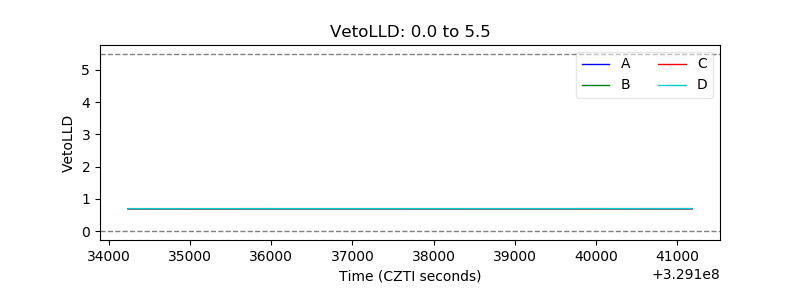 |
| Alpha Counter | 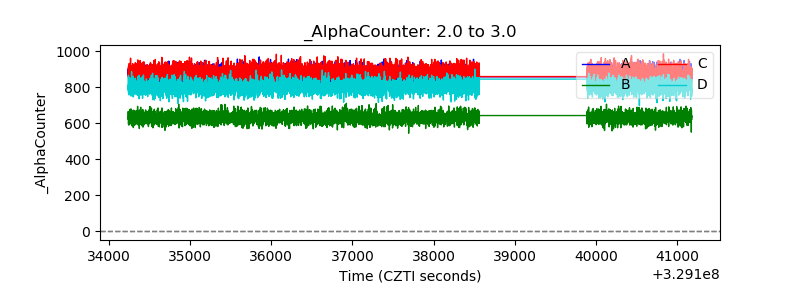 |
| _CPM_Rate | 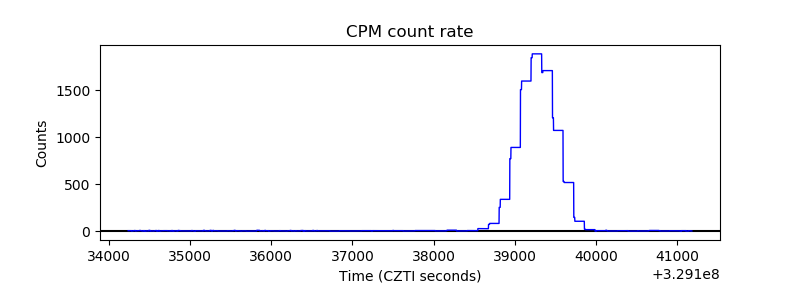 |
| CZT Counter | 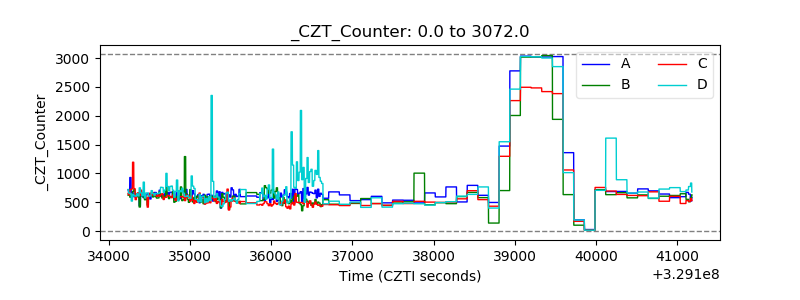 |
| +2.5 Volts monitor | 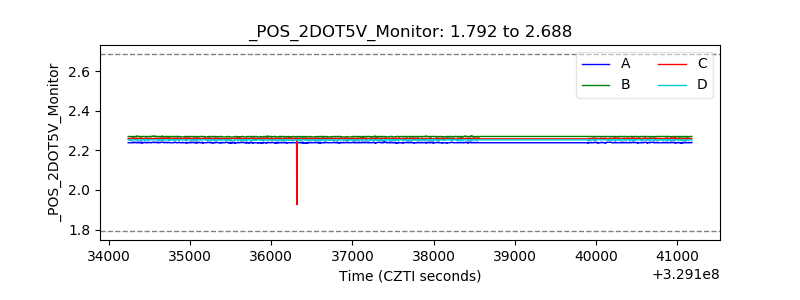 |
| +5 Volts monitor |  |
| _ROLL_ROT | 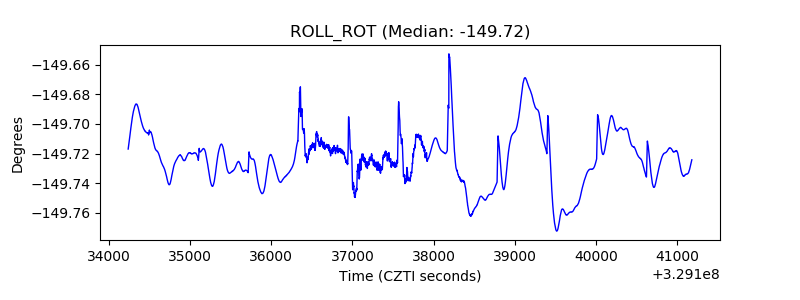 |
| _Roll_DEC | 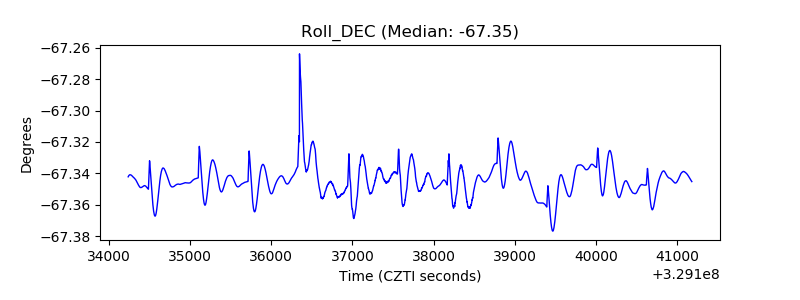 |
| _Roll_RA | 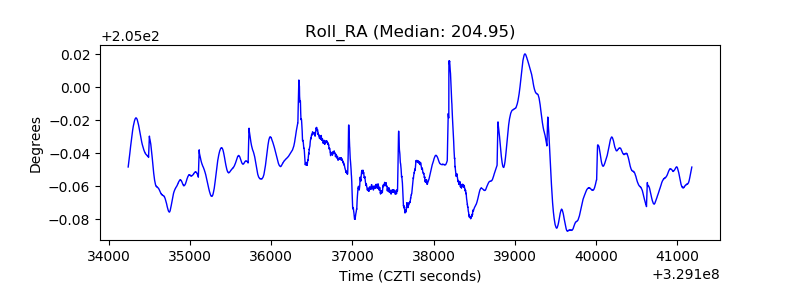 |
| Veto Counter | 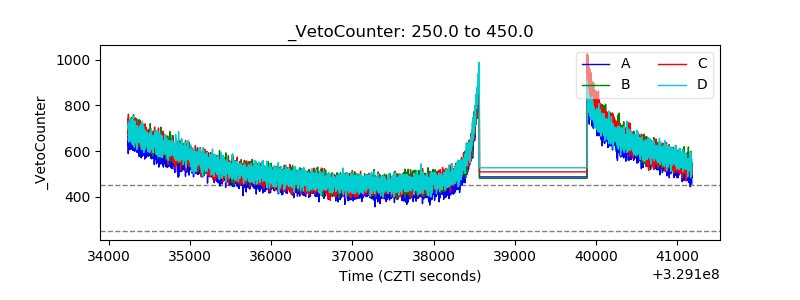 |