| Param | Original file | Final file |
|---|---|---|
| Filename | modeM0/AS1A09_061T02_9000003708_25361cztM0_level2.evt | modeM0/AS1A09_061T02_9000003708_25361cztM0_level2_quad_clean.evt |
| Size (bytes) | 539,968,320 | 139,037,760 |
| Size | 515.0 MB | 132.6 MB |
| Events in quadrant A | 4,270,735 | 972,861 |
| Events in quadrant B | 3,440,929 | 980,052 |
| Events in quadrant C | 3,292,333 | 922,929 |
| Events in quadrant D | 4,929,801 | 903,294 |
| Mode M0 | |||
|---|---|---|---|
| Quadrant | BADHDUFLAG | Total packets | Discarded packets |
| A | 0 | 17370 | 0 |
| B | 0 | 14009 | 0 |
| C | 0 | 13771 | 0 |
| D | 0 | 18910 | 0 |
| Mode M9 | |||
|---|---|---|---|
| Quadrant | BADHDUFLAG | Total packets | Discarded packets |
| A | 0 | 13 | 0 |
| B | 0 | 13 | 0 |
| C | 0 | 13 | 0 |
| D | 0 | 13 | 0 |
| Quadrant | Total seconds | Saturated seconds | Saturation percentage |
|---|---|---|---|
| A | 6187 | 131 | 2.117343% |
| B | 6188 | 117 | 1.890756% |
| C | 6188 | 158 | 2.553329% |
| D | 6188 | 303 | 4.896574% |
Noise dominated data is calculated using 1-second bins in cleaned event files. If a bin has >2000 counts, and if more than 50% of those come from <1% of pixels, then it is considered to be noise-dominated and hence unusable.
| Quadrant | # 1 sec bins | Bins with >0 counts | Bins with >2000 counts | High rate bins dominated by noise | Noise dominated (total time) | Noise dominated (detector-on time) | Marked lightcurve |
|---|---|---|---|---|---|---|---|
| A | 7462 | 6187 | 1 | 1 | 0.01% | 0.02% | 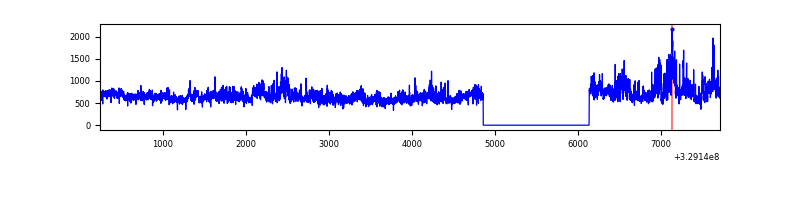 |
| B | 7463 | 6188 | 3 | 3 | 0.04% | 0.05% | 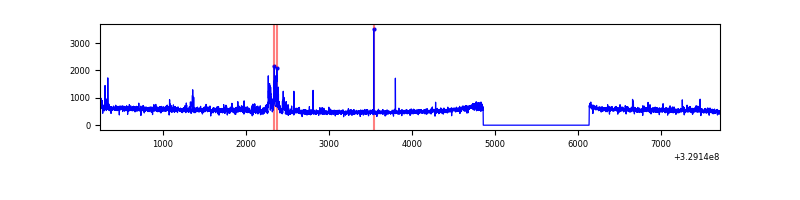 |
| C | 7463 | 6188 | 2 | 2 | 0.03% | 0.03% |  |
| D | 7463 | 6188 | 198 | 198 | 2.65% | 3.20% | 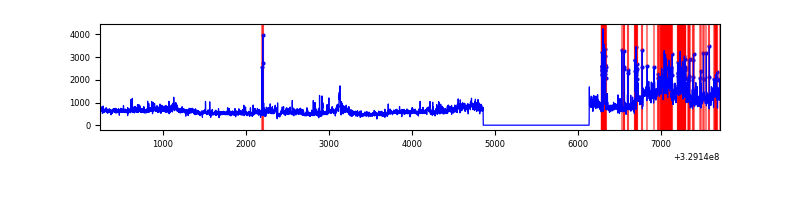 |
Top three noisy pixels from each quadrant. If the there are fewer than three noisy pixels in the level2.evt file, extra rows are filled as -1
| Pixel properties | Quadrant properties | ||||||
|---|---|---|---|---|---|---|---|
| Quadrant | DetID | PixID | Counts | Sigma | Mean | Median | Sigma |
| A | 6 | 16 | 1032833 | 6305.2 | 832 | 819 | 163.7 |
| A | 3 | 1 | 17098 | 99.46 | 832 | 819 | 163.7 |
| A | 15 | 173 | 12023 | 68.45 | 832 | 819 | 163.7 |
| B | 7 | 219 | 87710 | 577.33 | 818 | 802 | 150.5 |
| B | 0 | 229 | 50522 | 330.29 | 818 | 802 | 150.5 |
| B | 3 | 112 | 40530 | 263.91 | 818 | 802 | 150.5 |
| C | 14 | 238 | 129971 | 733.65 | 778 | 786 | 176.1 |
| C | 7 | 87 | 111997 | 631.57 | 778 | 786 | 176.1 |
| C | 3 | 233 | 10742 | 56.54 | 778 | 786 | 176.1 |
| D | 1 | 52 | 1111001 | 5846.54 | 793 | 772 | 189.9 |
| D | 8 | 195 | 715153 | 3761.98 | 793 | 772 | 189.9 |
| D | 7 | 238 | 53667 | 278.55 | 793 | 772 | 189.9 |
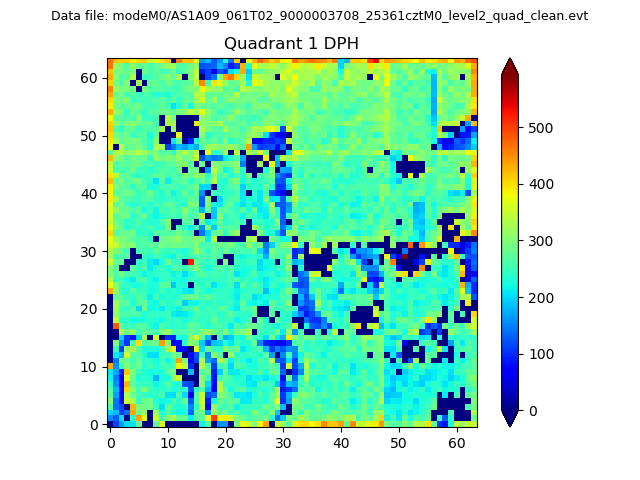
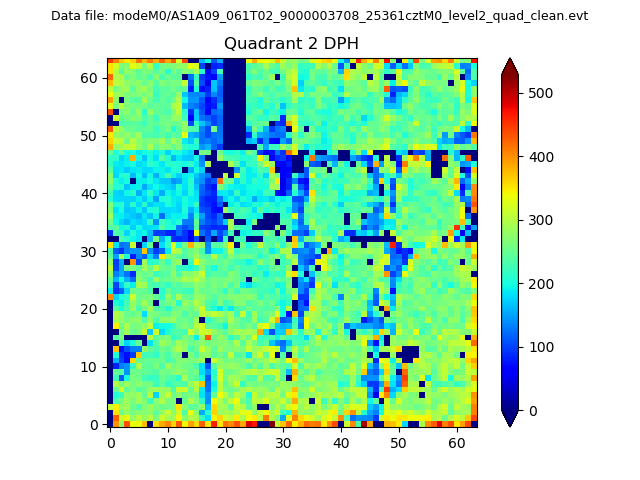
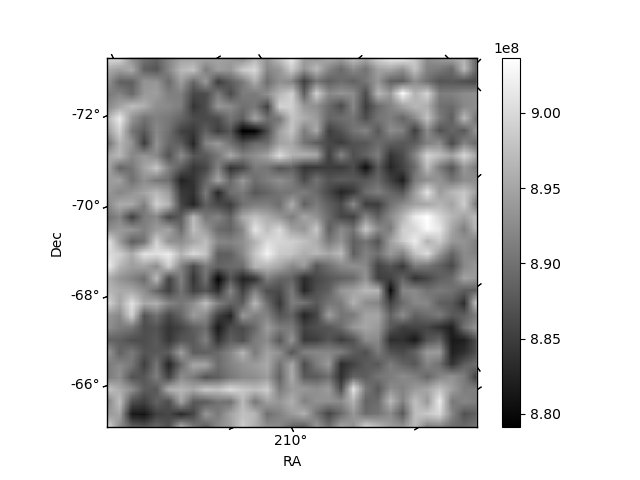
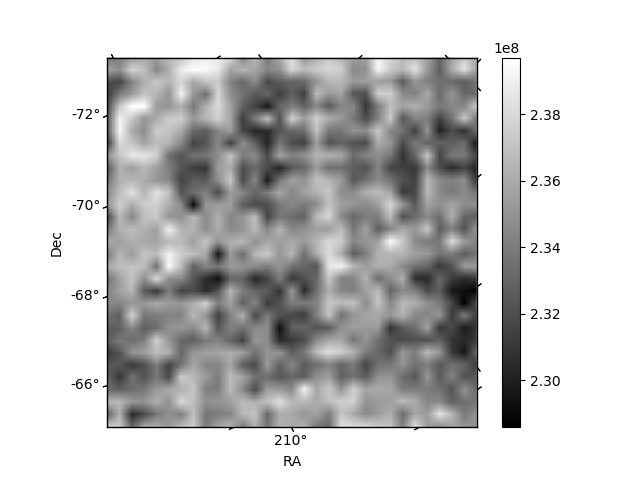
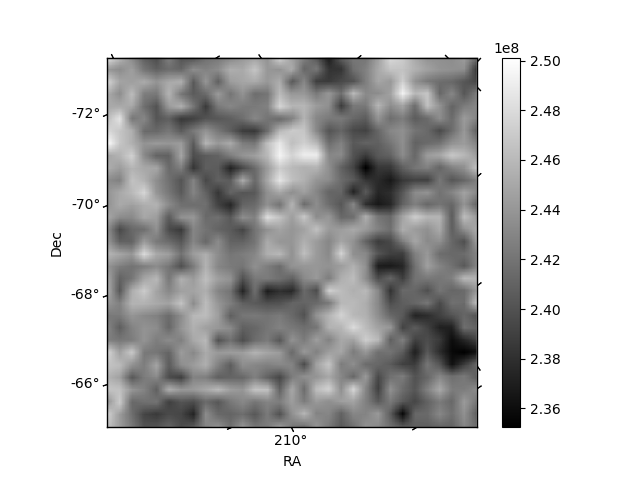
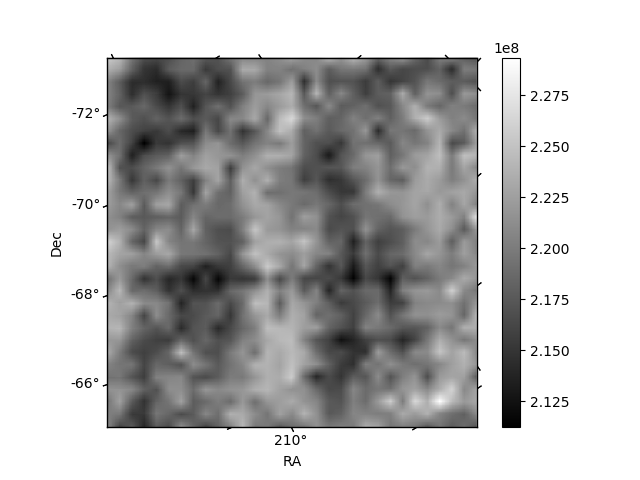
Histogram calculated using DETX and DETY for each event in the final _common_clean file
| Quadrant A | 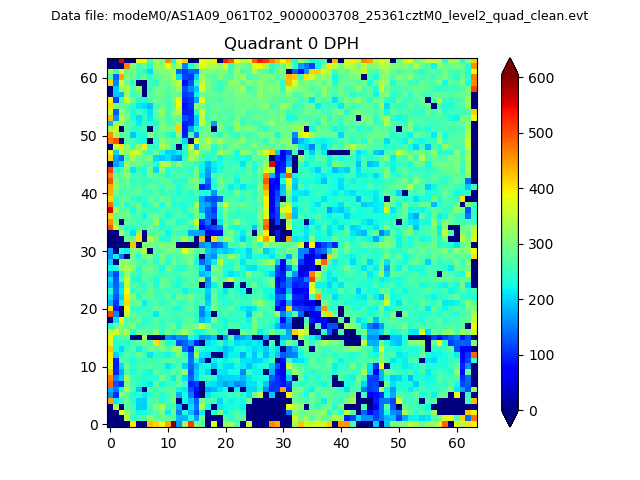 |
 |
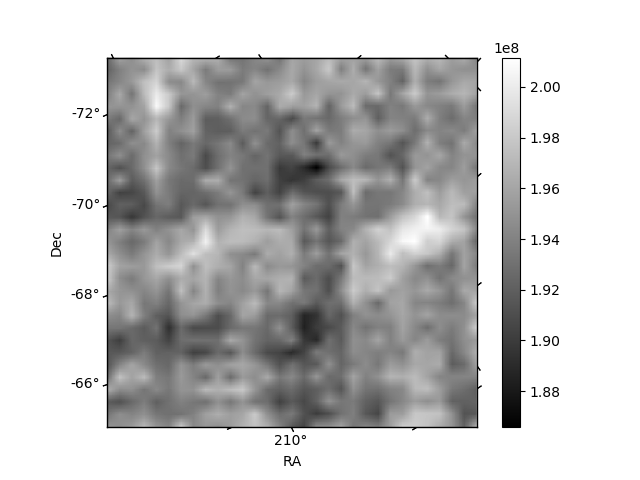
Quadrant B |
|---|---|---|---|
| Quadrant D | 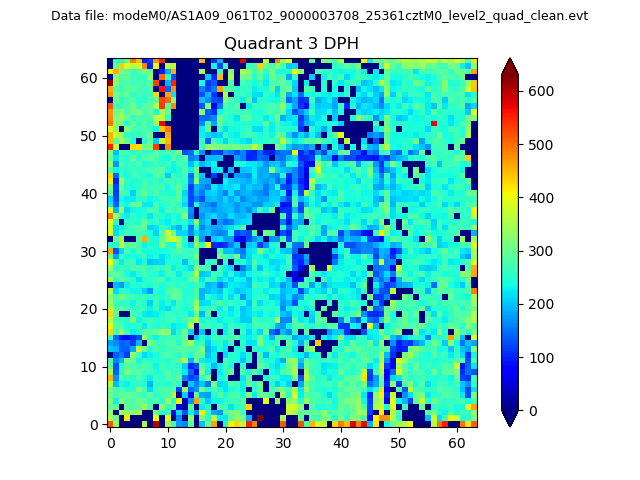 |
 |
Quadrant C |
| Plot type | Count rate plots | Images |
|---|---|---|
| Comparison with Poisson distribution Blue bars denote a histogram of data divided into 1 sec bins. Red curve is a Poisson curve with rate = median count rate of data. |
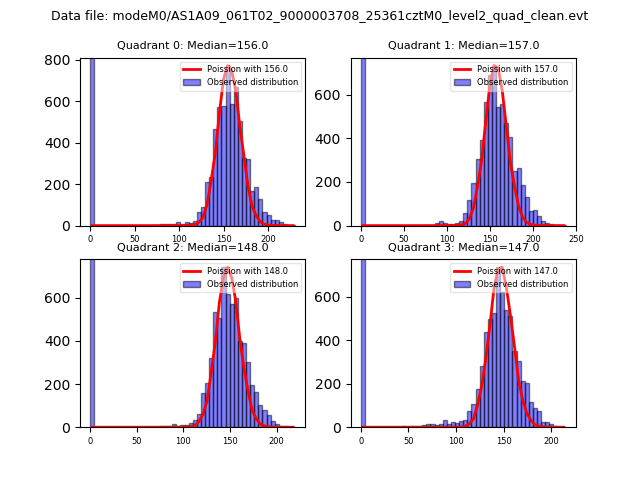 |
 |
| Quadrant-wise count rates Data is divided into 100 sec bins |
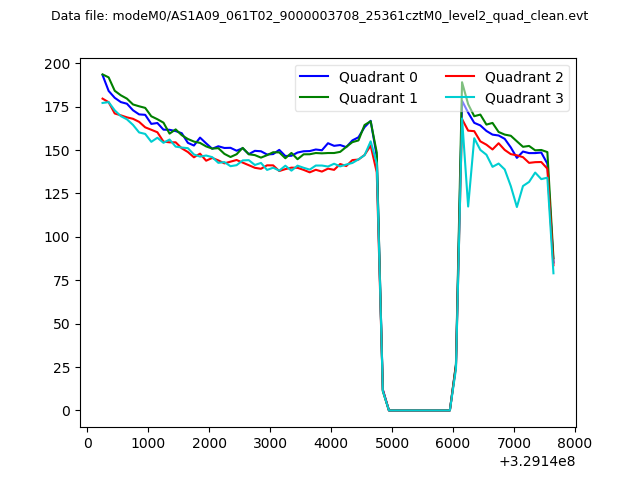 |
|
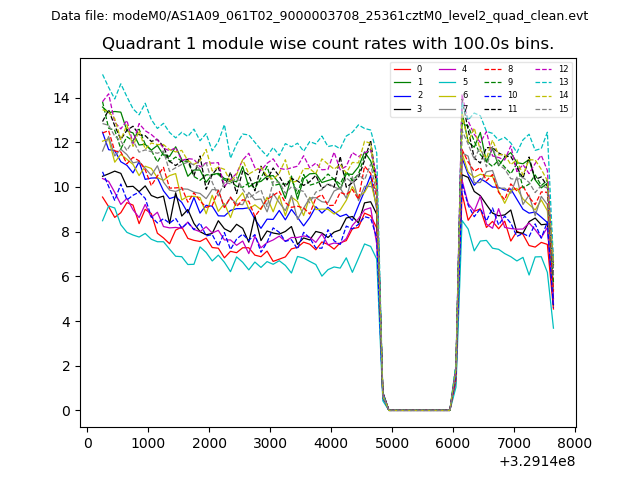
| Module-wise count rates for Quadrant A Data is divided into 100 sec bins |
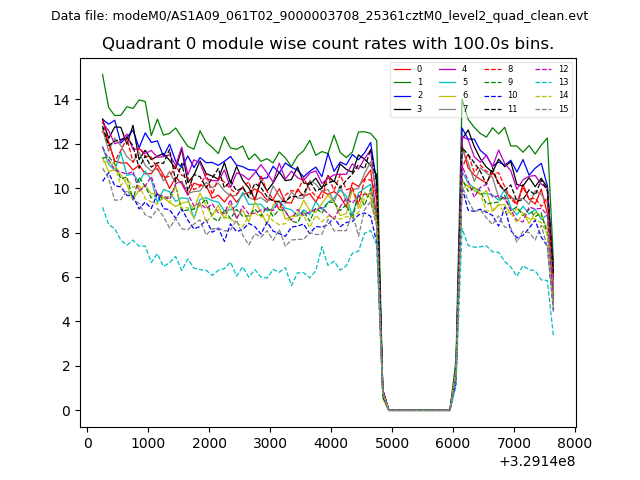 |
 |
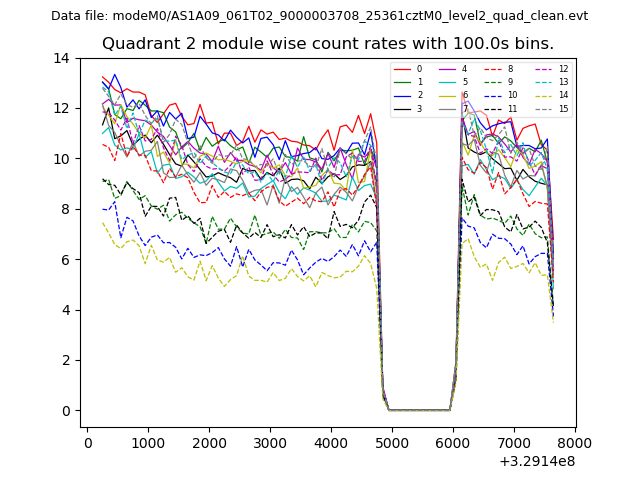
| Module-wise count rates for Quadrant B Data is divided into 100 sec bins |
 |
 |
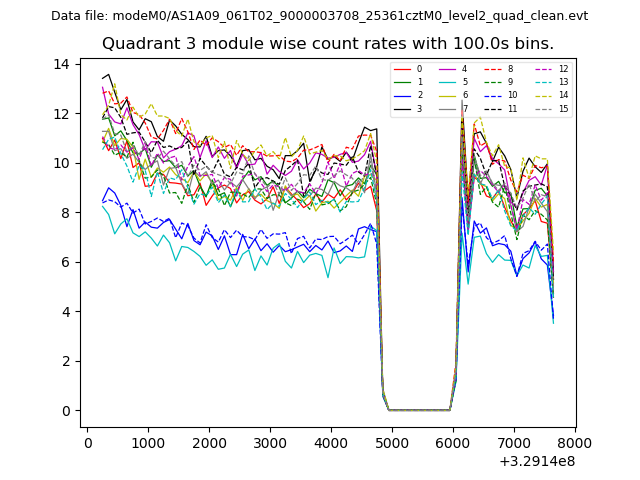
| Module-wise count rates for Quadrant C Data is divided into 100 sec bins |
 |
 |
| Module-wise count rates for Quadrant D Data is divided into 100 sec bins |
 |
 |
| Parameter | Plot |
|---|---|
| CZT HV Monitor | 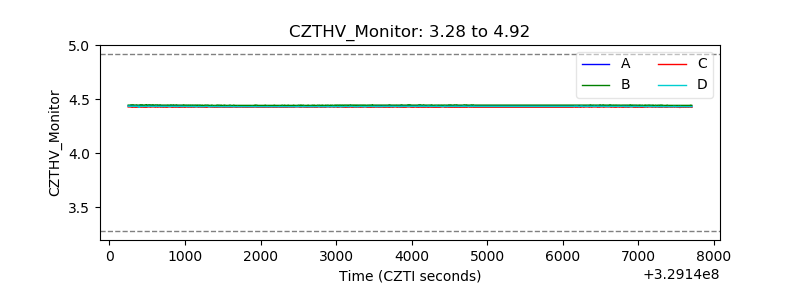 |
| D_VDD | 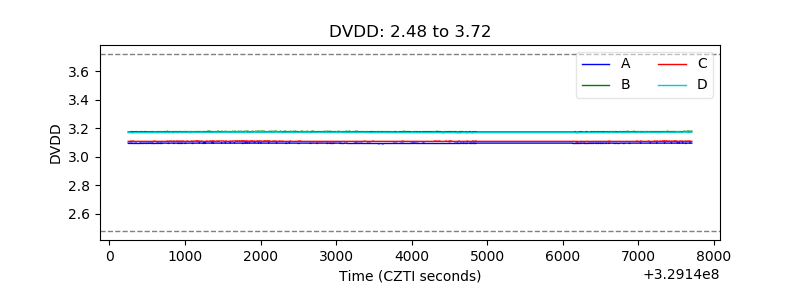 |
| Temperature 1 | 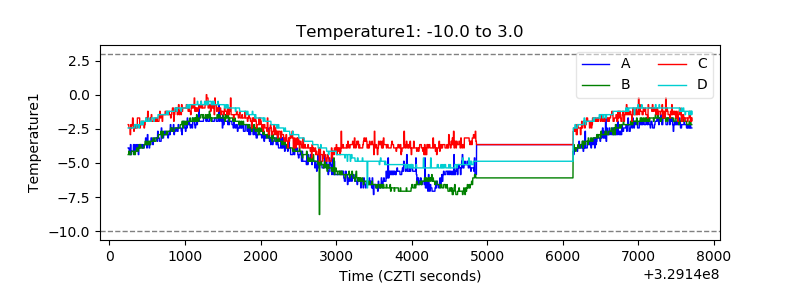 |
| Veto HV Monitor | 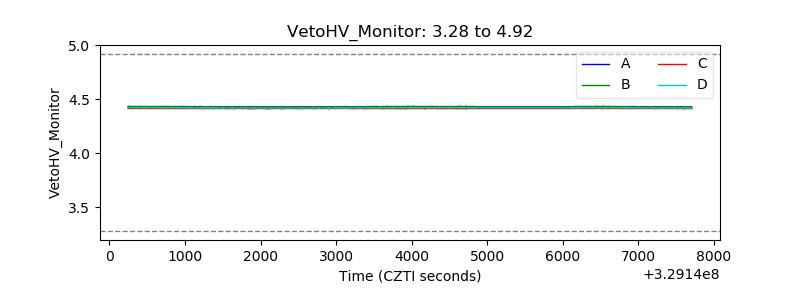 |
| Veto LLD | 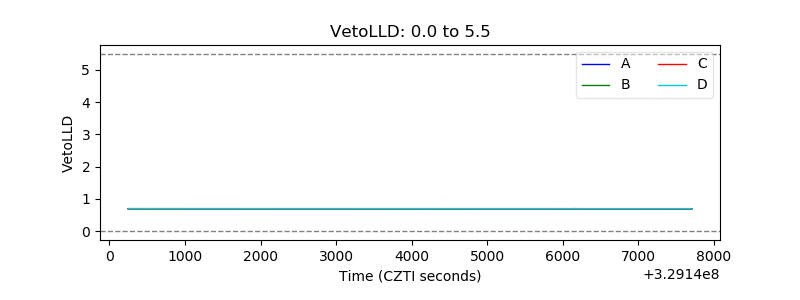 |
| Alpha Counter | 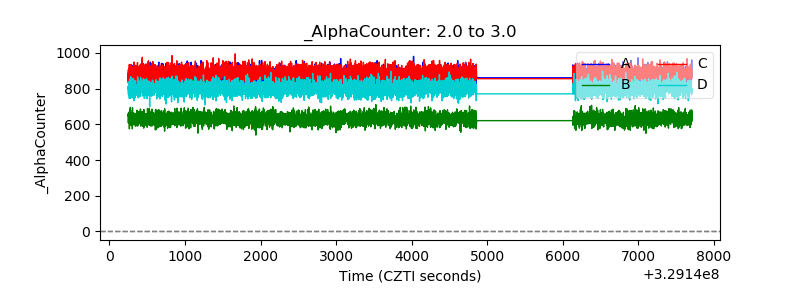 |
| _CPM_Rate | 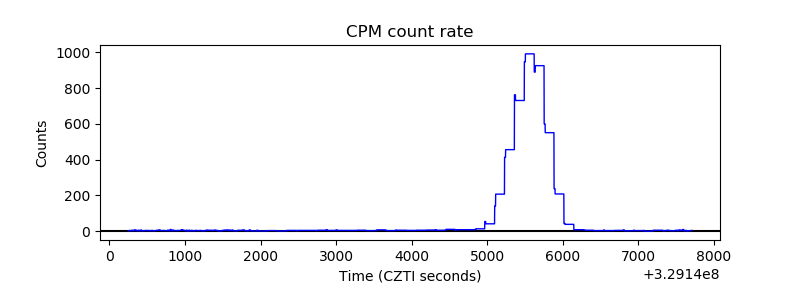 |
| CZT Counter | 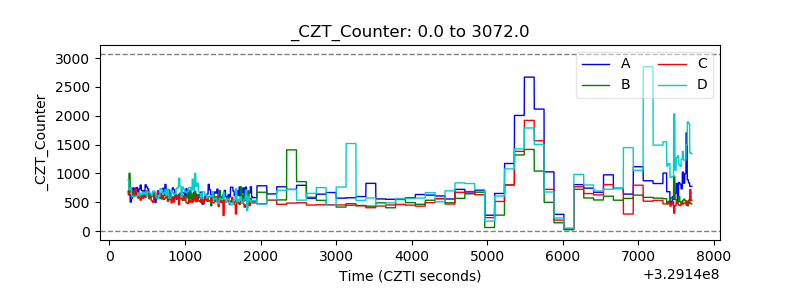 |
| +2.5 Volts monitor |  |
| +5 Volts monitor | 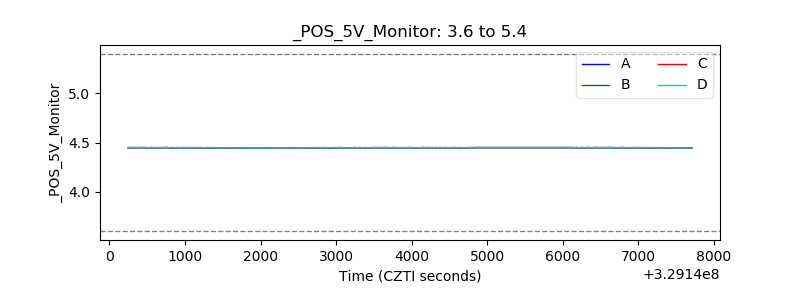 |
| _ROLL_ROT | 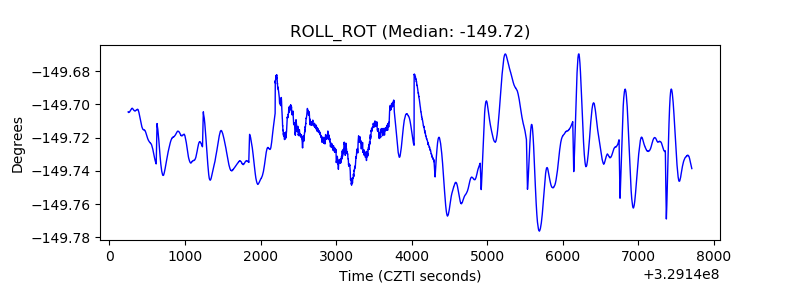 |
| _Roll_DEC | 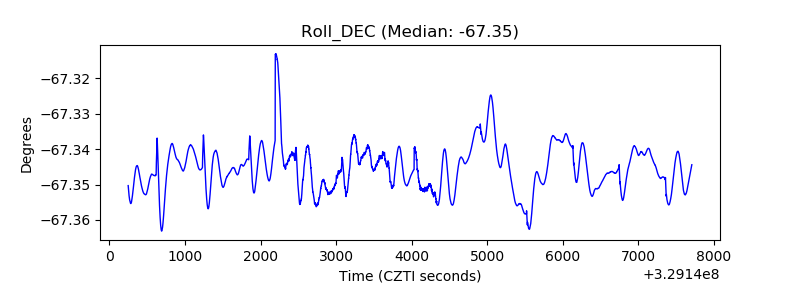 |
| _Roll_RA | 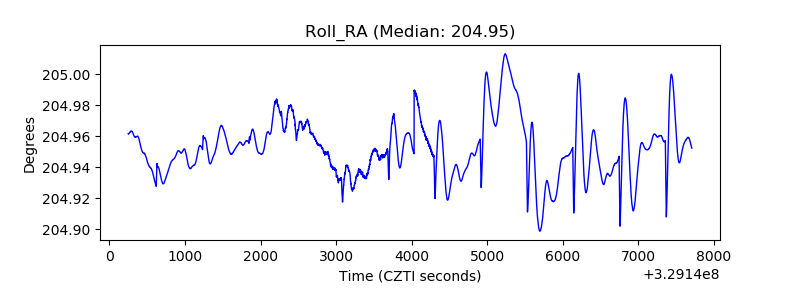 |
| Veto Counter | 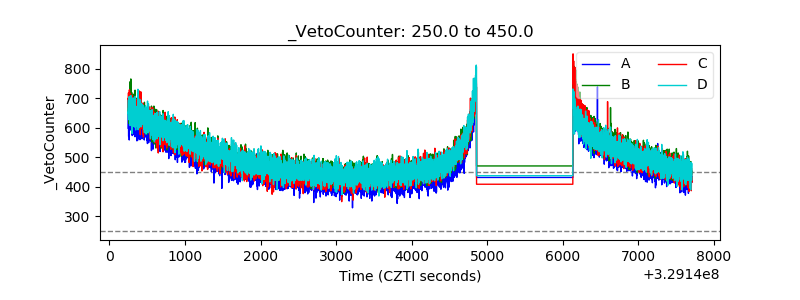 |