| Param | Original file | Final file |
|---|---|---|
| Filename | modeM0/AS1A09_061T02_9000003708_25362cztM0_level2.evt | modeM0/AS1A09_061T02_9000003708_25362cztM0_level2_quad_clean.evt |
| Size (bytes) | 534,343,680 | 118,992,960 |
| Size | 509.6 MB | 113.5 MB |
| Events in quadrant A | 3,968,228 | 823,240 |
| Events in quadrant B | 2,904,771 | 832,689 |
| Events in quadrant C | 3,164,026 | 781,876 |
| Events in quadrant D | 5,749,842 | 757,506 |
| Mode M0 | |||
|---|---|---|---|
| Quadrant | BADHDUFLAG | Total packets | Discarded packets |
| A | 0 | 15615 | 0 |
| B | 0 | 12104 | 0 |
| C | 0 | 13124 | 0 |
| D | 0 | 21128 | 0 |
| Mode M9 | |||
|---|---|---|---|
| Quadrant | BADHDUFLAG | Total packets | Discarded packets |
| A | 0 | 10 | 0 |
| B | 0 | 10 | 0 |
| C | 0 | 10 | 0 |
| D | 0 | 10 | 0 |
| Quadrant | Total seconds | Saturated seconds | Saturation percentage |
|---|---|---|---|
| A | 5845 | 81 | 1.385800% |
| B | 5846 | 45 | 0.769757% |
| C | 5846 | 84 | 1.436880% |
| D | 5845 | 329 | 5.628743% |
Noise dominated data is calculated using 1-second bins in cleaned event files. If a bin has >2000 counts, and if more than 50% of those come from <1% of pixels, then it is considered to be noise-dominated and hence unusable.
| Quadrant | # 1 sec bins | Bins with >0 counts | Bins with >2000 counts | High rate bins dominated by noise | Noise dominated (total time) | Noise dominated (detector-on time) | Marked lightcurve |
|---|---|---|---|---|---|---|---|
| A | 6895 | 5846 | 13 | 13 | 0.19% | 0.22% | 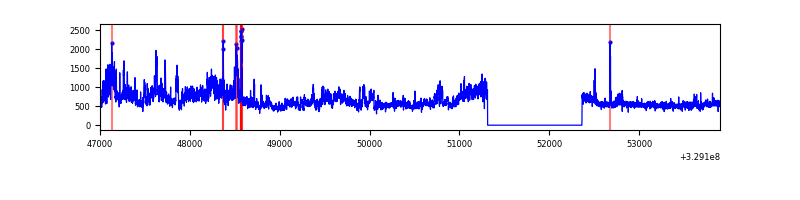 |
| B | 6896 | 5847 | 0 | 0 | 0.00% | 0.00% | 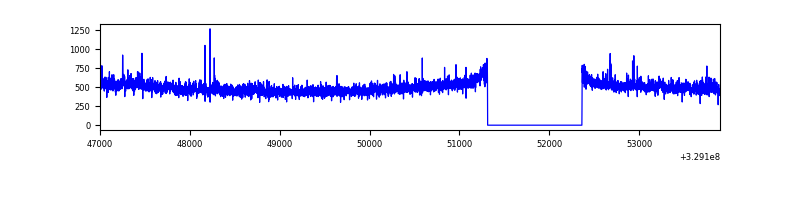 |
| C | 6896 | 5847 | 12 | 12 | 0.17% | 0.21% |  |
| D | 6895 | 5846 | 385 | 385 | 5.58% | 6.59% | 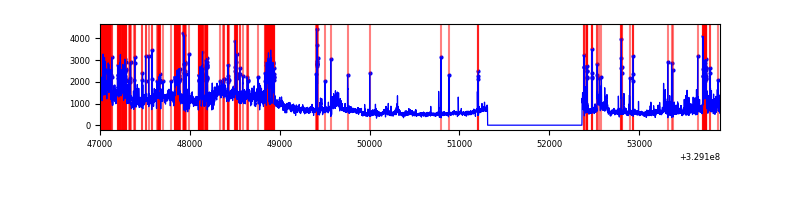 |
Top three noisy pixels from each quadrant. If the there are fewer than three noisy pixels in the level2.evt file, extra rows are filled as -1
| Pixel properties | Quadrant properties | ||||||
|---|---|---|---|---|---|---|---|
| Quadrant | DetID | PixID | Counts | Sigma | Mean | Median | Sigma |
| A | 6 | 16 | 1108340 | 7637.12 | 727 | 714 | 145.0 |
| A | 15 | 173 | 34199 | 230.88 | 727 | 714 | 145.0 |
| A | 3 | 1 | 22937 | 153.23 | 727 | 714 | 145.0 |
| B | 0 | 229 | 54502 | 398.34 | 720 | 704 | 135.1 |
| B | 12 | 111 | 15665 | 110.78 | 720 | 704 | 135.1 |
| B | 11 | 111 | 14407 | 101.46 | 720 | 704 | 135.1 |
| C | 7 | 87 | 315244 | 1983.97 | 684 | 688 | 158.5 |
| C | 14 | 238 | 113090 | 708.94 | 684 | 688 | 158.5 |
| C | 3 | 233 | 47478 | 295.11 | 684 | 688 | 158.5 |
| D | 1 | 52 | 2182242 | 13215.68 | 689 | 668 | 165.1 |
| D | 8 | 195 | 874645 | 5294.43 | 689 | 668 | 165.1 |
| D | 12 | 233 | 32573 | 193.28 | 689 | 668 | 165.1 |
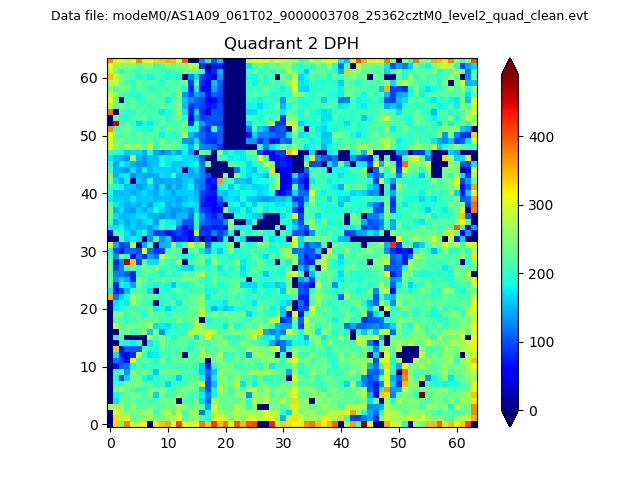
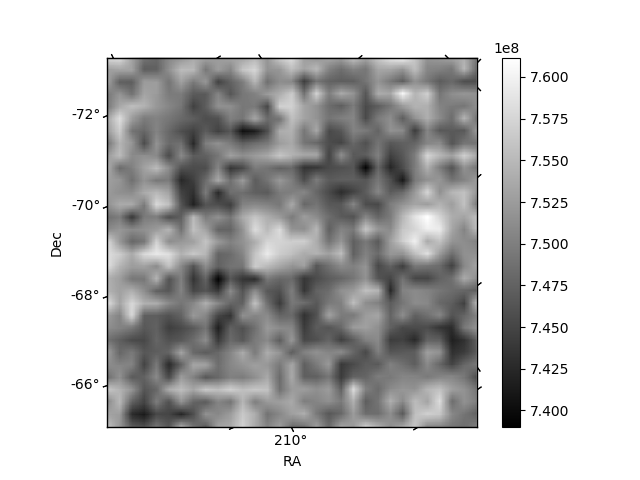
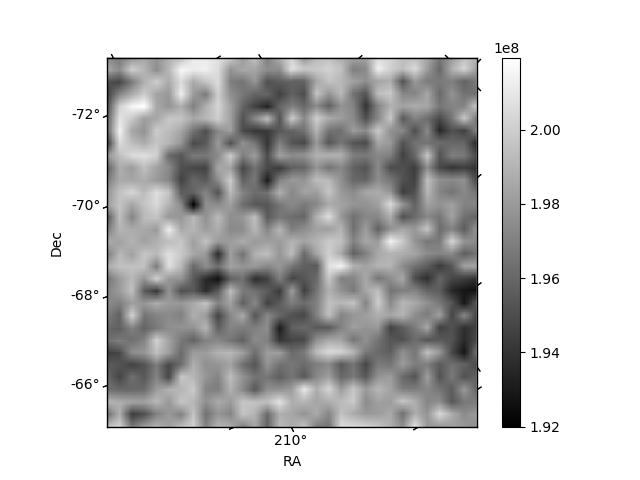
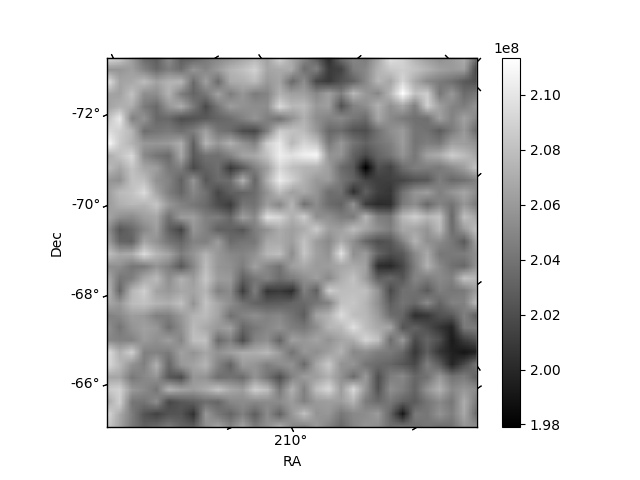
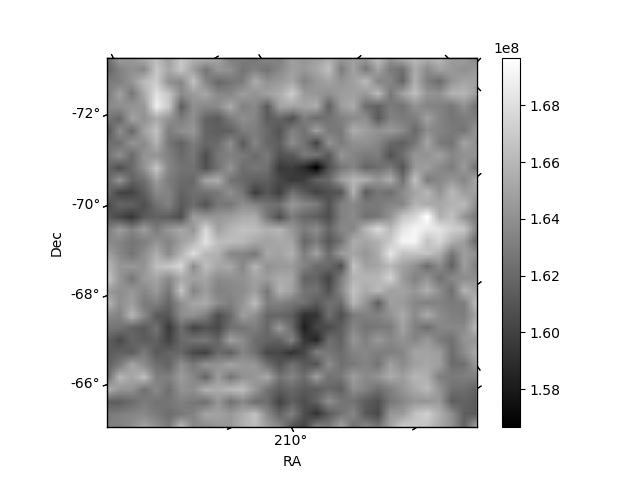
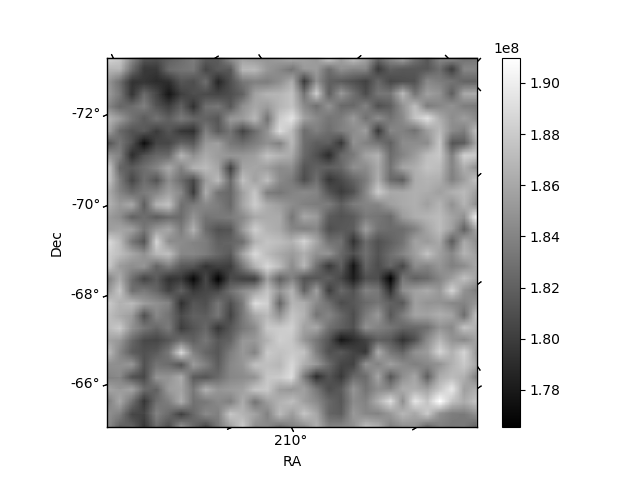
Histogram calculated using DETX and DETY for each event in the final _common_clean file
| Quadrant A | 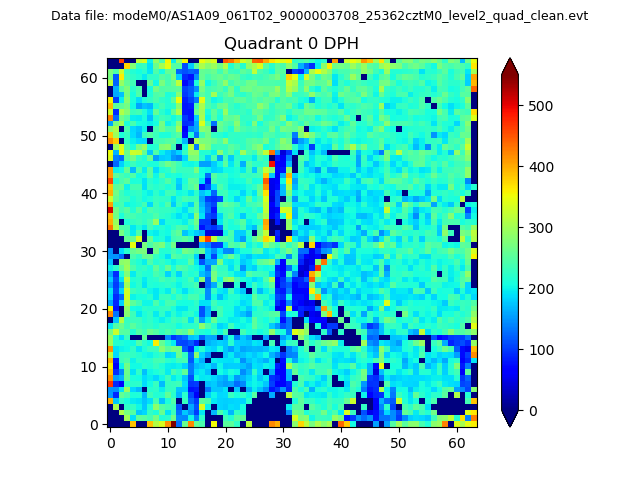 |
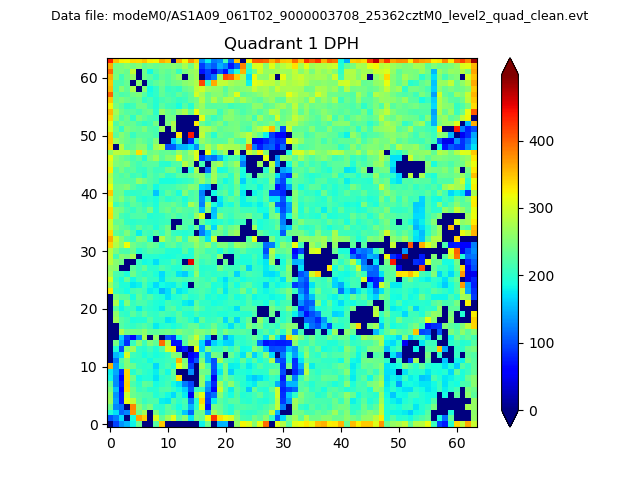 |
Quadrant B |
|---|---|---|---|
| Quadrant D | 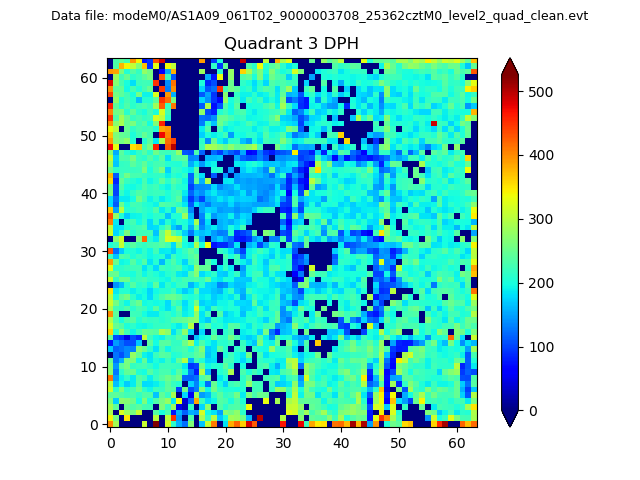 |
 |
Quadrant C |
| Plot type | Count rate plots | Images |
|---|---|---|
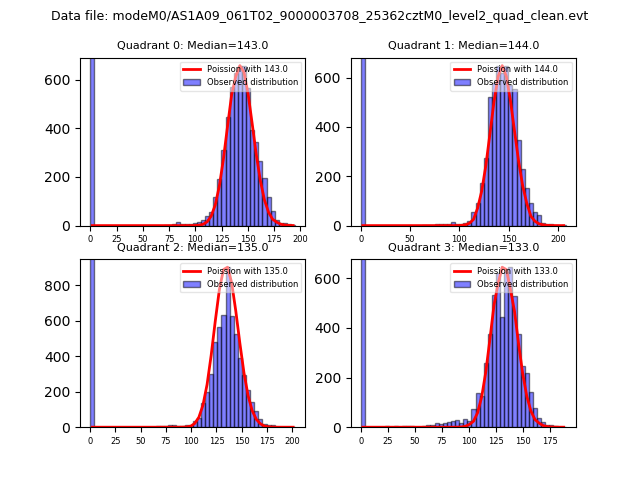
| Comparison with Poisson distribution Blue bars denote a histogram of data divided into 1 sec bins. Red curve is a Poisson curve with rate = median count rate of data. |
 |
 |
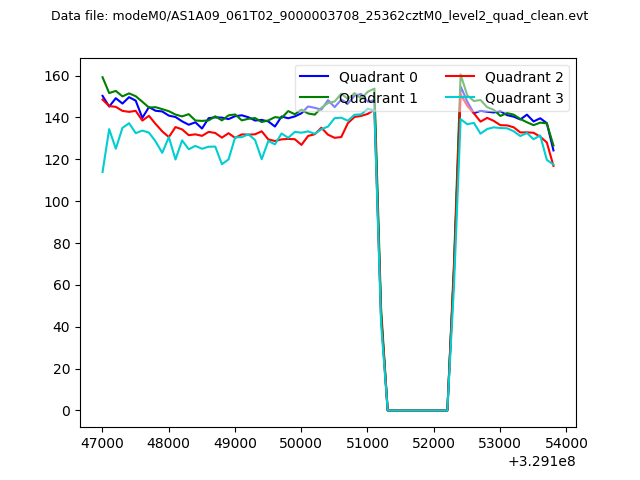
| Quadrant-wise count rates Data is divided into 100 sec bins |
 |
|
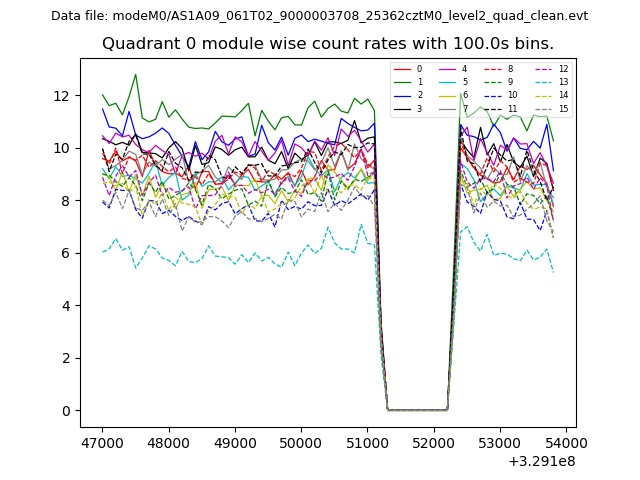
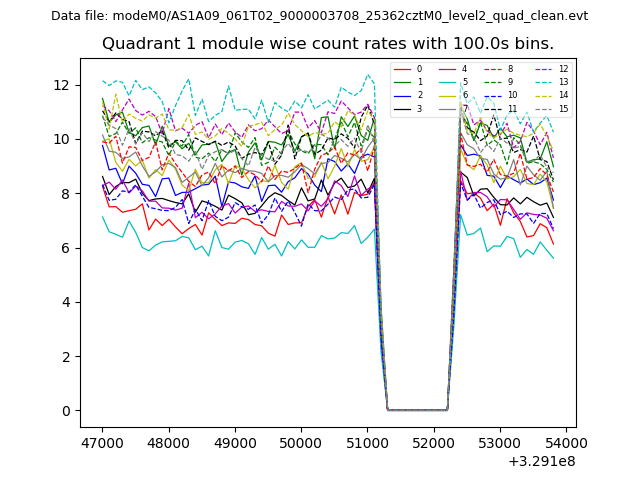
| Module-wise count rates for Quadrant A Data is divided into 100 sec bins |
 |
 |
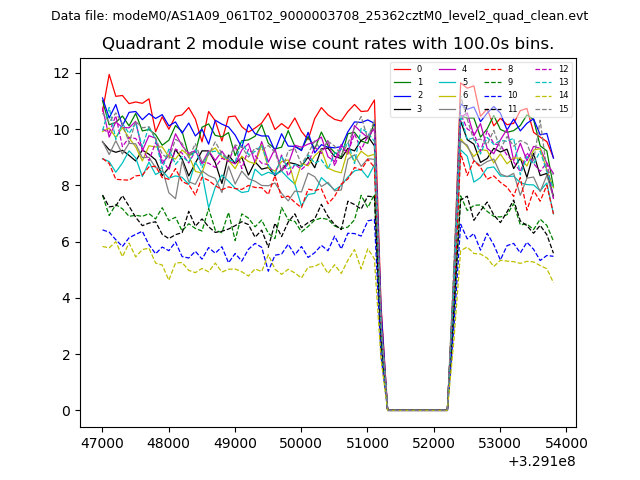
| Module-wise count rates for Quadrant B Data is divided into 100 sec bins |
 |
 |
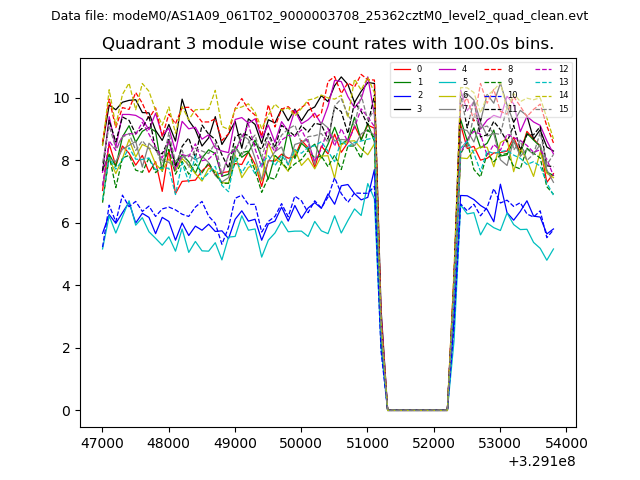
| Module-wise count rates for Quadrant C Data is divided into 100 sec bins |
 |
 |
| Module-wise count rates for Quadrant D Data is divided into 100 sec bins |
 |
 |
| Parameter | Plot |
|---|---|
| CZT HV Monitor | 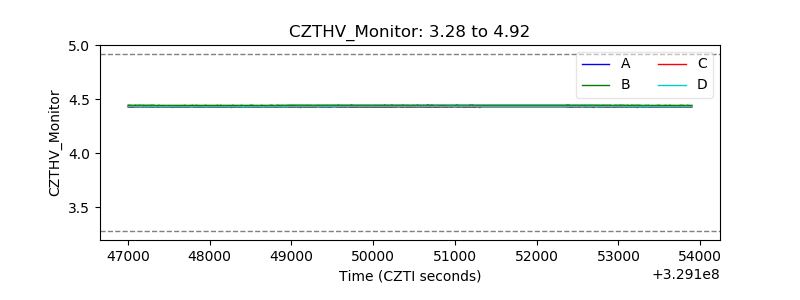 |
| D_VDD | 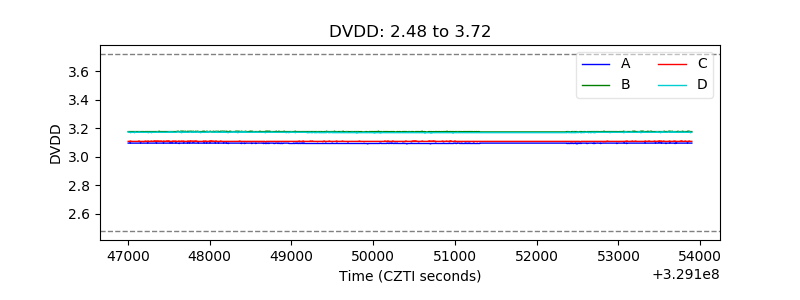 |
| Temperature 1 | 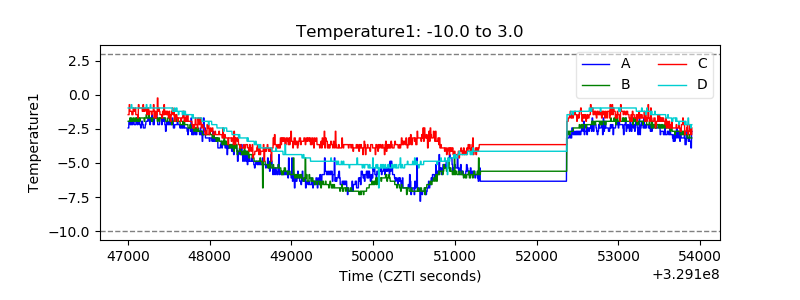 |
| Veto HV Monitor | 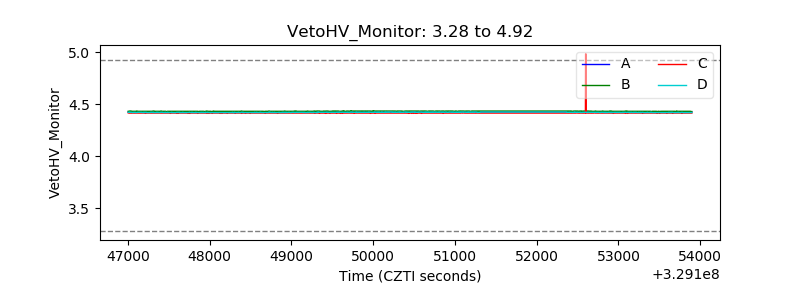 |
| Veto LLD | 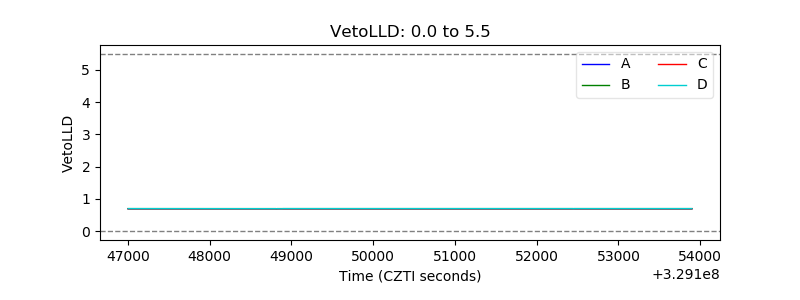 |
| Alpha Counter | 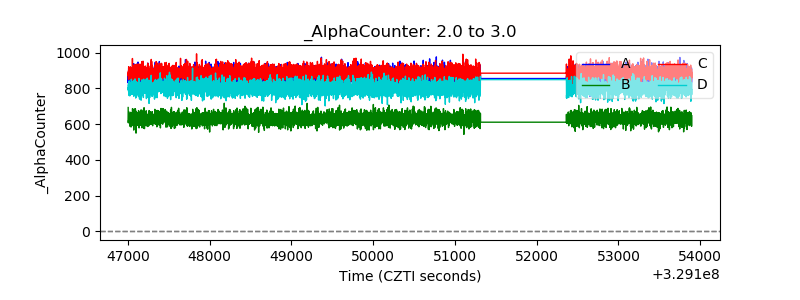 |
| _CPM_Rate | 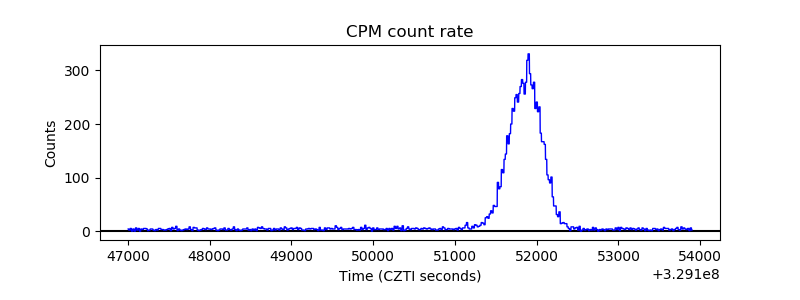 |
| CZT Counter | 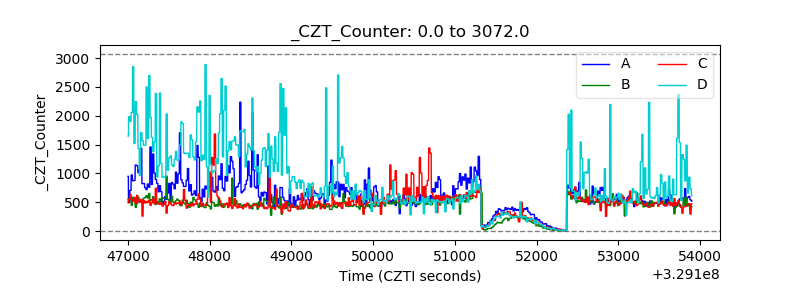 |
| +2.5 Volts monitor |  |
| +5 Volts monitor |  |
| _ROLL_ROT | 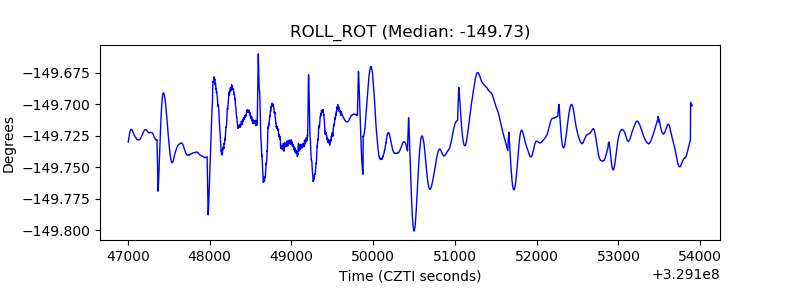 |
| _Roll_DEC | 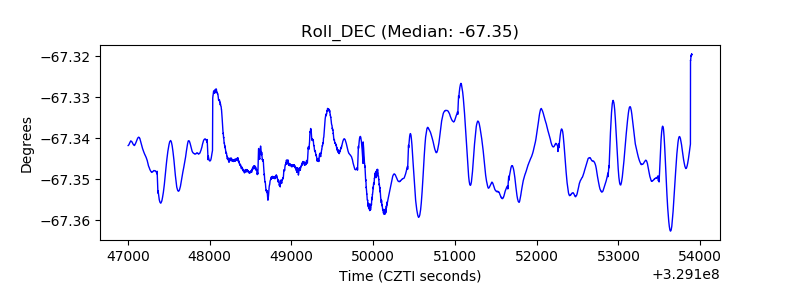 |
| _Roll_RA | 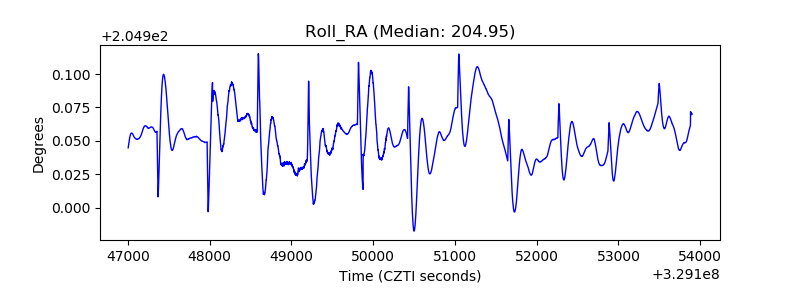 |
| Veto Counter | 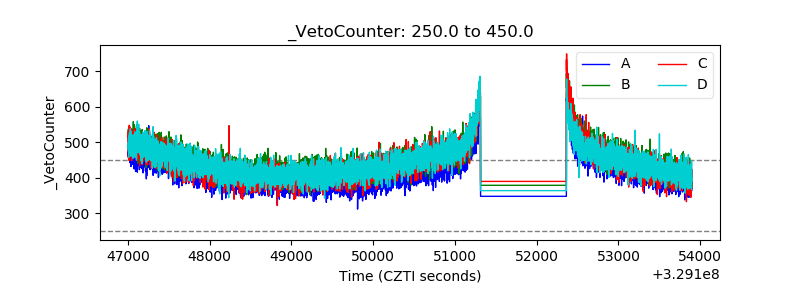 |