| Param | Original file | Final file |
|---|---|---|
| Filename | modeM0/AS1A09_061T02_9000003708_25363cztM0_level2.evt | modeM0/AS1A09_061T02_9000003708_25363cztM0_level2_quad_clean.evt |
| Size (bytes) | 123,842,880 | 31,368,960 |
| Size | 118.1 MB | 29.9 MB |
| Events in quadrant A | 897,274 | 213,696 |
| Events in quadrant B | 743,739 | 213,988 |
| Events in quadrant C | 735,004 | 204,475 |
| Events in quadrant D | 1,264,663 | 200,902 |
| Mode M0 | |||
|---|---|---|---|
| Quadrant | BADHDUFLAG | Total packets | Discarded packets |
| A | 0 | 3602 | 0 |
| B | 0 | 3181 | 0 |
| C | 0 | 3223 | 0 |
| D | 0 | 4869 | 0 |
| Quadrant | Total seconds | Saturated seconds | Saturation percentage |
|---|---|---|---|
| A | 1576 | 1 | 0.063452% |
| B | 1577 | 2 | 0.126823% |
| C | 1577 | 4 | 0.253646% |
| D | 1577 | 50 | 3.170577% |
Noise dominated data is calculated using 1-second bins in cleaned event files. If a bin has >2000 counts, and if more than 50% of those come from <1% of pixels, then it is considered to be noise-dominated and hence unusable.
| Quadrant | # 1 sec bins | Bins with >0 counts | Bins with >2000 counts | High rate bins dominated by noise | Noise dominated (total time) | Noise dominated (detector-on time) | Marked lightcurve |
|---|---|---|---|---|---|---|---|
| A | 1576 | 1576 | 0 | 0 | 0.00% | 0.00% | 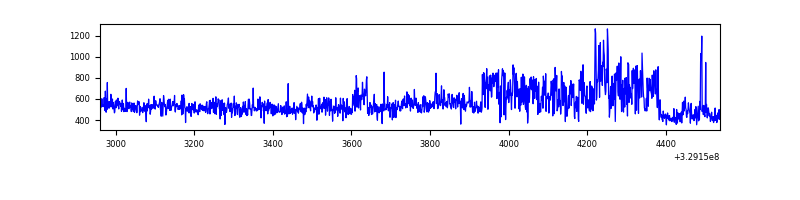 |
| B | 1577 | 1577 | 0 | 0 | 0.00% | 0.00% | 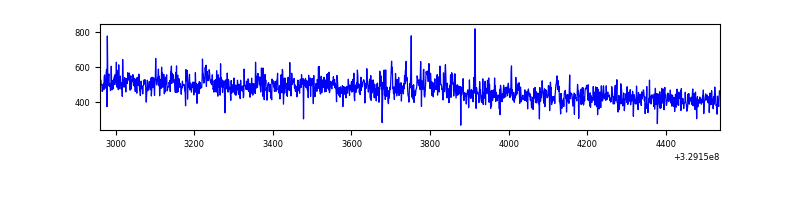 |
| C | 1577 | 1577 | 0 | 0 | 0.00% | 0.00% | 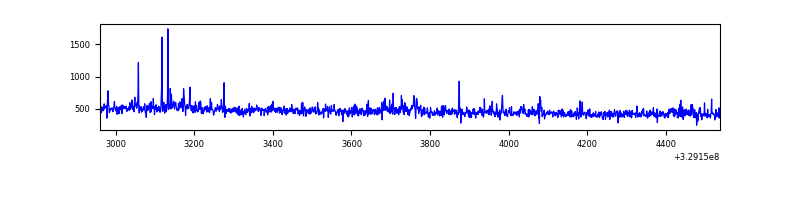 |
| D | 1577 | 1577 | 56 | 56 | 3.55% | 3.55% | 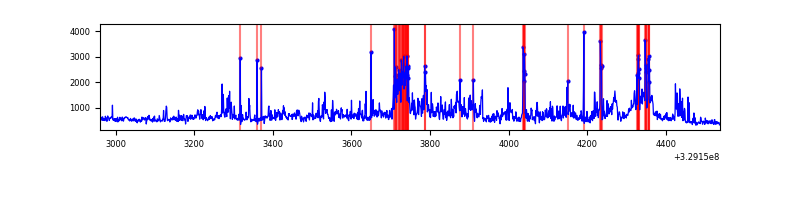 |
Top three noisy pixels from each quadrant. If the there are fewer than three noisy pixels in the level2.evt file, extra rows are filled as -1
| Pixel properties | Quadrant properties | ||||||
|---|---|---|---|---|---|---|---|
| Quadrant | DetID | PixID | Counts | Sigma | Mean | Median | Sigma |
| A | 6 | 16 | 152999 | 3923.99 | 186 | 182 | 38.9 |
| A | 3 | 1 | 13177 | 333.68 | 186 | 182 | 38.9 |
| A | 15 | 173 | 12346 | 312.34 | 186 | 182 | 38.9 |
| B | 0 | 229 | 23544 | 645.39 | 182 | 178 | 36.2 |
| B | 0 | 219 | 4966 | 132.25 | 182 | 178 | 36.2 |
| B | 12 | 111 | 3966 | 104.63 | 182 | 178 | 36.2 |
| C | 3 | 233 | 36079 | 874.46 | 170 | 171 | 41.1 |
| C | 14 | 238 | 27956 | 676.65 | 170 | 171 | 41.1 |
| C | 7 | 87 | 5073 | 119.38 | 170 | 171 | 41.1 |
| D | 8 | 195 | 271880 | 6282.03 | 175 | 170 | 43.3 |
| D | 1 | 52 | 255210 | 5896.61 | 175 | 170 | 43.3 |
| D | 7 | 238 | 56978 | 1313.42 | 175 | 170 | 43.3 |
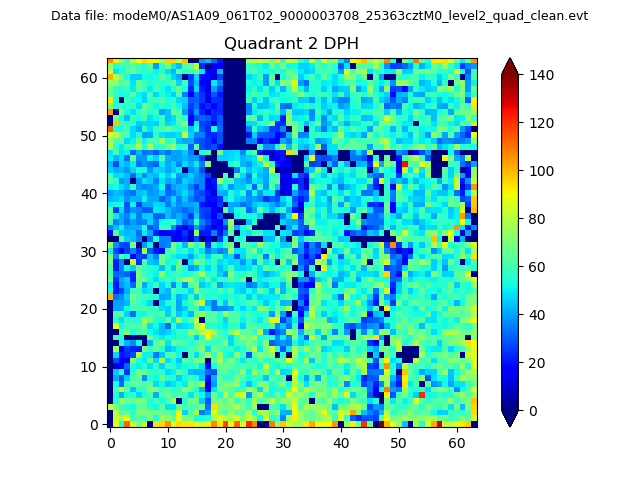
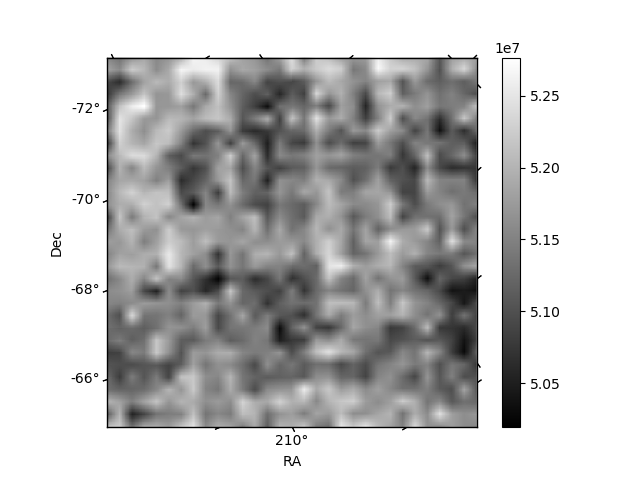
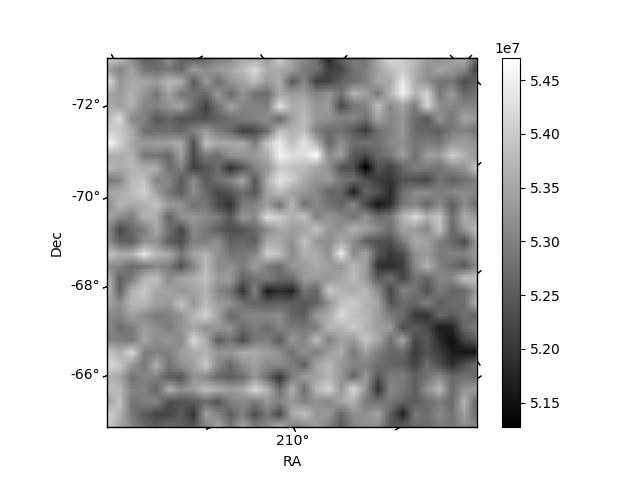
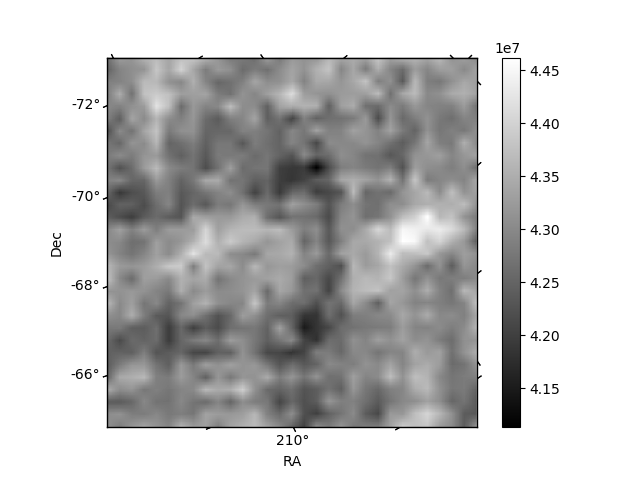
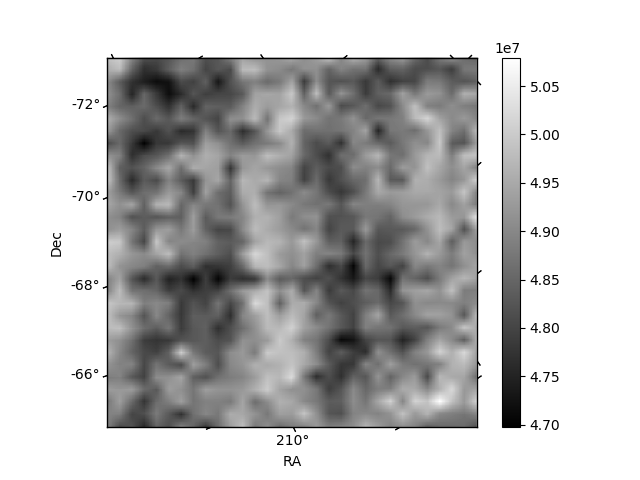
Histogram calculated using DETX and DETY for each event in the final _common_clean file
| Quadrant A | 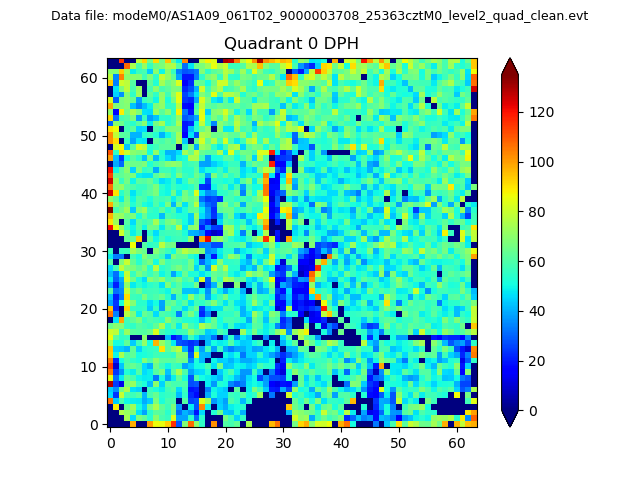 |
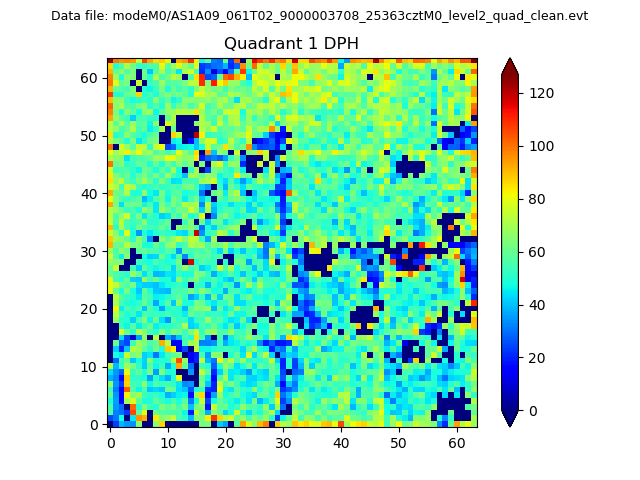 |
Quadrant B |
|---|---|---|---|
| Quadrant D | 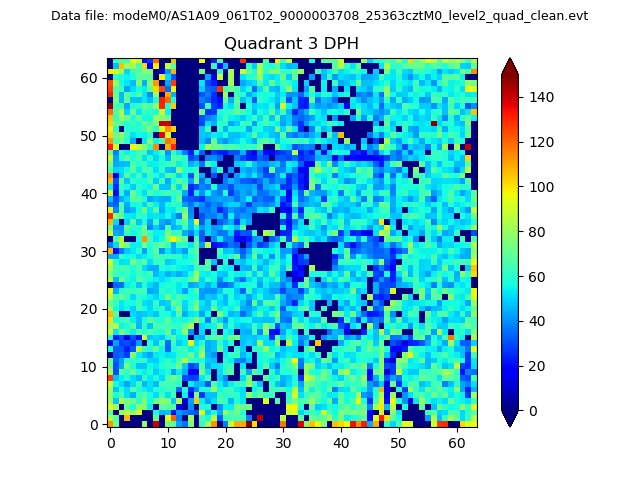 |
 |
Quadrant C |
| Plot type | Count rate plots | Images |
|---|---|---|
| Comparison with Poisson distribution Blue bars denote a histogram of data divided into 1 sec bins. Red curve is a Poisson curve with rate = median count rate of data. |
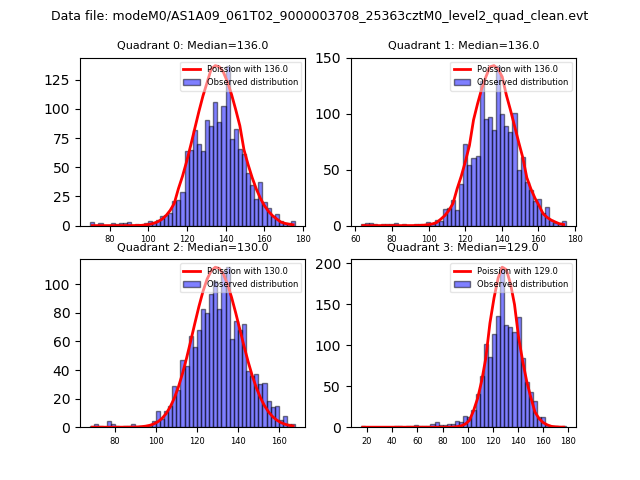 |
 |
| Quadrant-wise count rates Data is divided into 100 sec bins |
 |
|
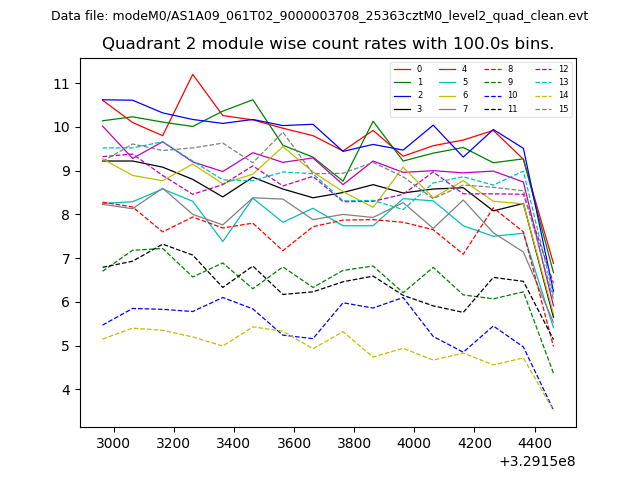
| Module-wise count rates for Quadrant A Data is divided into 100 sec bins |
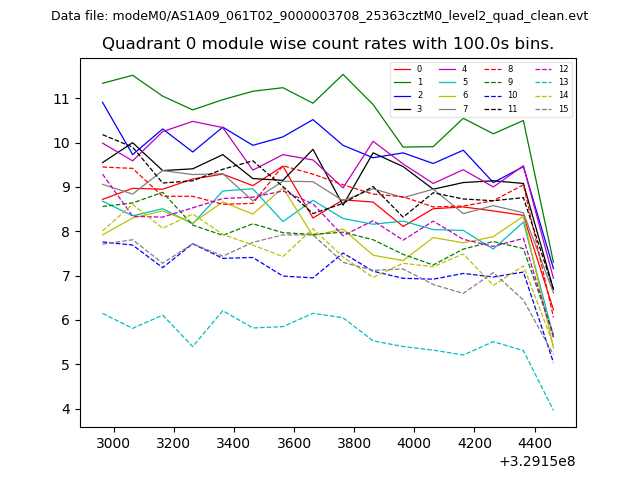 |
 |
| Module-wise count rates for Quadrant B Data is divided into 100 sec bins |
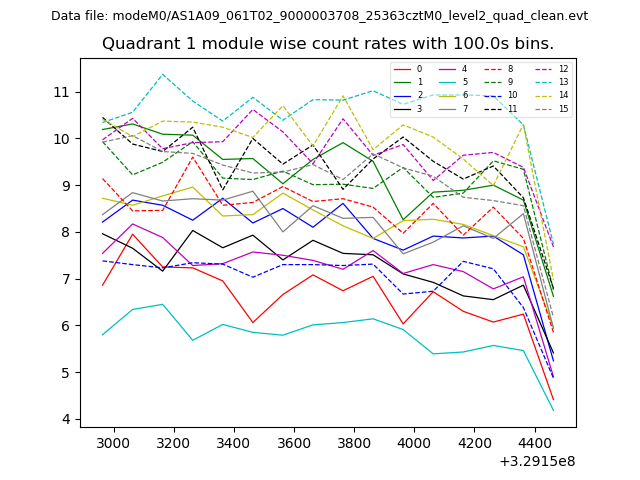 |
 |
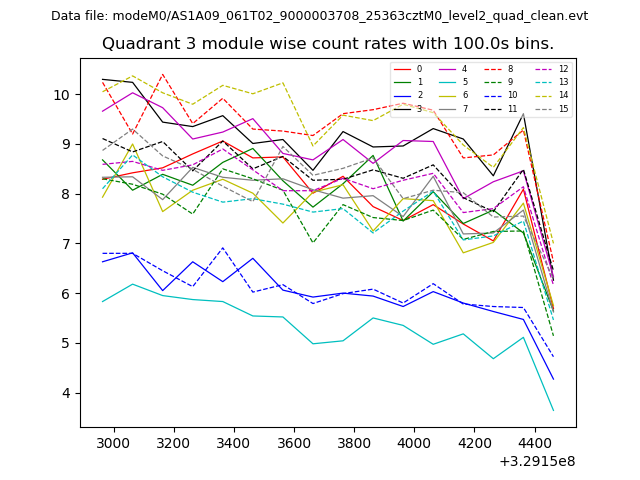
| Module-wise count rates for Quadrant C Data is divided into 100 sec bins |
 |
 |
| Module-wise count rates for Quadrant D Data is divided into 100 sec bins |
 |
 |
| Parameter | Plot |
|---|---|
| CZT HV Monitor | 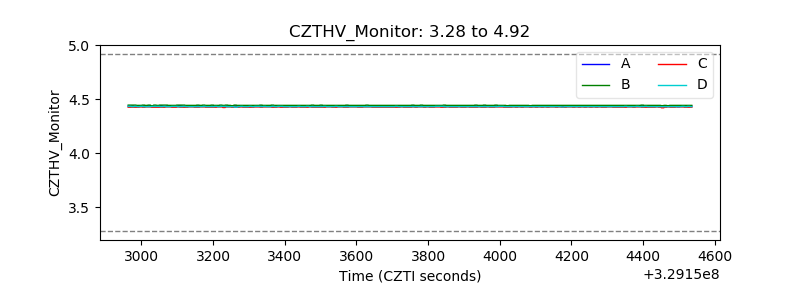 |
| D_VDD | 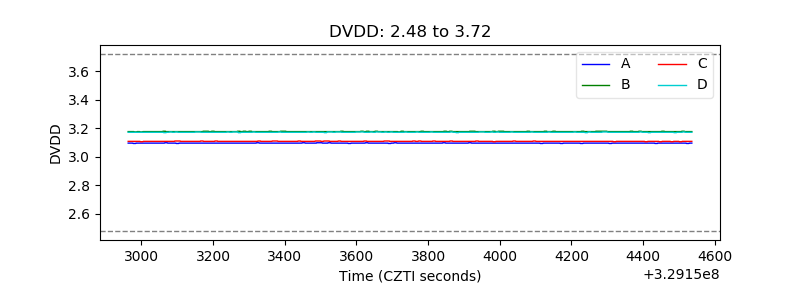 |
| Temperature 1 | 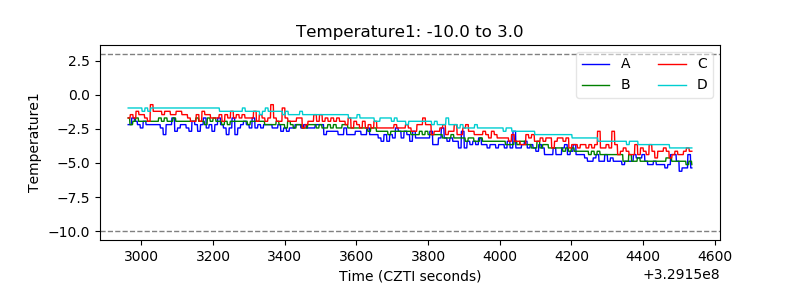 |
| Veto HV Monitor |  |
| Veto LLD | 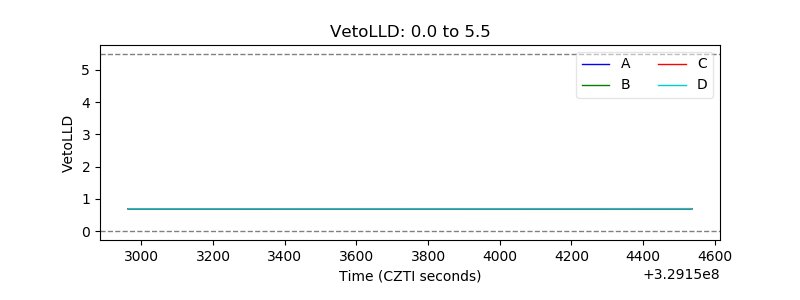 |
| Alpha Counter | 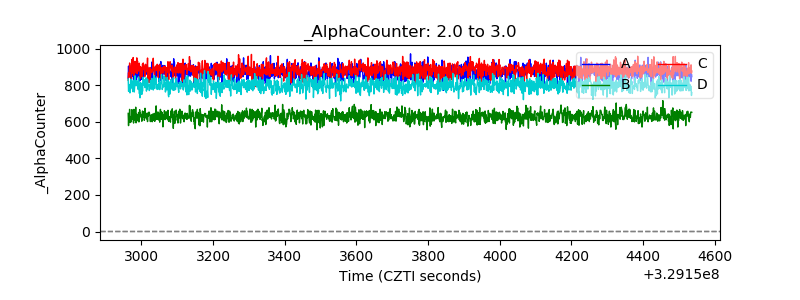 |
| _CPM_Rate | 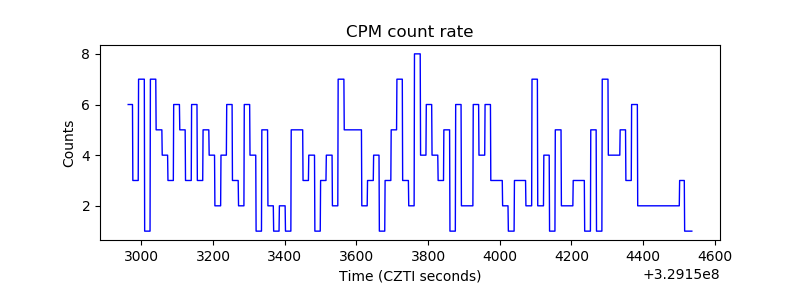 |
| CZT Counter | 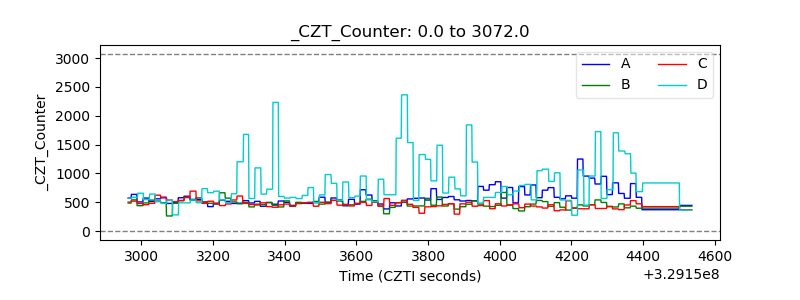 |
| +2.5 Volts monitor |  |
| +5 Volts monitor |  |
| _ROLL_ROT | 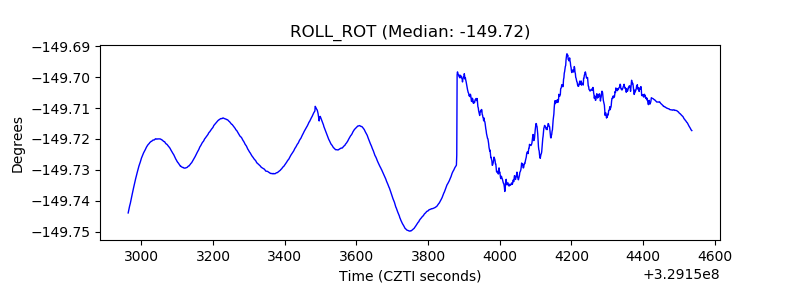 |
| _Roll_DEC | 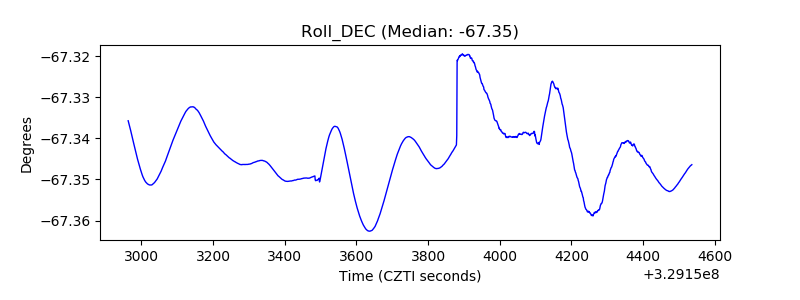 |
| _Roll_RA |  |
| Veto Counter | 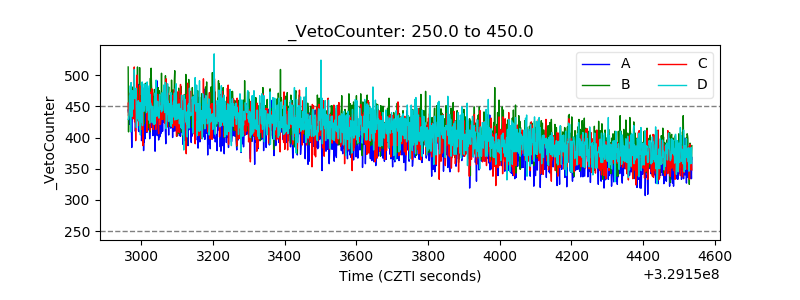 |