| Param | Original file | Final file |
|---|---|---|
| Filename | modeM0/AS1A09_104T01_9000003710_25363cztM0_level2.evt | modeM0/AS1A09_104T01_9000003710_25363cztM0_level2_quad_clean.evt |
| Size (bytes) | 256,570,560 | 41,682,240 |
| Size | 244.7 MB | 39.8 MB |
| Events in quadrant A | 2,163,930 | 260,805 |
| Events in quadrant B | 1,710,580 | 264,699 |
| Events in quadrant C | 1,672,478 | 251,253 |
| Events in quadrant D | 1,997,405 | 250,493 |
| Mode M9 | |||
|---|---|---|---|
| Quadrant | BADHDUFLAG | Total packets | Discarded packets |
| A | 0 | 6 | 0 |
| B | 0 | 6 | 0 |
| C | 0 | 6 | 0 |
| D | 0 | 6 | 0 |
| Mode M0 | |||
|---|---|---|---|
| Quadrant | BADHDUFLAG | Total packets | Discarded packets |
| A | 0 | 8738 | 0 |
| B | 0 | 7012 | 0 |
| C | 0 | 6914 | 0 |
| D | 0 | 8202 | 0 |
| Quadrant | Total seconds | Saturated seconds | Saturation percentage |
|---|---|---|---|
| A | 3303 | 112 | 3.390857% |
| B | 3303 | 111 | 3.360581% |
| C | 3303 | 120 | 3.633061% |
| D | 3303 | 99 | 2.997275% |
Noise dominated data is calculated using 1-second bins in cleaned event files. If a bin has >2000 counts, and if more than 50% of those come from <1% of pixels, then it is considered to be noise-dominated and hence unusable.
| Quadrant | # 1 sec bins | Bins with >0 counts | Bins with >2000 counts | High rate bins dominated by noise | Noise dominated (total time) | Noise dominated (detector-on time) | Marked lightcurve |
|---|---|---|---|---|---|---|---|
| A | 3913 | 3303 | 1 | 1 | 0.03% | 0.03% | 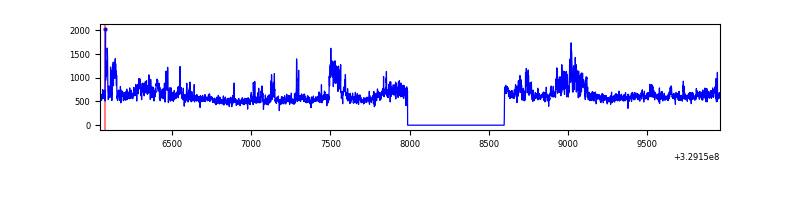 |
| B | 3913 | 3303 | 0 | 0 | 0.00% | 0.00% | 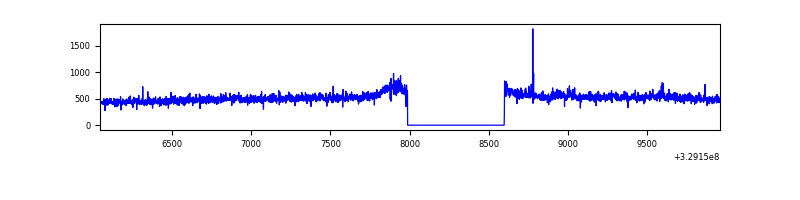 |
| C | 3913 | 3303 | 0 | 0 | 0.00% | 0.00% | 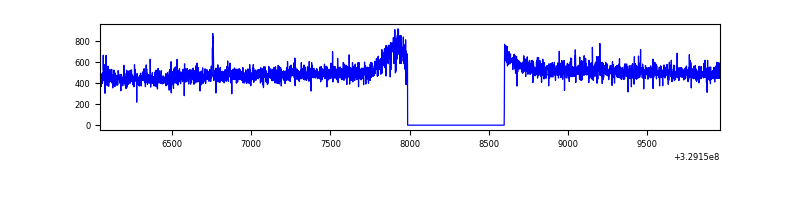 |
| D | 3913 | 3303 | 9 | 9 | 0.23% | 0.27% | 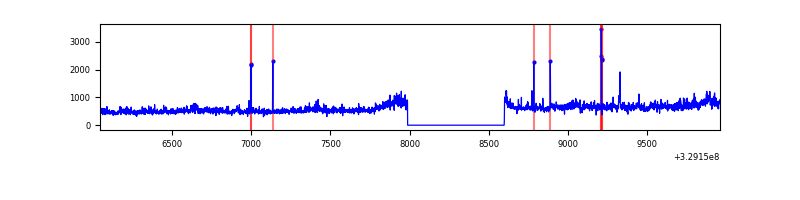 |
Top three noisy pixels from each quadrant. If the there are fewer than three noisy pixels in the level2.evt file, extra rows are filled as -1
| Pixel properties | Quadrant properties | ||||||
|---|---|---|---|---|---|---|---|
| Quadrant | DetID | PixID | Counts | Sigma | Mean | Median | Sigma |
| A | 6 | 16 | 364136 | 4107.27 | 433 | 423 | 88.6 |
| A | 3 | 1 | 105420 | 1185.69 | 433 | 423 | 88.6 |
| A | 15 | 173 | 21650 | 239.71 | 433 | 423 | 88.6 |
| B | 0 | 229 | 20727 | 243.77 | 426 | 415 | 83.3 |
| B | 12 | 111 | 10234 | 117.84 | 426 | 415 | 83.3 |
| B | 11 | 111 | 8994 | 102.96 | 426 | 415 | 83.3 |
| C | 14 | 238 | 65141 | 668.5 | 406 | 408 | 96.8 |
| C | 3 | 233 | 20079 | 203.14 | 406 | 408 | 96.8 |
| C | 13 | 61 | 2966 | 26.42 | 406 | 408 | 96.8 |
| D | 8 | 195 | 369511 | 3629.4 | 417 | 402 | 101.7 |
| D | 1 | 52 | 30056 | 291.58 | 417 | 402 | 101.7 |
| D | 7 | 238 | 16932 | 162.54 | 417 | 402 | 101.7 |
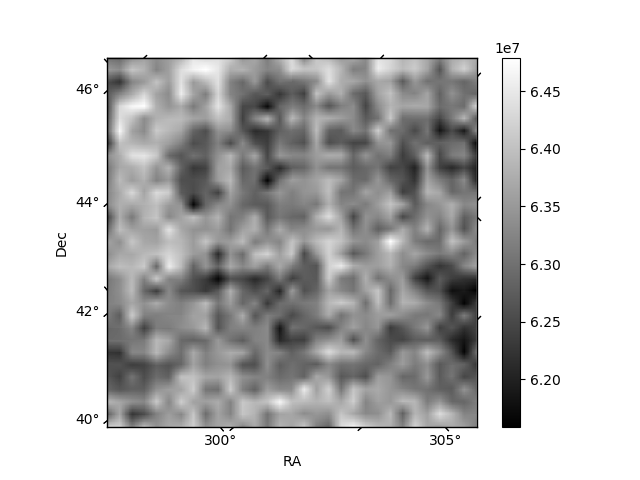
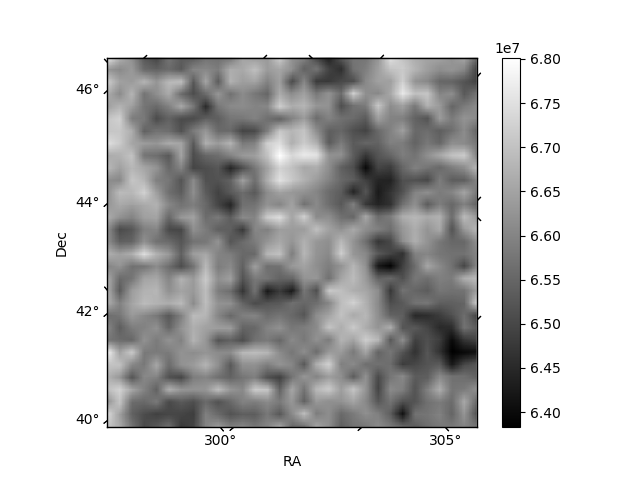
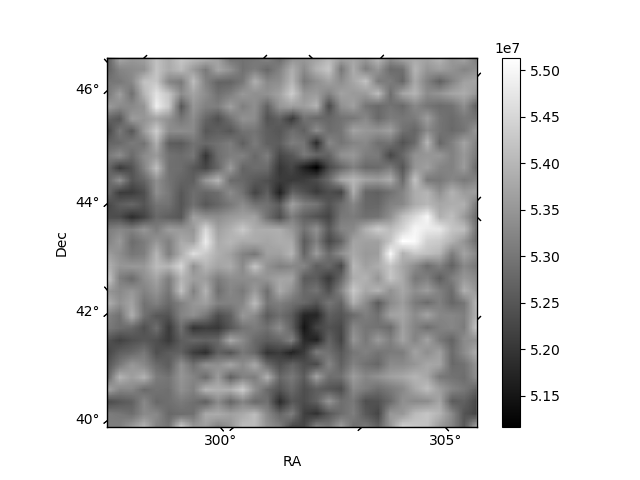
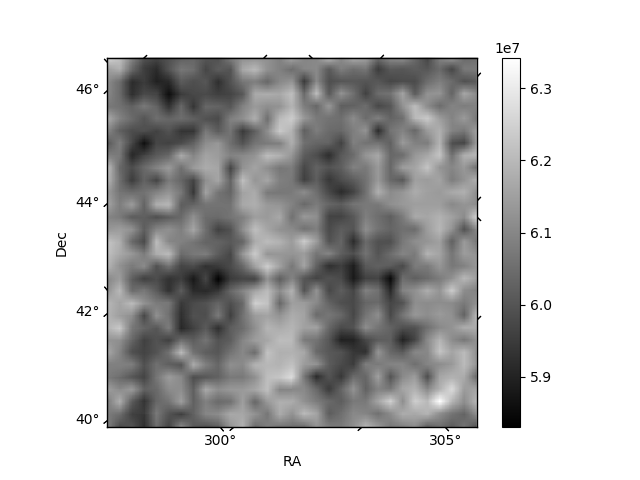
Histogram calculated using DETX and DETY for each event in the final _common_clean file
| Quadrant A | 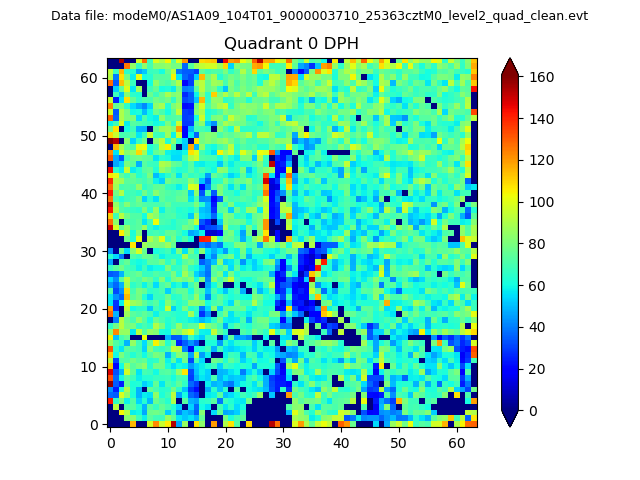 |
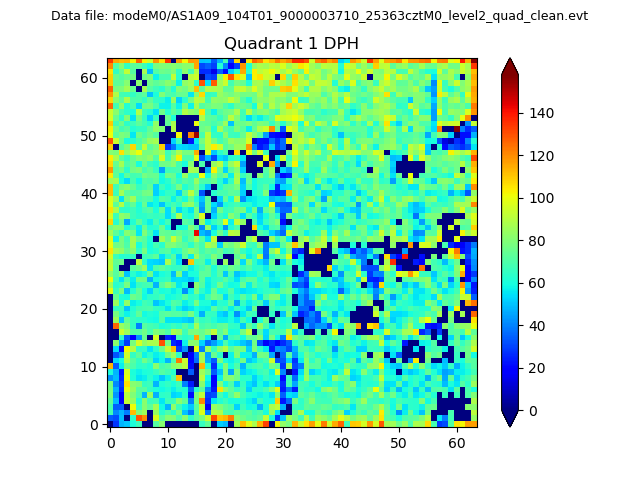 |
Quadrant B |
|---|---|---|---|
| Quadrant D | 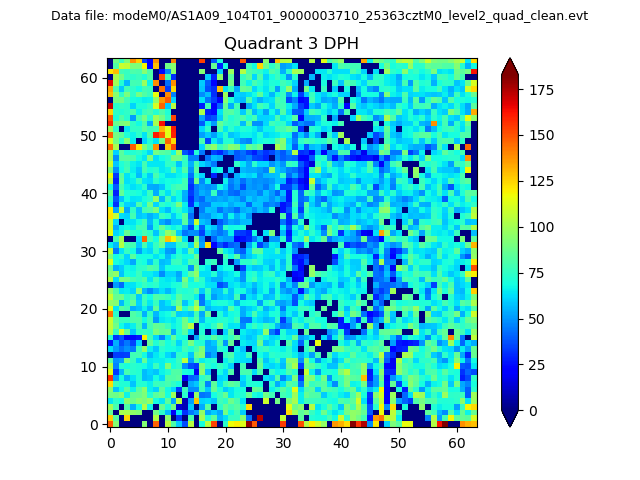 |
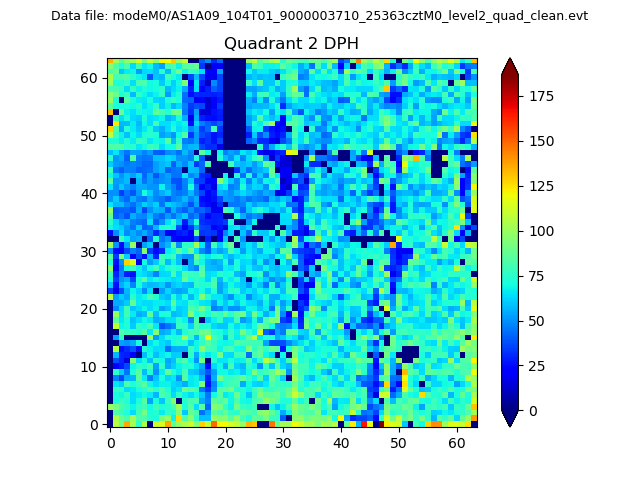 |
Quadrant C |
| Plot type | Count rate plots | Images |
|---|---|---|
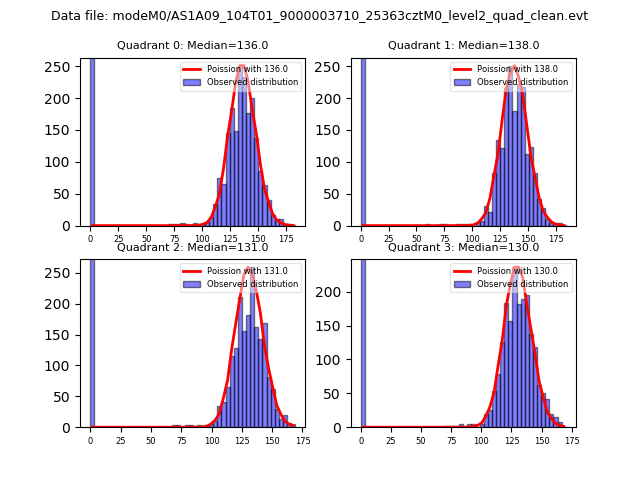
| Comparison with Poisson distribution Blue bars denote a histogram of data divided into 1 sec bins. Red curve is a Poisson curve with rate = median count rate of data. |
 |
 |
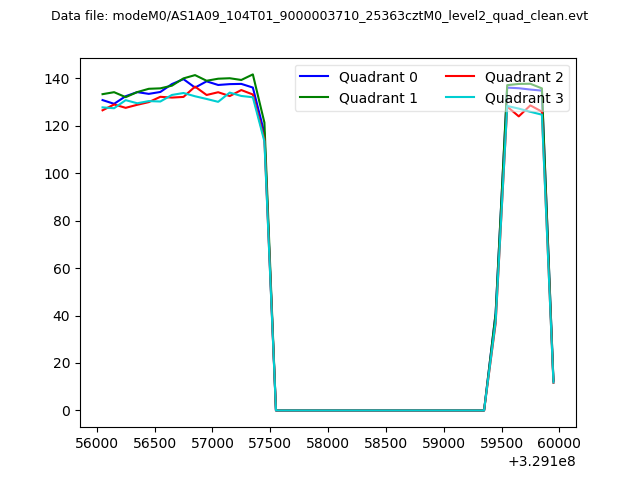
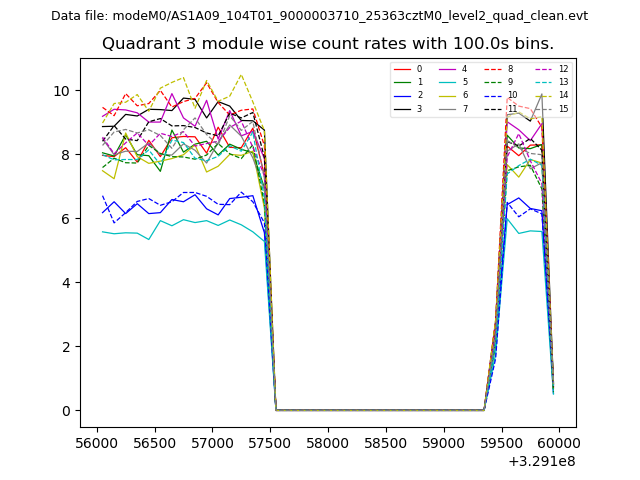
| Quadrant-wise count rates Data is divided into 100 sec bins |
 |
|
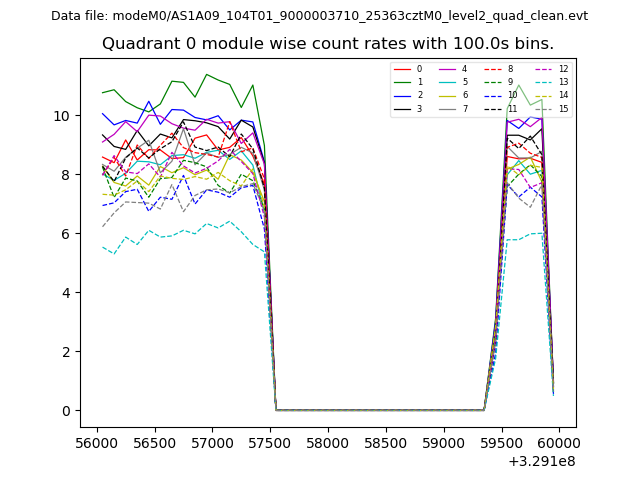
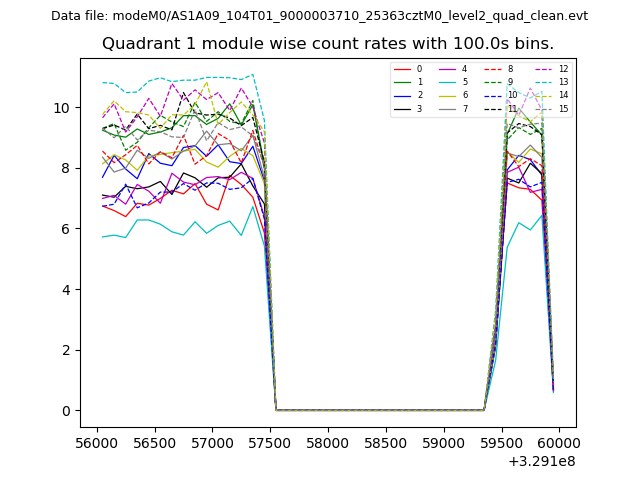
| Module-wise count rates for Quadrant A Data is divided into 100 sec bins |
 |
 |
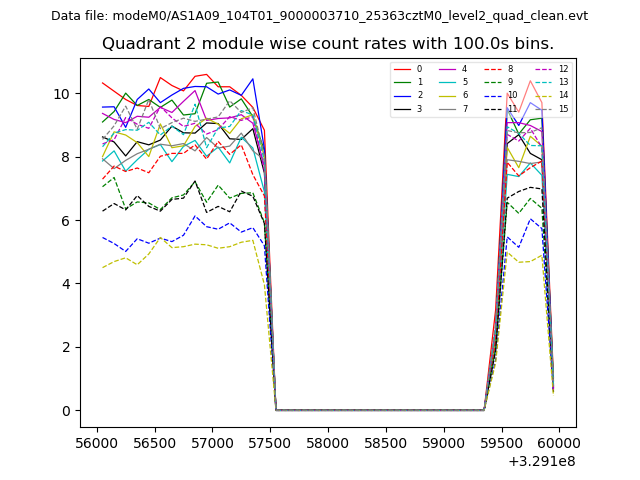
| Module-wise count rates for Quadrant B Data is divided into 100 sec bins |
 |
 |
| Module-wise count rates for Quadrant C Data is divided into 100 sec bins |
 |
 |
| Module-wise count rates for Quadrant D Data is divided into 100 sec bins |
 |
 |
| Parameter | Plot |
|---|---|
| CZT HV Monitor |  |
| D_VDD | 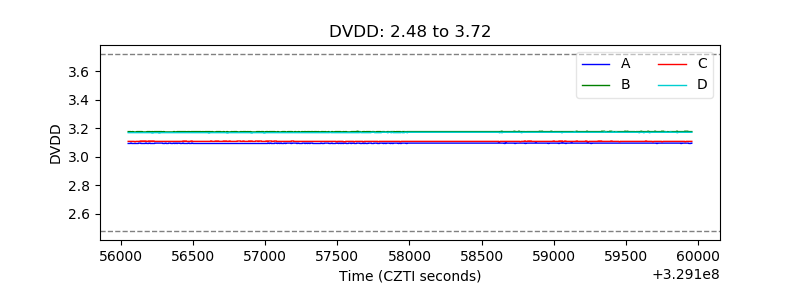 |
| Temperature 1 | 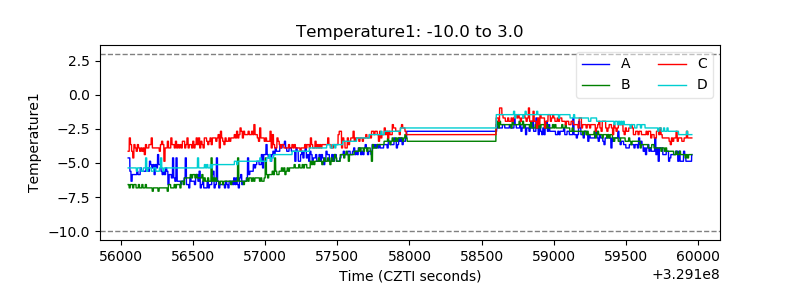 |
| Veto HV Monitor | 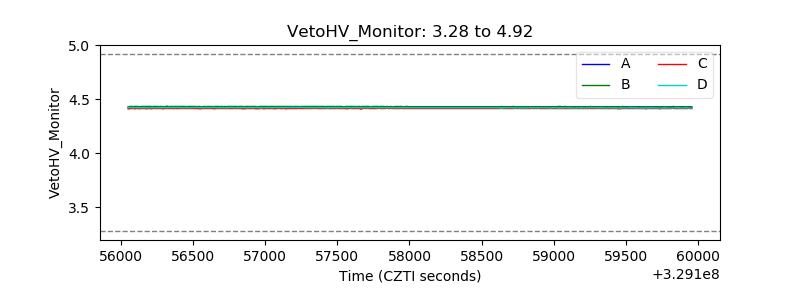 |
| Veto LLD | 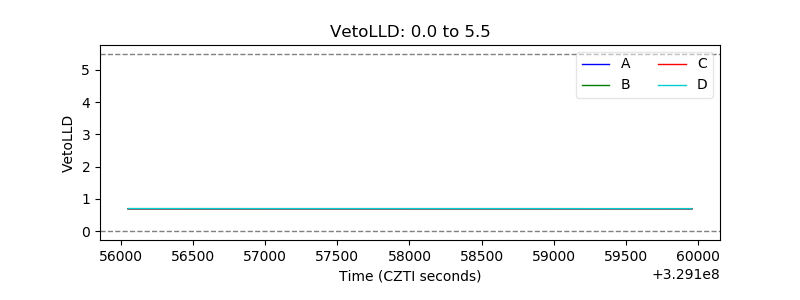 |
| Alpha Counter | 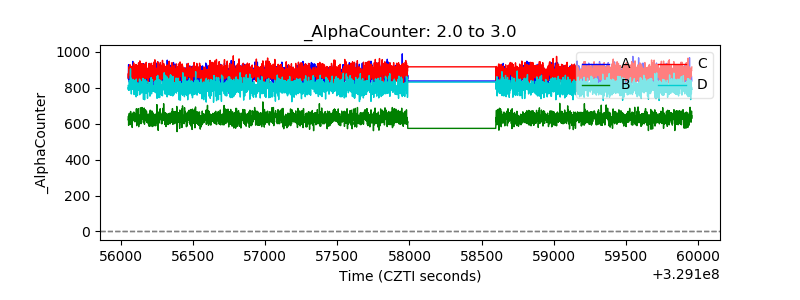 |
| _CPM_Rate | 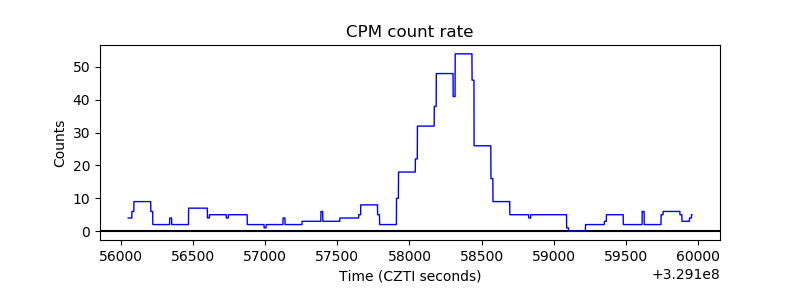 |
| CZT Counter | 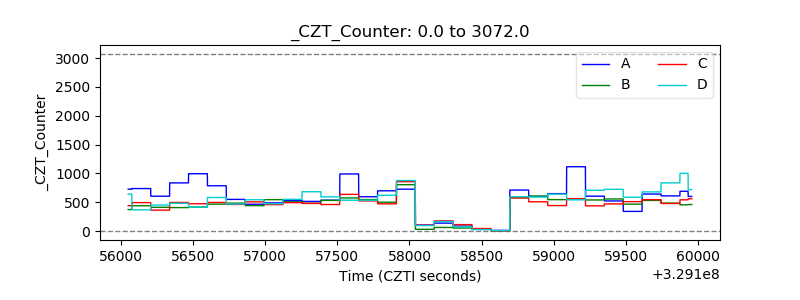 |
| +2.5 Volts monitor | 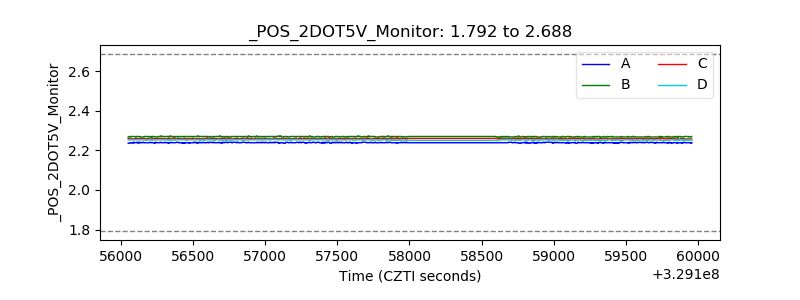 |
| +5 Volts monitor |  |
| _ROLL_ROT | 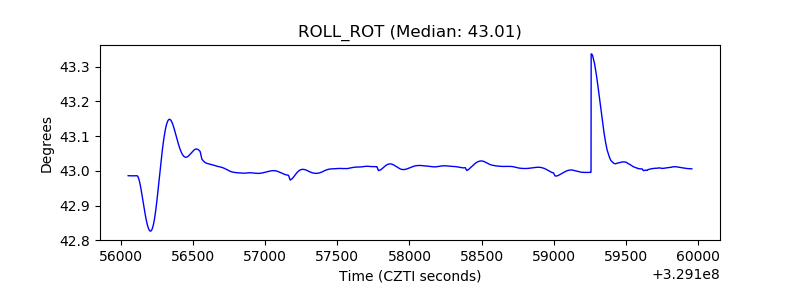 |
| _Roll_DEC | 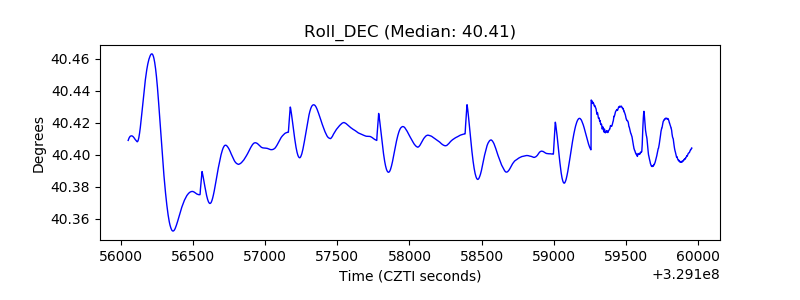 |
| _Roll_RA | 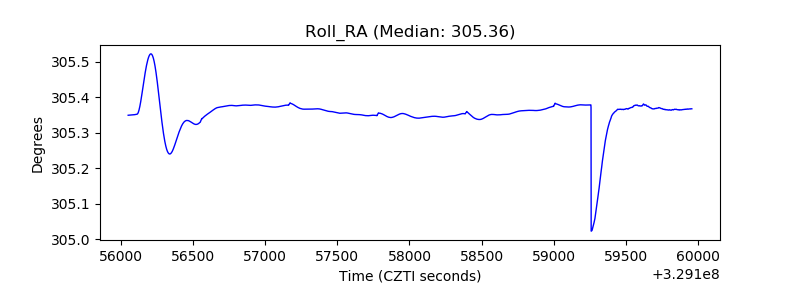 |
| Veto Counter | 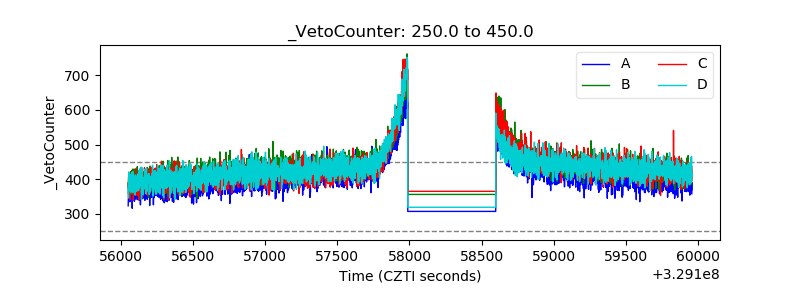 |