| Param | Original file | Final file |
|---|---|---|
| Filename | modeM0/AS1A09_104T01_9000003710_25364cztM0_level2.evt | modeM0/AS1A09_104T01_9000003710_25364cztM0_level2_quad_clean.evt |
| Size (bytes) | 530,599,680 | 97,430,400 |
| Size | 506.0 MB | 92.9 MB |
| Events in quadrant A | 4,259,839 | 624,383 |
| Events in quadrant B | 3,533,529 | 630,087 |
| Events in quadrant C | 3,504,968 | 597,870 |
| Events in quadrant D | 4,279,371 | 593,919 |
| Mode M9 | |||
|---|---|---|---|
| Quadrant | BADHDUFLAG | Total packets | Discarded packets |
| A | 0 | 2 | 0 |
| B | 0 | 2 | 0 |
| C | 0 | 2 | 0 |
| D | 0 | 2 | 0 |
| Mode M0 | |||
|---|---|---|---|
| Quadrant | BADHDUFLAG | Total packets | Discarded packets |
| A | 0 | 17268 | 0 |
| B | 0 | 15035 | 0 |
| C | 0 | 14892 | 0 |
| D | 0 | 17490 | 0 |
| Quadrant | Total seconds | Saturated seconds | Saturation percentage |
|---|---|---|---|
| A | 7239 | 110 | 1.519547% |
| B | 7240 | 84 | 1.160221% |
| C | 7240 | 142 | 1.961326% |
| D | 7240 | 79 | 1.091160% |
Noise dominated data is calculated using 1-second bins in cleaned event files. If a bin has >2000 counts, and if more than 50% of those come from <1% of pixels, then it is considered to be noise-dominated and hence unusable.
| Quadrant | # 1 sec bins | Bins with >0 counts | Bins with >2000 counts | High rate bins dominated by noise | Noise dominated (total time) | Noise dominated (detector-on time) | Marked lightcurve |
|---|---|---|---|---|---|---|---|
| A | 7494 | 7240 | 27 | 27 | 0.36% | 0.37% | 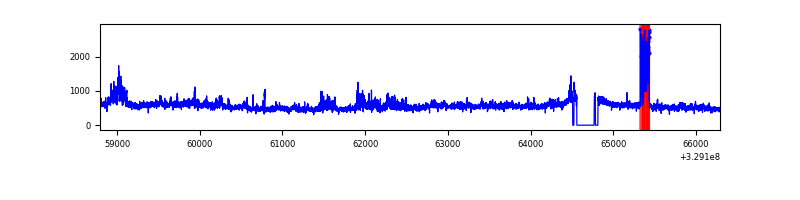 |
| B | 7495 | 7243 | 0 | 0 | 0.00% | 0.00% | 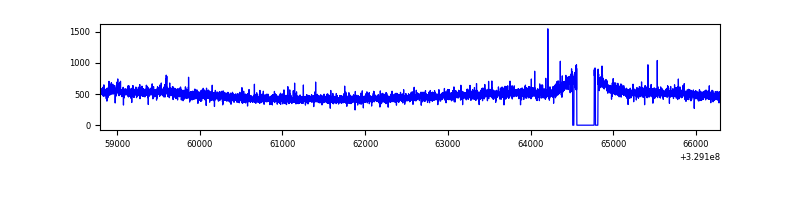 |
| C | 7495 | 7242 | 0 | 0 | 0.00% | 0.00% | 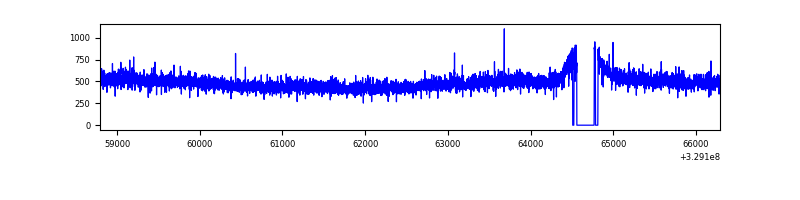 |
| D | 7495 | 7242 | 20 | 20 | 0.27% | 0.28% | 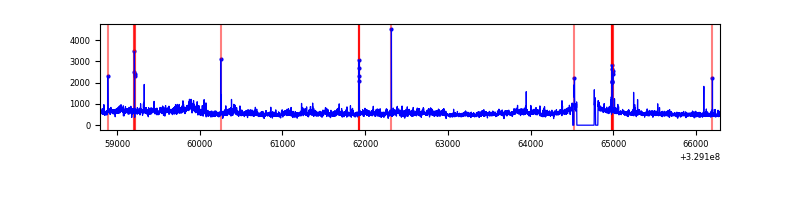 |
Top three noisy pixels from each quadrant. If the there are fewer than three noisy pixels in the level2.evt file, extra rows are filled as -1
| Pixel properties | Quadrant properties | ||||||
|---|---|---|---|---|---|---|---|
| Quadrant | DetID | PixID | Counts | Sigma | Mean | Median | Sigma |
| A | 6 | 16 | 595426 | 3276.39 | 898 | 878 | 181.5 |
| A | 3 | 1 | 162166 | 888.81 | 898 | 878 | 181.5 |
| A | 15 | 173 | 38380 | 206.66 | 898 | 878 | 181.5 |
| B | 0 | 229 | 22963 | 129.37 | 888 | 864 | 170.8 |
| B | 12 | 111 | 20982 | 117.77 | 888 | 864 | 170.8 |
| B | 11 | 111 | 18586 | 103.74 | 888 | 864 | 170.8 |
| C | 14 | 238 | 137922 | 682.38 | 855 | 858 | 200.9 |
| C | 3 | 233 | 32947 | 159.76 | 855 | 858 | 200.9 |
| C | 13 | 61 | 5962 | 25.41 | 855 | 858 | 200.9 |
| D | 8 | 195 | 856816 | 4038.0 | 870 | 842 | 212.0 |
| D | 1 | 52 | 62627 | 291.47 | 870 | 842 | 212.0 |
| D | 2 | 234 | 30780 | 141.23 | 870 | 842 | 212.0 |
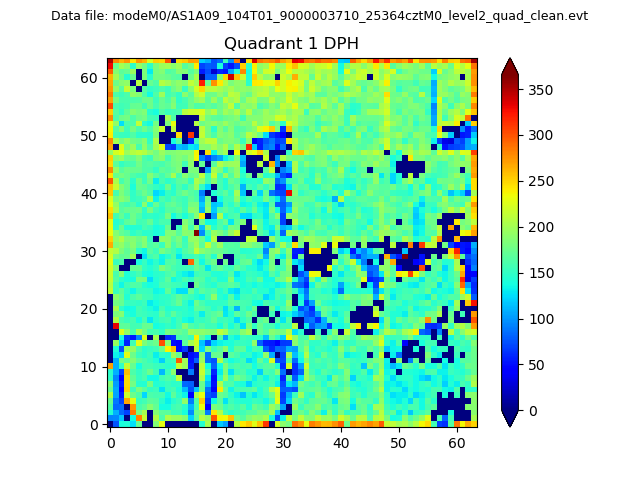
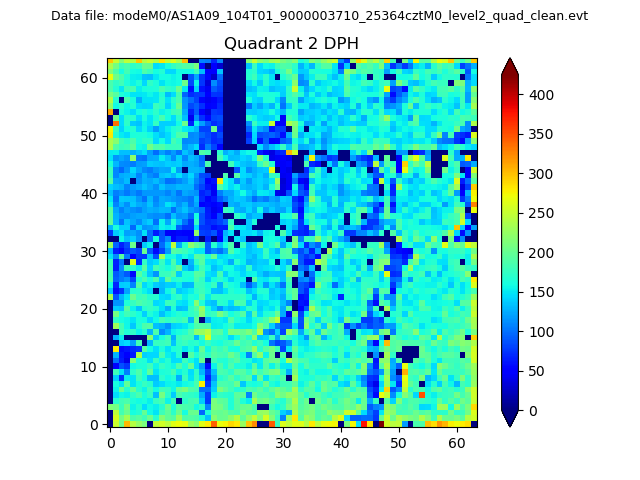
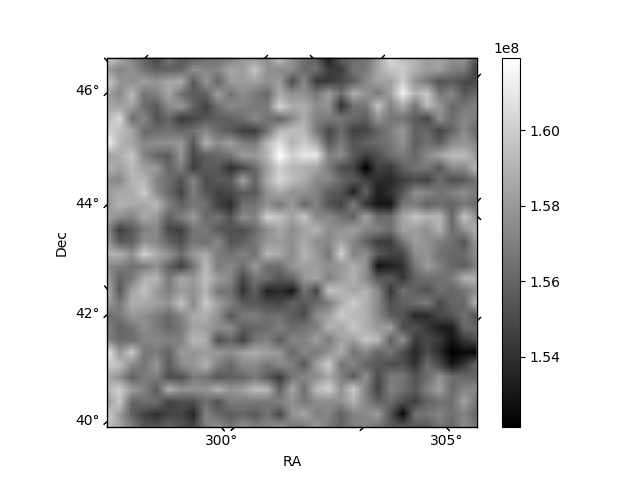
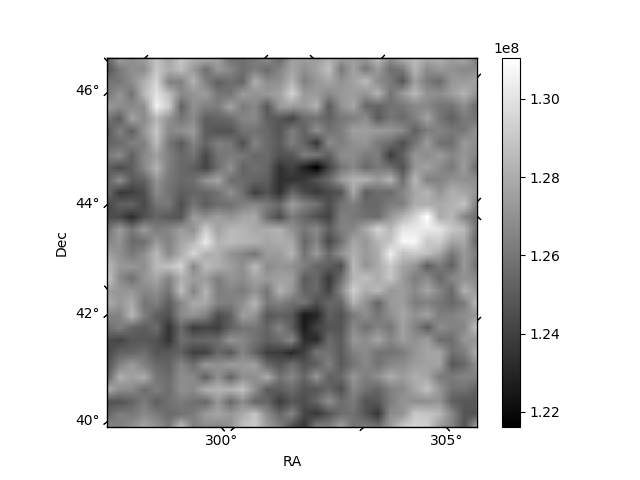
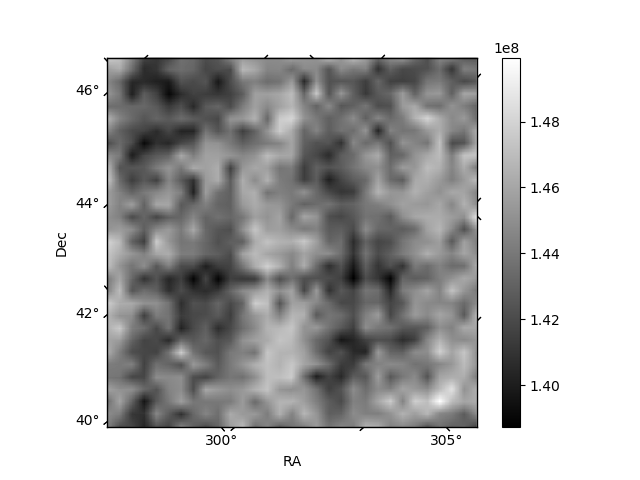
Histogram calculated using DETX and DETY for each event in the final _common_clean file
| Quadrant A |  |
 |
Quadrant B |
|---|---|---|---|
| Quadrant D | 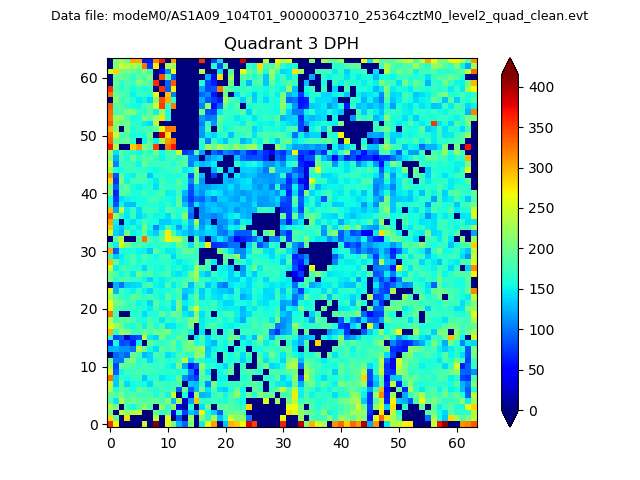 |
 |
Quadrant C |
| Plot type | Count rate plots | Images |
|---|---|---|
| Comparison with Poisson distribution Blue bars denote a histogram of data divided into 1 sec bins. Red curve is a Poisson curve with rate = median count rate of data. |
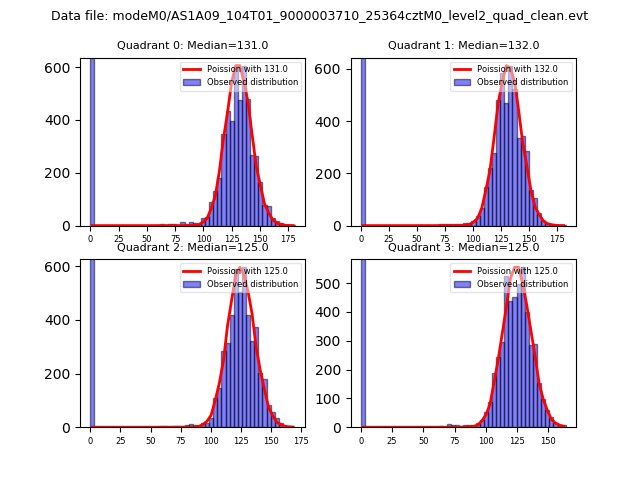 |
 |
| Quadrant-wise count rates Data is divided into 100 sec bins |
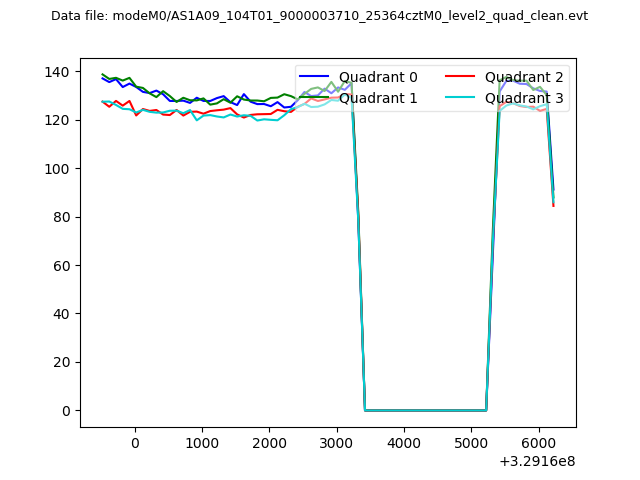 |
|
| Module-wise count rates for Quadrant A Data is divided into 100 sec bins |
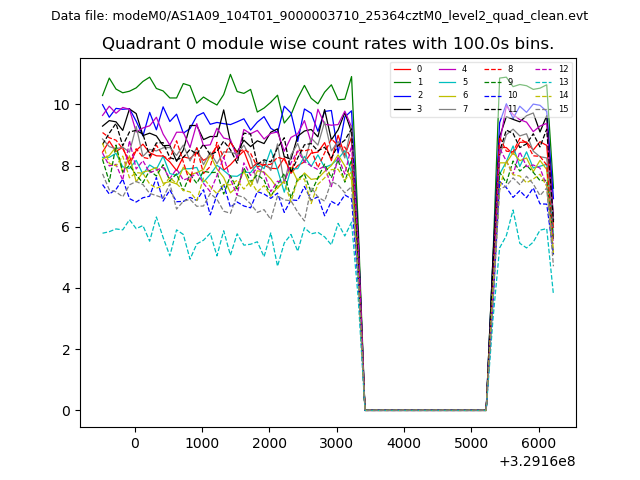 |
 |
| Module-wise count rates for Quadrant B Data is divided into 100 sec bins |
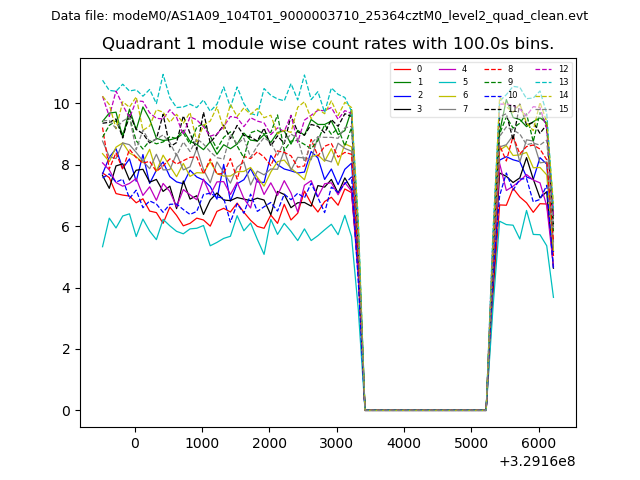 |
 |
| Module-wise count rates for Quadrant C Data is divided into 100 sec bins |
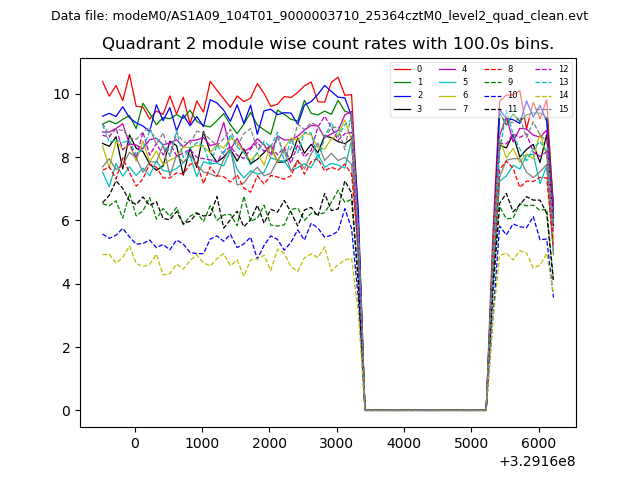 |
 |
| Module-wise count rates for Quadrant D Data is divided into 100 sec bins |
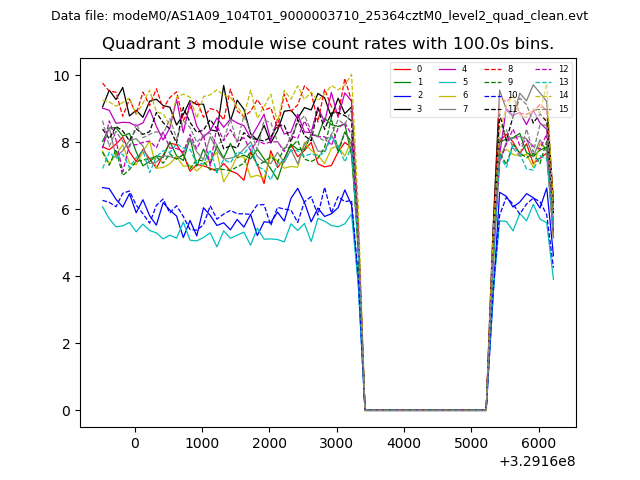 |
 |
| Parameter | Plot |
|---|---|
| CZT HV Monitor | 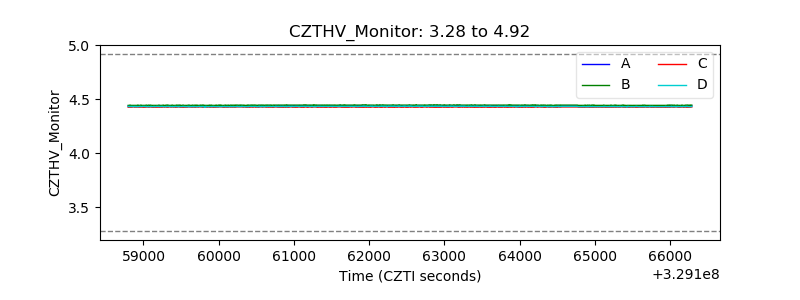 |
| D_VDD | 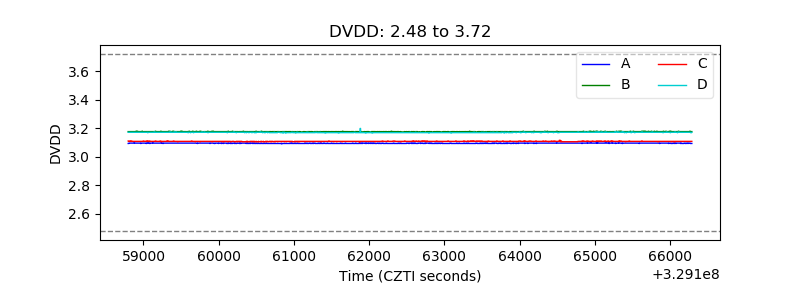 |
| Temperature 1 | 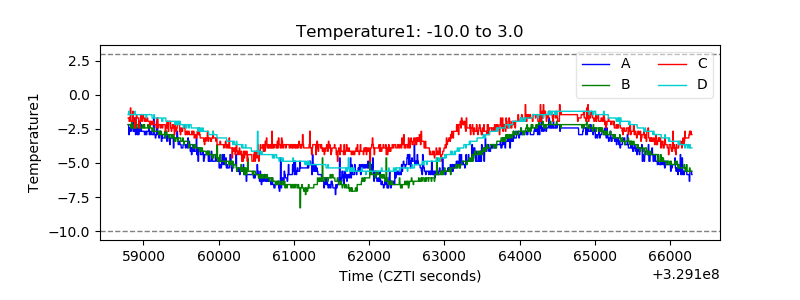 |
| Veto HV Monitor | 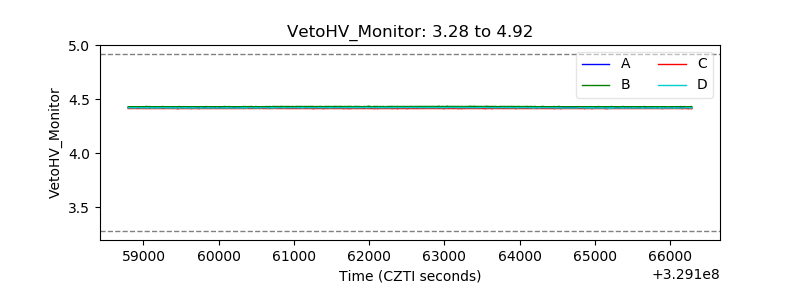 |
| Veto LLD | 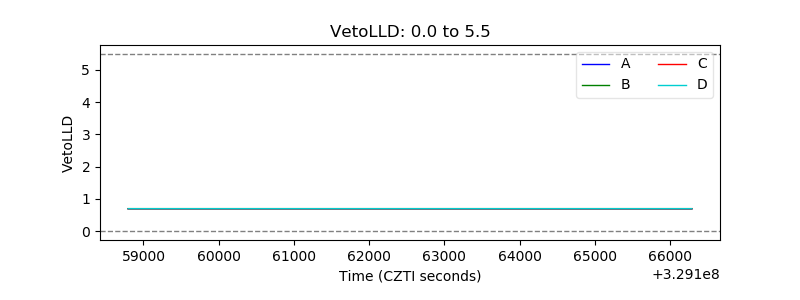 |
| Alpha Counter | 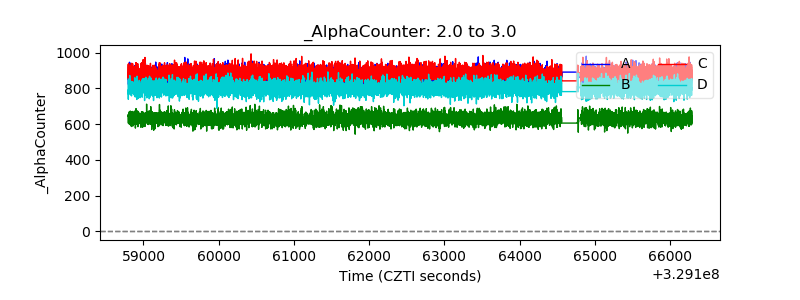 |
| _CPM_Rate | 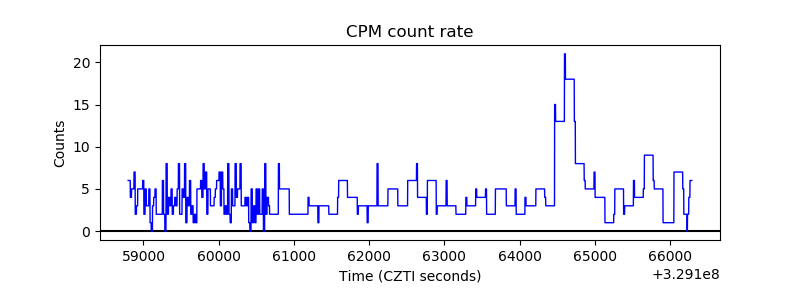 |
| CZT Counter | 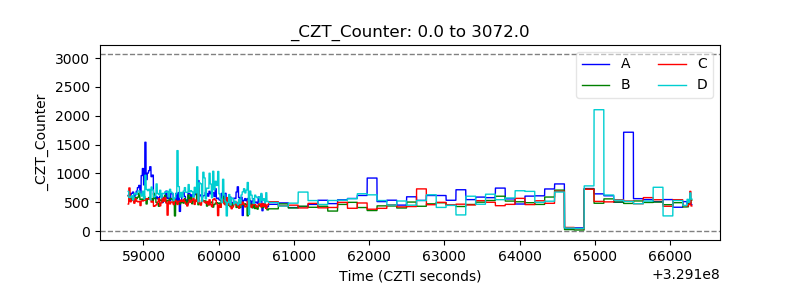 |
| +2.5 Volts monitor |  |
| +5 Volts monitor |  |
| _ROLL_ROT | 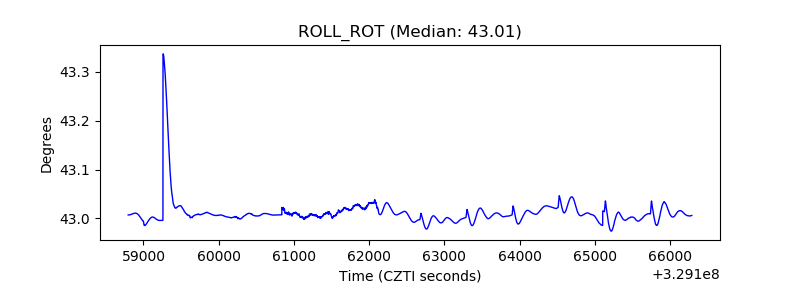 |
| _Roll_DEC | 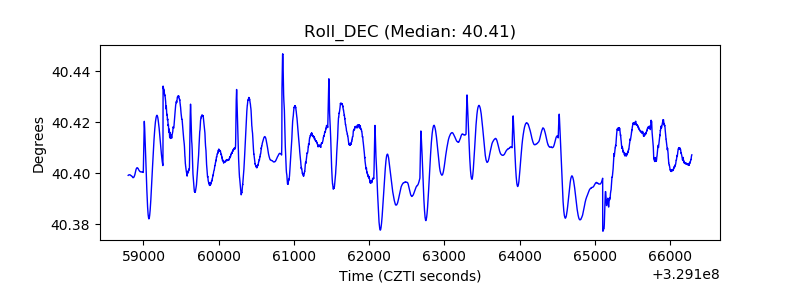 |
| _Roll_RA | 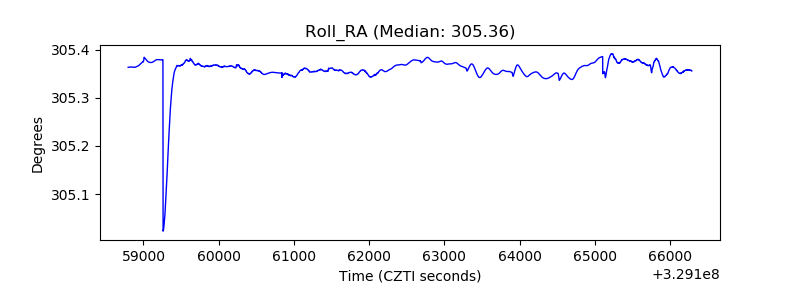 |
| Veto Counter | 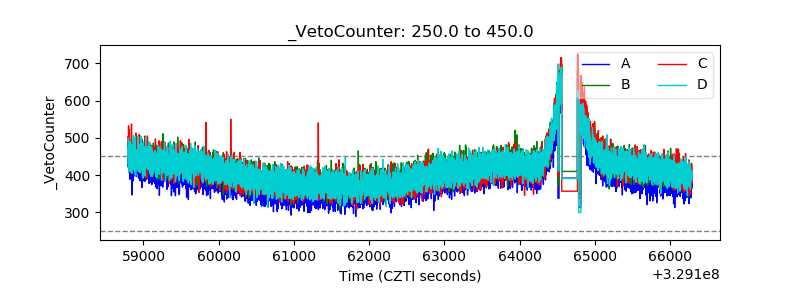 |