| Param | Original file | Final file |
|---|---|---|
| Filename | modeM0/AS1A09_104T01_9000003710_25365cztM0_level2.evt | modeM0/AS1A09_104T01_9000003710_25365cztM0_level2_quad_clean.evt |
| Size (bytes) | 553,628,160 | 105,134,400 |
| Size | 528.0 MB | 100.3 MB |
| Events in quadrant A | 4,049,509 | 676,303 |
| Events in quadrant B | 3,835,517 | 678,594 |
| Events in quadrant C | 3,853,359 | 646,334 |
| Events in quadrant D | 4,501,831 | 643,424 |
| Mode M9 | |||
|---|---|---|---|
| Quadrant | BADHDUFLAG | Total packets | Discarded packets |
| A | 0 | 4 | 0 |
| B | 0 | 4 | 0 |
| C | 0 | 4 | 0 |
| D | 0 | 4 | 0 |
| Mode M0 | |||
|---|---|---|---|
| Quadrant | BADHDUFLAG | Total packets | Discarded packets |
| A | 0 | 16919 | 0 |
| B | 0 | 16367 | 0 |
| C | 0 | 16380 | 0 |
| D | 0 | 18748 | 0 |
| Quadrant | Total seconds | Saturated seconds | Saturation percentage |
|---|---|---|---|
| A | 7746 | 148 | 1.910664% |
| B | 7746 | 162 | 2.091402% |
| C | 7747 | 238 | 3.072157% |
| D | 7747 | 147 | 1.897509% |
Noise dominated data is calculated using 1-second bins in cleaned event files. If a bin has >2000 counts, and if more than 50% of those come from <1% of pixels, then it is considered to be noise-dominated and hence unusable.
| Quadrant | # 1 sec bins | Bins with >0 counts | Bins with >2000 counts | High rate bins dominated by noise | Noise dominated (total time) | Noise dominated (detector-on time) | Marked lightcurve |
|---|---|---|---|---|---|---|---|
| A | 8236 | 7748 | 27 | 27 | 0.33% | 0.35% | 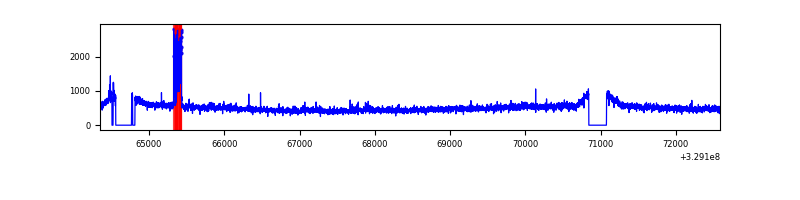 |
| B | 8236 | 7750 | 1 | 1 | 0.01% | 0.01% | 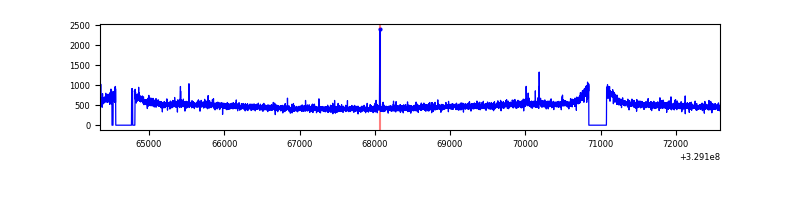 |
| C | 8237 | 7749 | 0 | 0 | 0.00% | 0.00% | 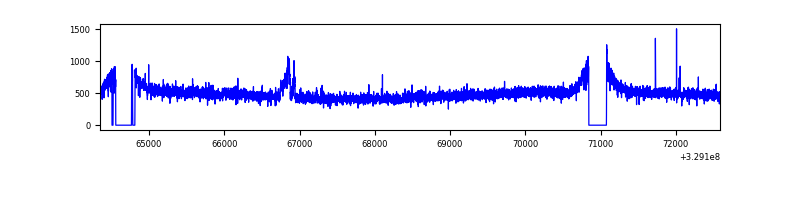 |
| D | 8237 | 7750 | 15 | 15 | 0.18% | 0.19% | 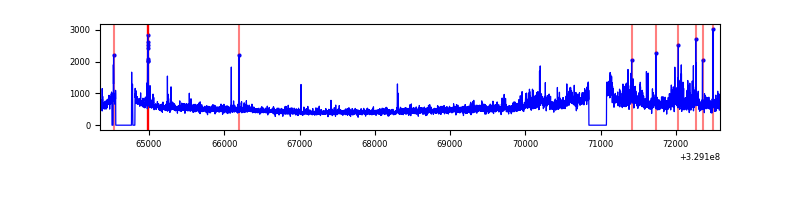 |
Top three noisy pixels from each quadrant. If the there are fewer than three noisy pixels in the level2.evt file, extra rows are filled as -1
| Pixel properties | Quadrant properties | ||||||
|---|---|---|---|---|---|---|---|
| Quadrant | DetID | PixID | Counts | Sigma | Mean | Median | Sigma |
| A | 3 | 1 | 145662 | 733.67 | 974 | 953 | 197.2 |
| A | 6 | 16 | 91366 | 458.39 | 974 | 953 | 197.2 |
| A | 15 | 173 | 55796 | 278.05 | 974 | 953 | 197.2 |
| B | 12 | 111 | 23271 | 121.0 | 966 | 941 | 184.5 |
| B | 11 | 111 | 20634 | 106.71 | 966 | 941 | 184.5 |
| B | 14 | 111 | 18255 | 93.82 | 966 | 941 | 184.5 |
| C | 14 | 238 | 146316 | 658.18 | 933 | 935 | 220.9 |
| C | 9 | 54 | 53556 | 238.23 | 933 | 935 | 220.9 |
| C | 3 | 233 | 15565 | 66.23 | 933 | 935 | 220.9 |
| D | 8 | 195 | 672701 | 2944.79 | 945 | 916 | 228.1 |
| D | 1 | 52 | 140663 | 612.58 | 945 | 916 | 228.1 |
| D | 12 | 233 | 49534 | 213.12 | 945 | 916 | 228.1 |
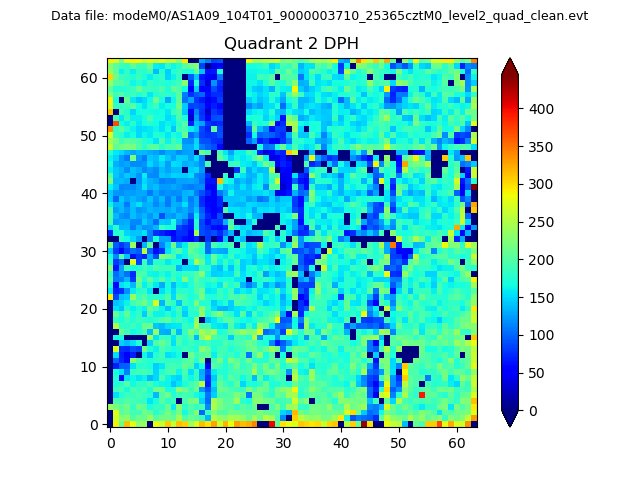
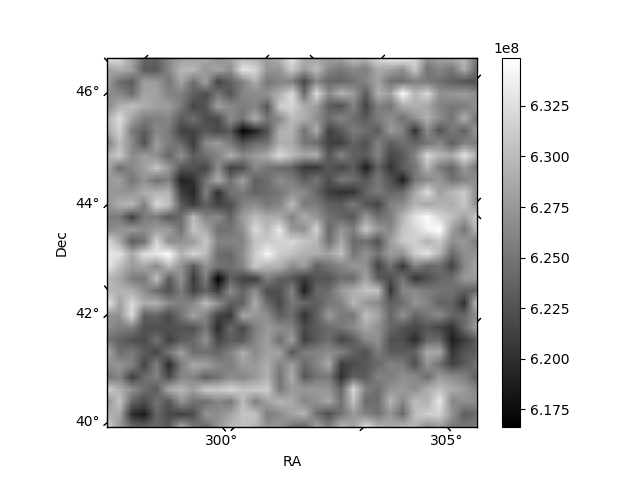
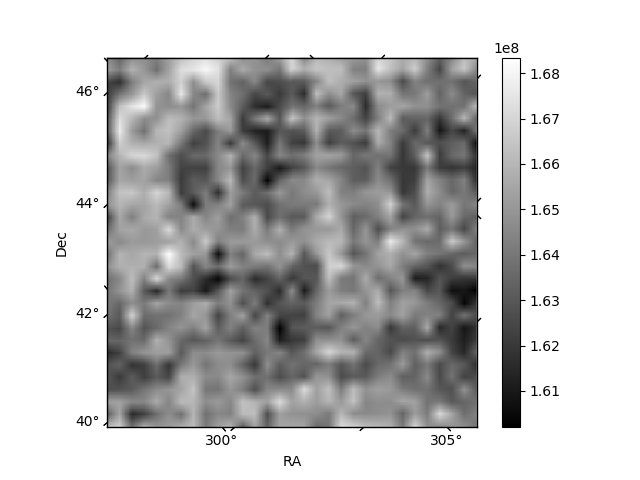
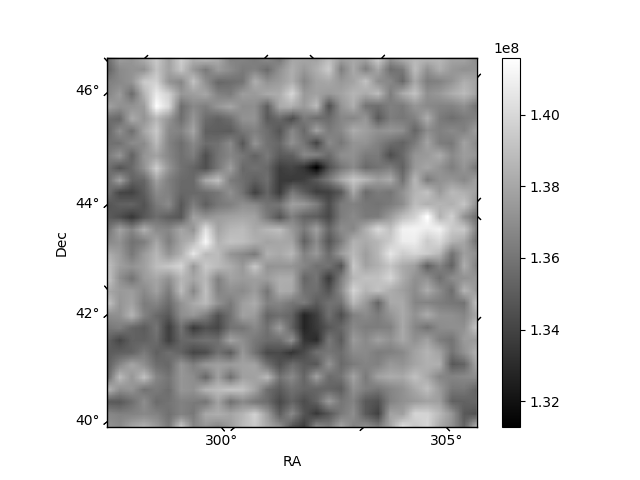
Histogram calculated using DETX and DETY for each event in the final _common_clean file
| Quadrant A | 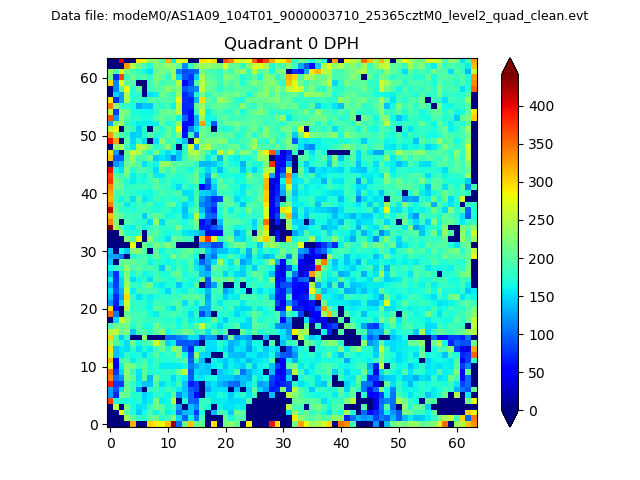 |
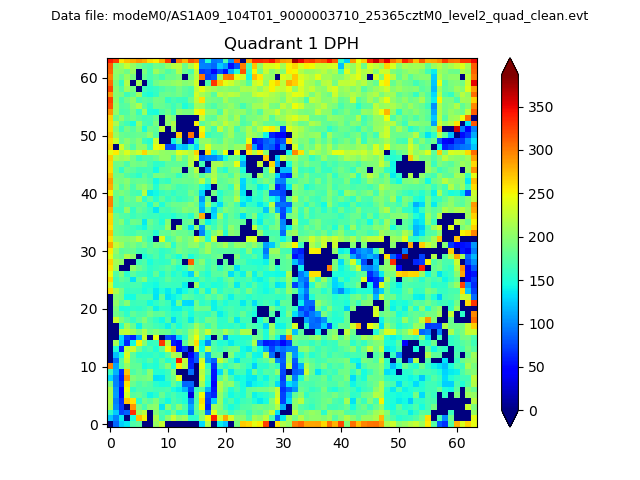 |
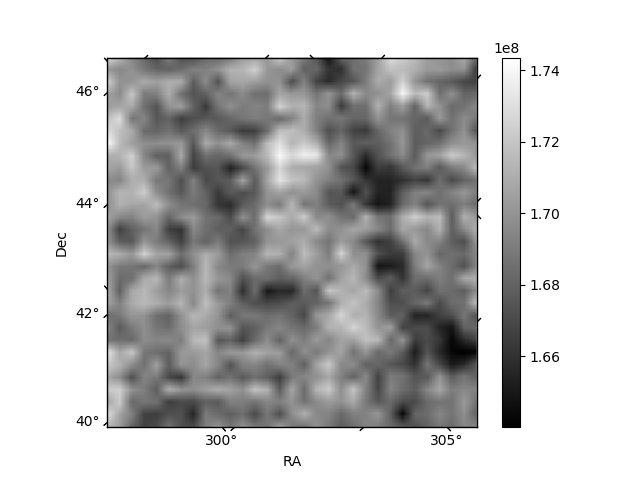
Quadrant B |
|---|---|---|---|
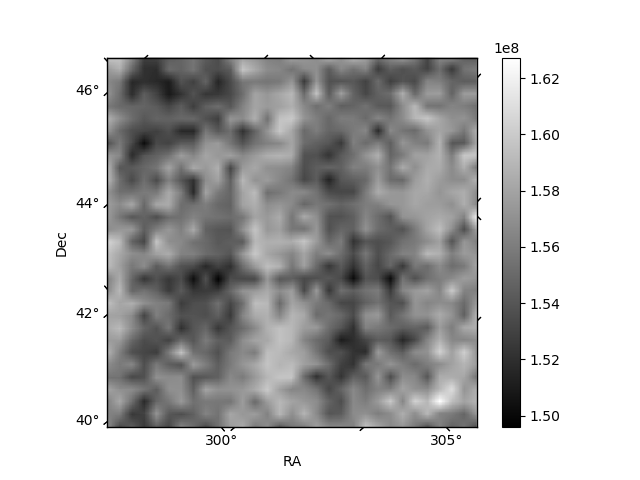
| Quadrant D | 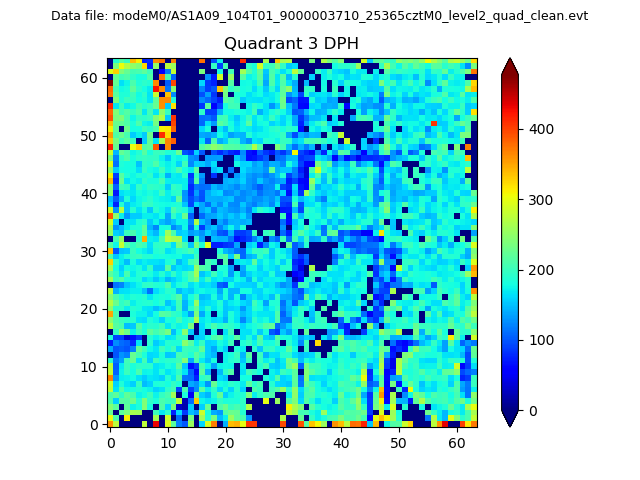 |
 |
Quadrant C |
| Plot type | Count rate plots | Images |
|---|---|---|
| Comparison with Poisson distribution Blue bars denote a histogram of data divided into 1 sec bins. Red curve is a Poisson curve with rate = median count rate of data. |
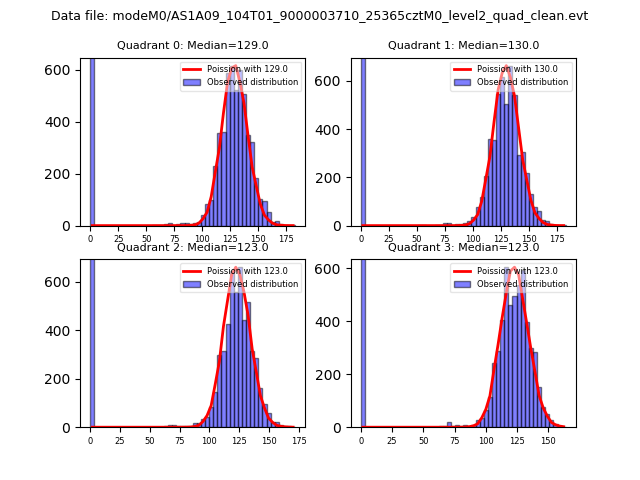 |
 |
| Quadrant-wise count rates Data is divided into 100 sec bins |
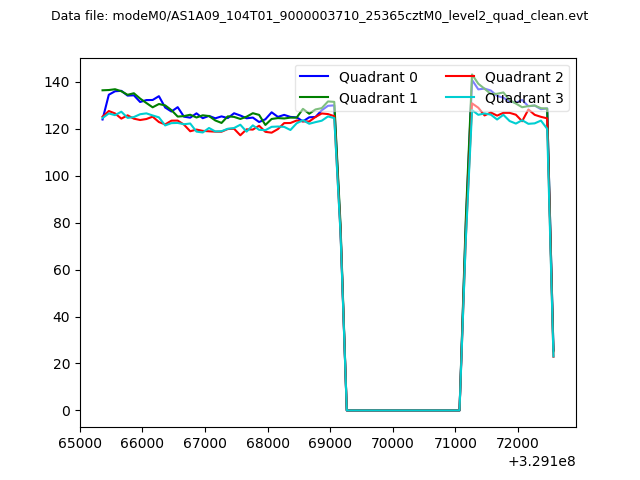 |
|
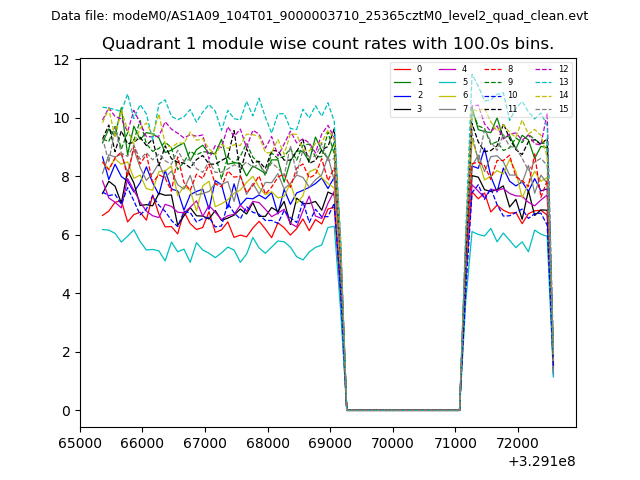
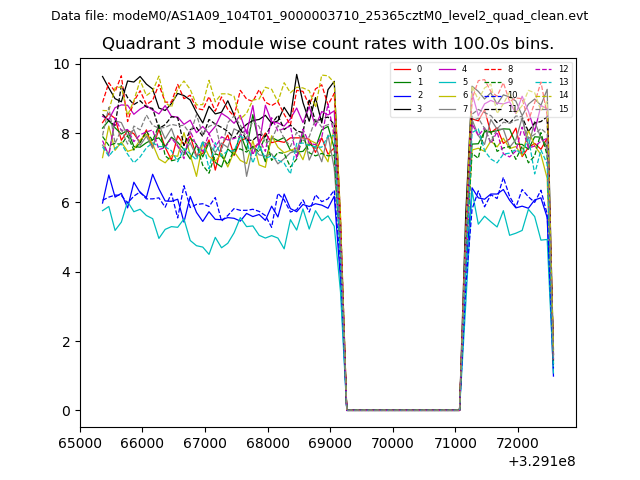
| Module-wise count rates for Quadrant A Data is divided into 100 sec bins |
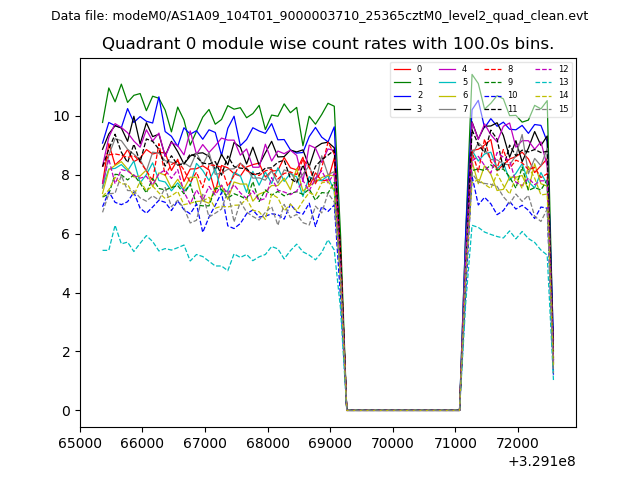 |
 |
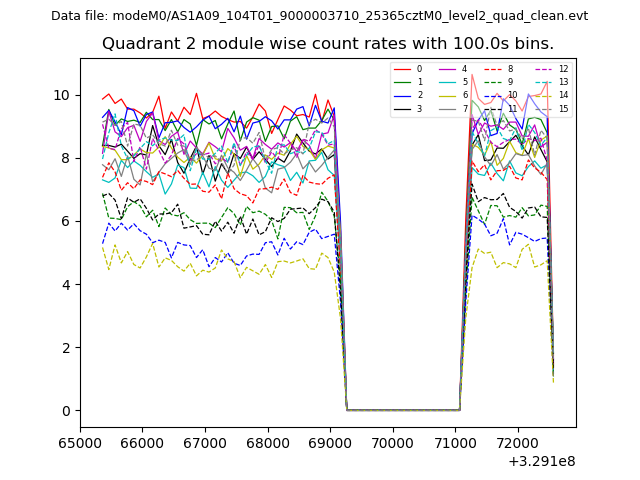
| Module-wise count rates for Quadrant B Data is divided into 100 sec bins |
 |
 |
| Module-wise count rates for Quadrant C Data is divided into 100 sec bins |
 |
 |
| Module-wise count rates for Quadrant D Data is divided into 100 sec bins |
 |
 |
| Parameter | Plot |
|---|---|
| CZT HV Monitor | 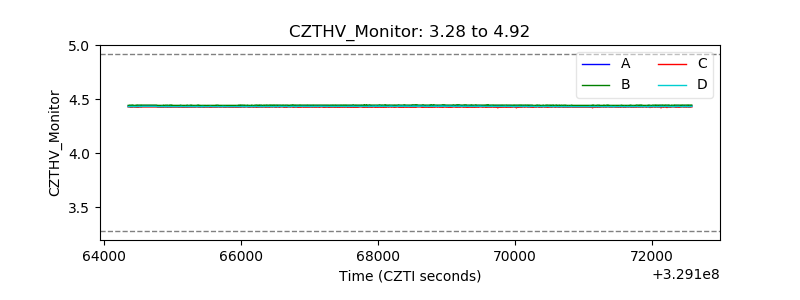 |
| D_VDD | 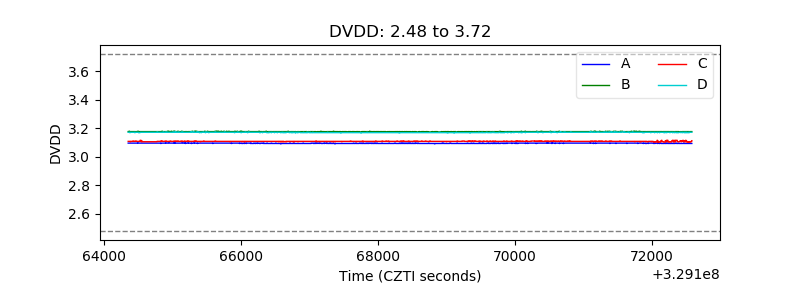 |
| Temperature 1 | 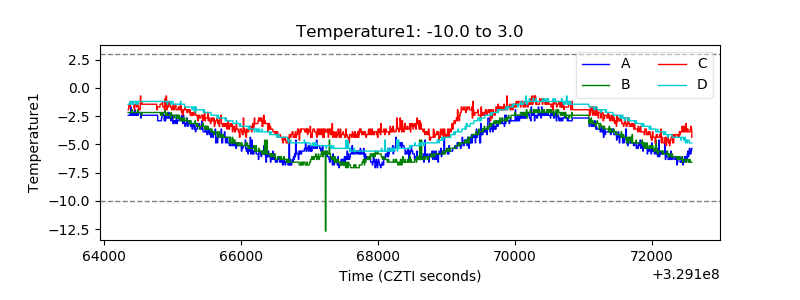 |
| Veto HV Monitor | 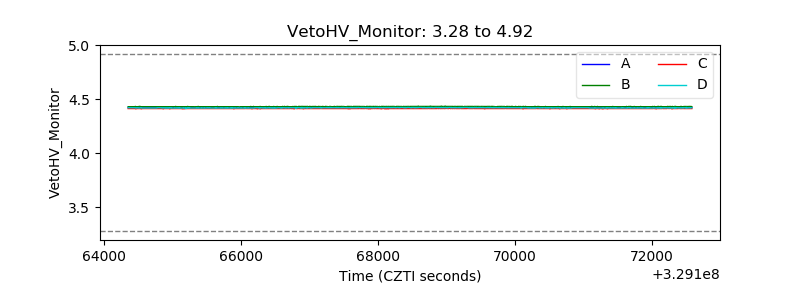 |
| Veto LLD | 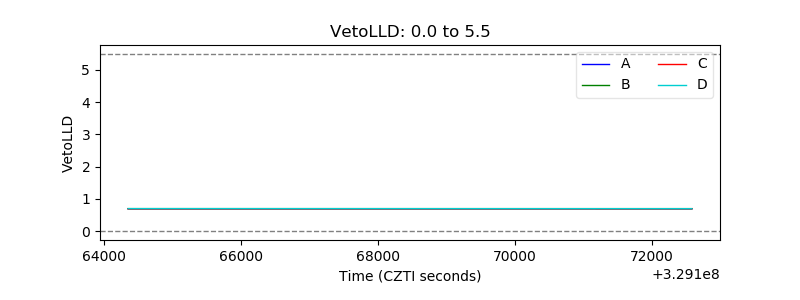 |
| Alpha Counter | 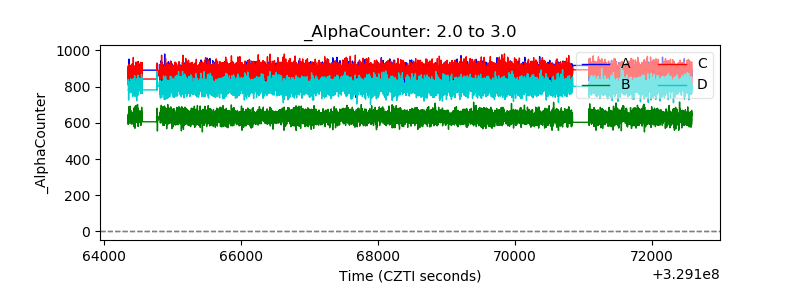 |
| _CPM_Rate | 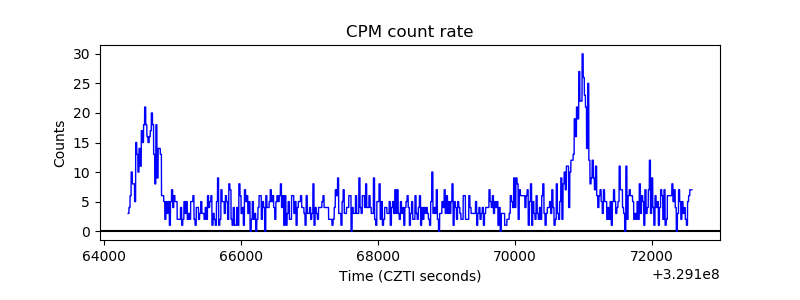 |
| CZT Counter | 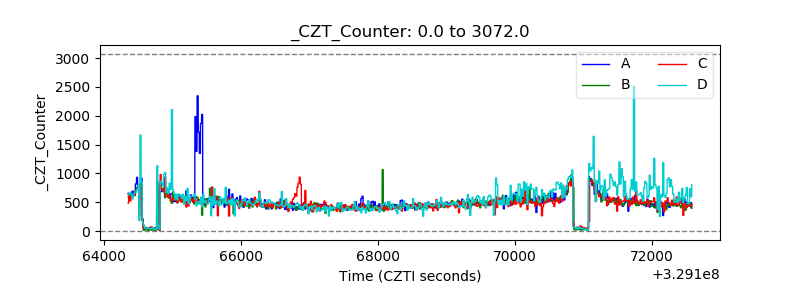 |
| +2.5 Volts monitor |  |
| +5 Volts monitor | 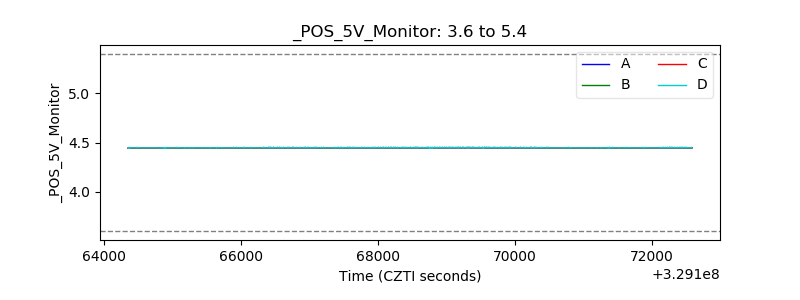 |
| _ROLL_ROT | 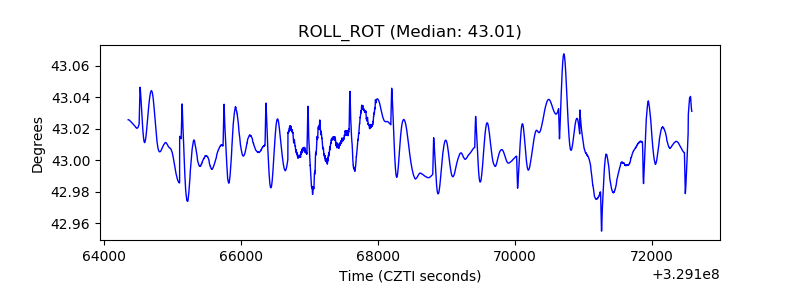 |
| _Roll_DEC | 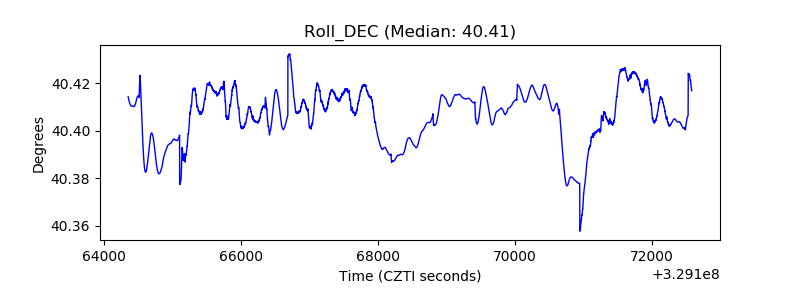 |
| _Roll_RA | 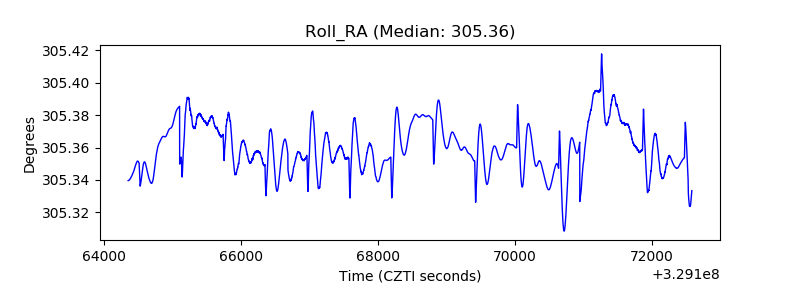 |
| Veto Counter | 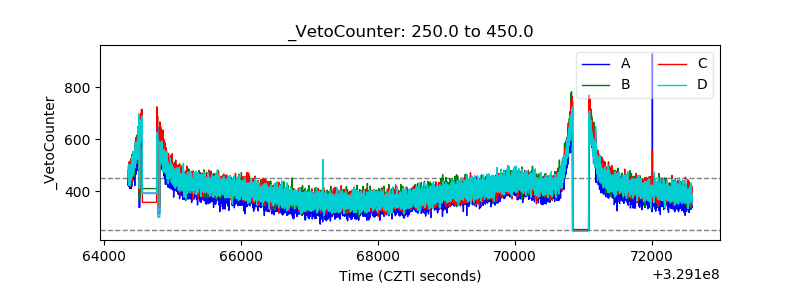 |