| Param | Original file | Final file |
|---|---|---|
| Filename | modeM0/AS1A09_104T01_9000003710_25368cztM0_level2.evt | modeM0/AS1A09_104T01_9000003710_25368cztM0_level2_quad_clean.evt |
| Size (bytes) | 1,374,264,000 | 251,294,400 |
| Size | 1.3 GB | 239.7 MB |
| Events in quadrant A | 9,337,805 | 1,603,164 |
| Events in quadrant B | 9,303,310 | 1,616,369 |
| Events in quadrant C | 9,376,936 | 1,544,665 |
| Events in quadrant D | 12,301,590 | 1,521,464 |
| Mode M9 | |||
|---|---|---|---|
| Quadrant | BADHDUFLAG | Total packets | Discarded packets |
| A | 0 | 20 | 0 |
| B | 0 | 20 | 0 |
| C | 0 | 20 | 0 |
| D | 0 | 20 | 0 |
| Mode M0 | |||
|---|---|---|---|
| Quadrant | BADHDUFLAG | Total packets | Discarded packets |
| A | 0 | 40197 | 0 |
| B | 0 | 40317 | 0 |
| C | 0 | 40260 | 0 |
| D | 0 | 49934 | 0 |
| Quadrant | Total seconds | Saturated seconds | Saturation percentage |
|---|---|---|---|
| A | 19239 | 110 | 0.571755% |
| B | 19240 | 197 | 1.023909% |
| C | 19240 | 313 | 1.626819% |
| D | 19240 | 369 | 1.917879% |
Noise dominated data is calculated using 1-second bins in cleaned event files. If a bin has >2000 counts, and if more than 50% of those come from <1% of pixels, then it is considered to be noise-dominated and hence unusable.
| Quadrant | # 1 sec bins | Bins with >0 counts | Bins with >2000 counts | High rate bins dominated by noise | Noise dominated (total time) | Noise dominated (detector-on time) | Marked lightcurve |
|---|---|---|---|---|---|---|---|
| A | 21334 | 19243 | 0 | 0 | 0.00% | 0.00% | 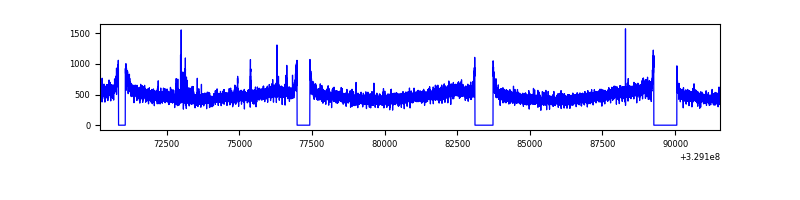 |
| B | 21335 | 19244 | 0 | 0 | 0.00% | 0.00% | 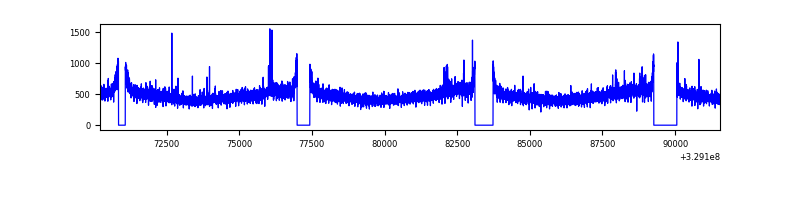 |
| C | 21335 | 19243 | 5 | 5 | 0.02% | 0.03% |  |
| D | 21335 | 19244 | 156 | 156 | 0.73% | 0.81% |  |
Top three noisy pixels from each quadrant. If the there are fewer than three noisy pixels in the level2.evt file, extra rows are filled as -1
| Pixel properties | Quadrant properties | ||||||
|---|---|---|---|---|---|---|---|
| Quadrant | DetID | PixID | Counts | Sigma | Mean | Median | Sigma |
| A | 6 | 16 | 154004 | 323.94 | 2340 | 2292 | 468.3 |
| A | 15 | 173 | 145038 | 304.79 | 2340 | 2292 | 468.3 |
| A | 13 | 254 | 30670 | 60.59 | 2340 | 2292 | 468.3 |
| B | 0 | 190 | 75936 | 166.63 | 2322 | 2259 | 442.2 |
| B | 0 | 229 | 61108 | 133.1 | 2322 | 2259 | 442.2 |
| B | 12 | 111 | 56022 | 121.59 | 2322 | 2259 | 442.2 |
| C | 14 | 238 | 355632 | 679.87 | 2232 | 2243 | 519.8 |
| C | 7 | 87 | 222417 | 423.58 | 2232 | 2243 | 519.8 |
| C | 0 | 239 | 50304 | 92.46 | 2232 | 2243 | 519.8 |
| D | 8 | 195 | 2229483 | 4100.86 | 2253 | 2188 | 543.1 |
| D | 1 | 52 | 1075545 | 1976.25 | 2253 | 2188 | 543.1 |
| D | 2 | 244 | 228365 | 416.43 | 2253 | 2188 | 543.1 |
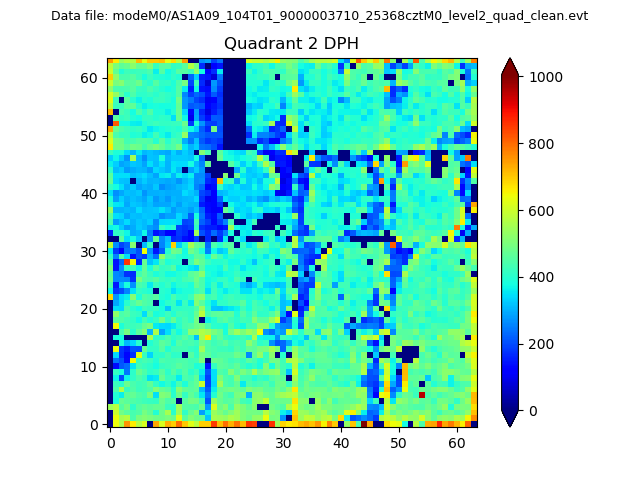
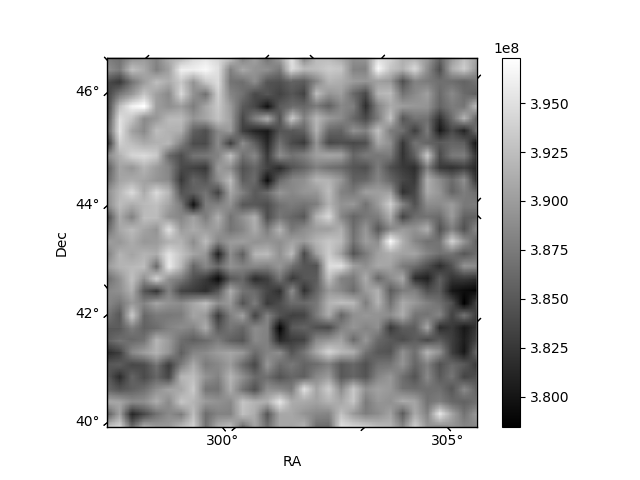
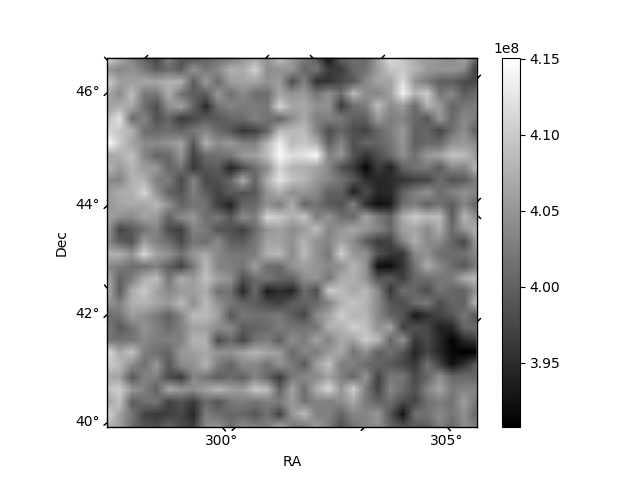
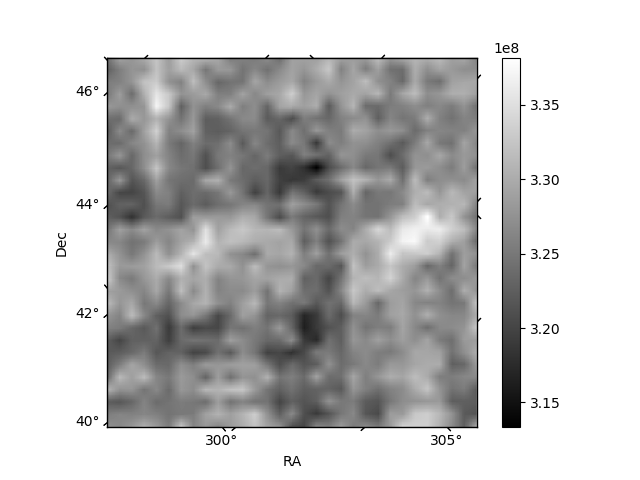
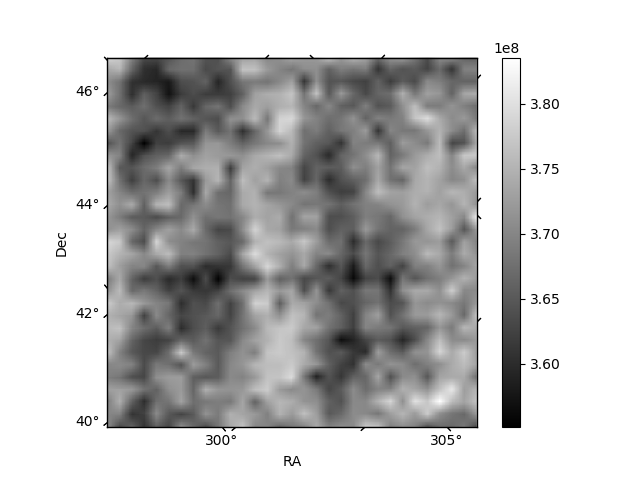
Histogram calculated using DETX and DETY for each event in the final _common_clean file
| Quadrant A | 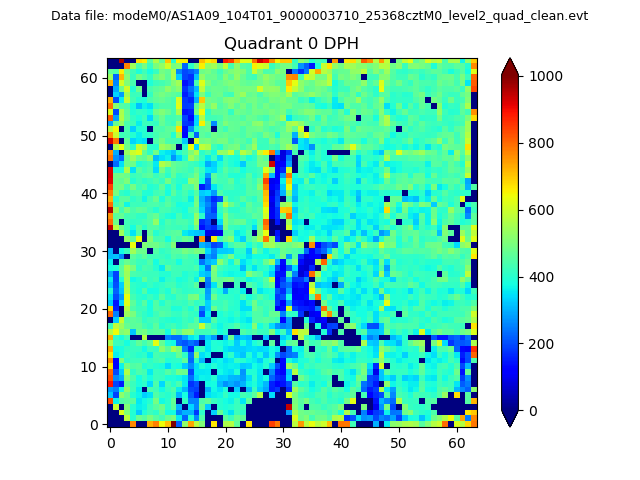 |
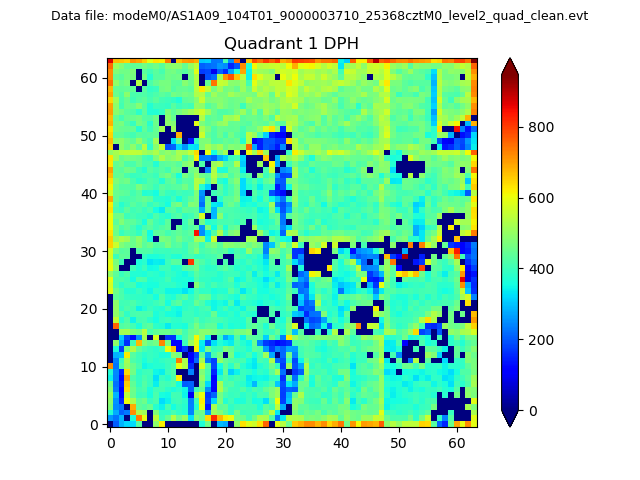 |
Quadrant B |
|---|---|---|---|
| Quadrant D | 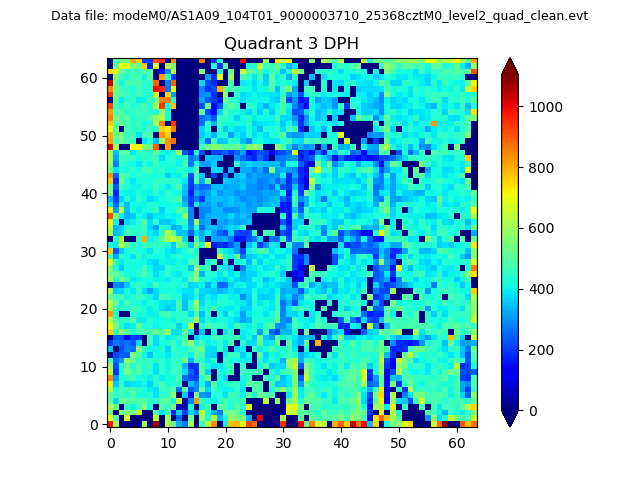 |
 |
Quadrant C |
| Plot type | Count rate plots | Images |
|---|---|---|
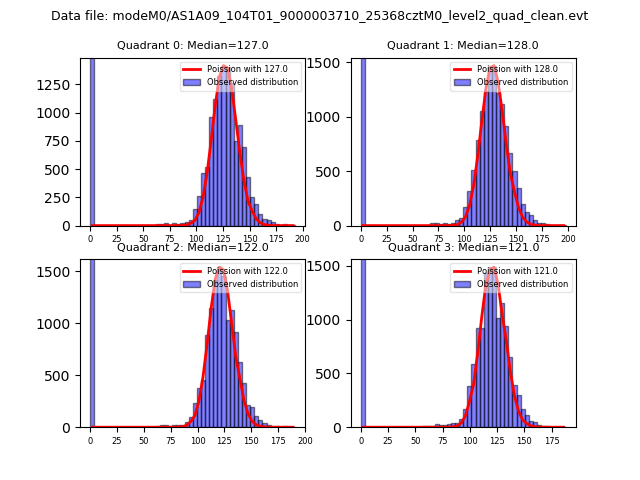
| Comparison with Poisson distribution Blue bars denote a histogram of data divided into 1 sec bins. Red curve is a Poisson curve with rate = median count rate of data. |
 |
 |
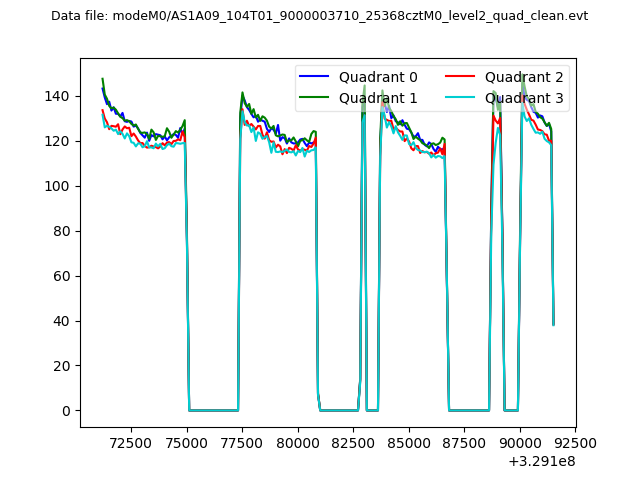
| Quadrant-wise count rates Data is divided into 100 sec bins |
 |
|
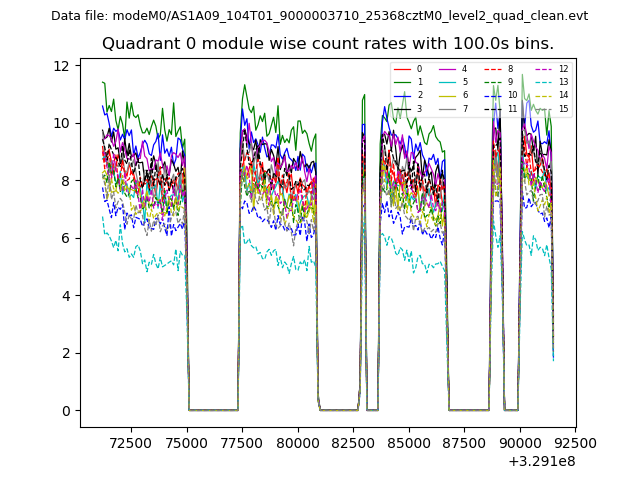
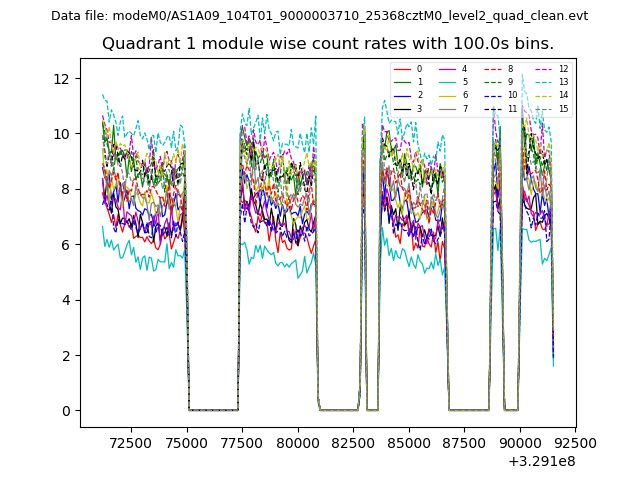
| Module-wise count rates for Quadrant A Data is divided into 100 sec bins |
 |
 |
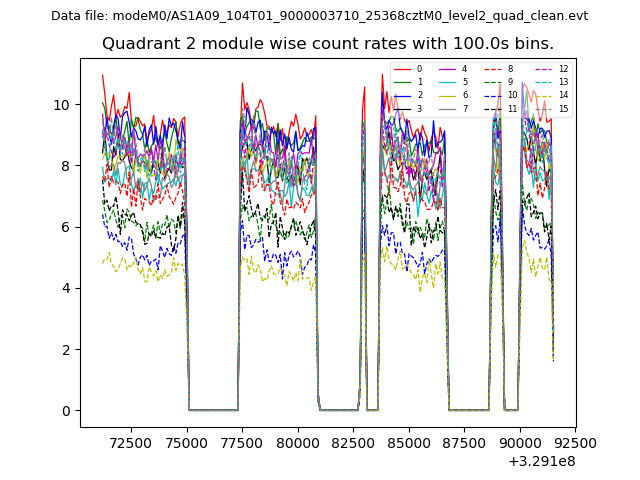
| Module-wise count rates for Quadrant B Data is divided into 100 sec bins |
 |
 |
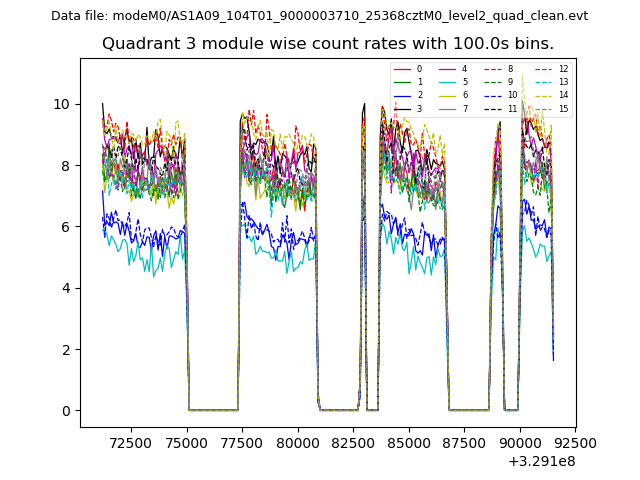
| Module-wise count rates for Quadrant C Data is divided into 100 sec bins |
 |
 |
| Module-wise count rates for Quadrant D Data is divided into 100 sec bins |
 |
 |
| Parameter | Plot |
|---|---|
| CZT HV Monitor | 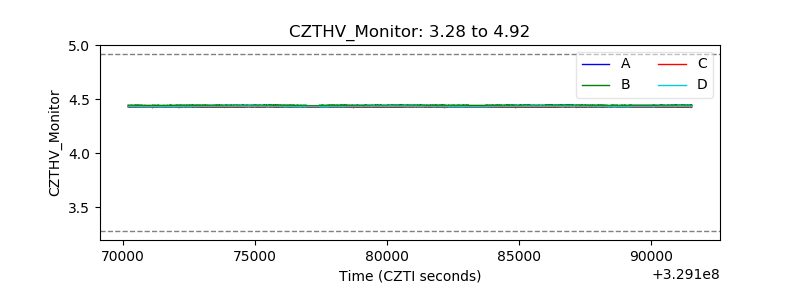 |
| D_VDD | 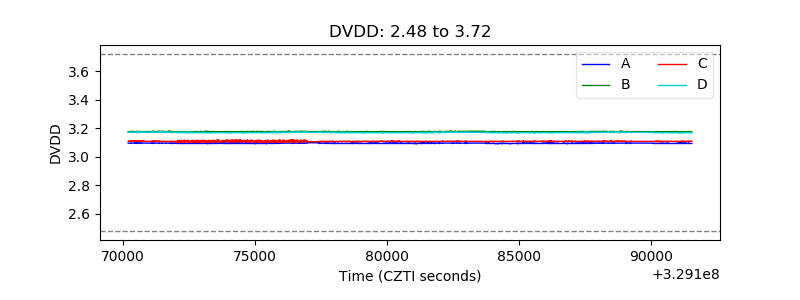 |
| Temperature 1 | 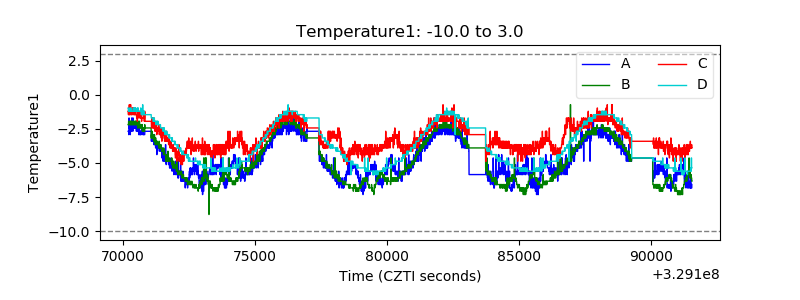 |
| Veto HV Monitor | 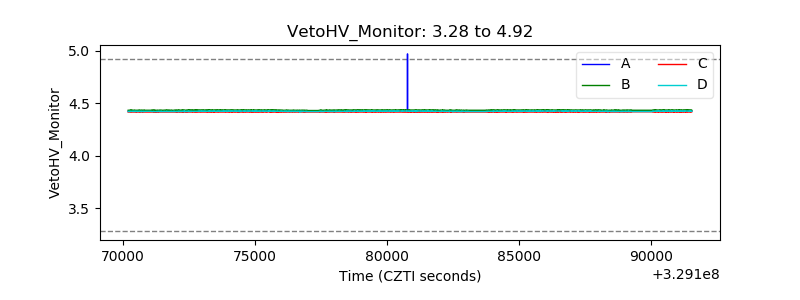 |
| Veto LLD | 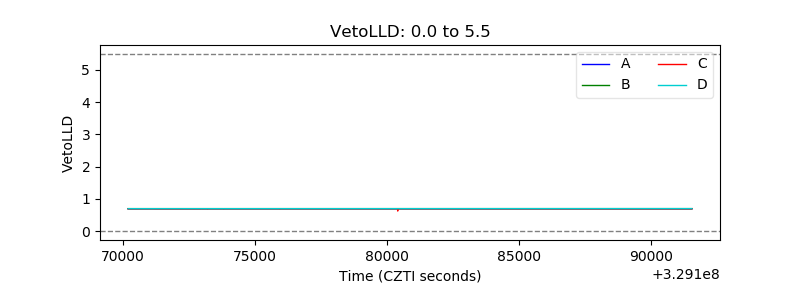 |
| Alpha Counter | 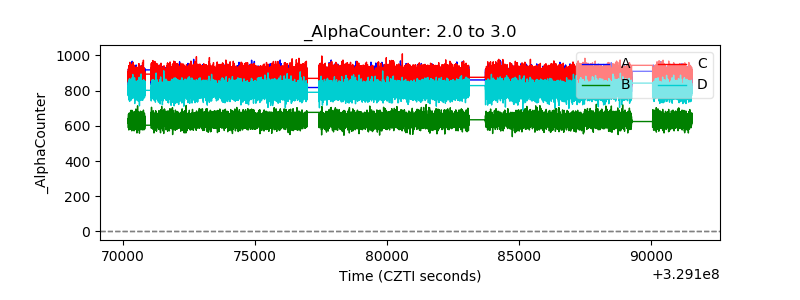 |
| _CPM_Rate | 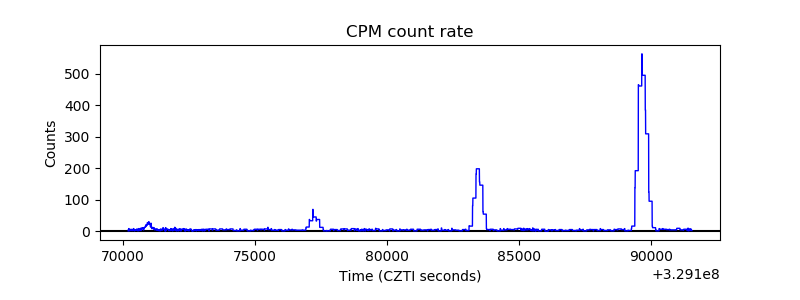 |
| CZT Counter | 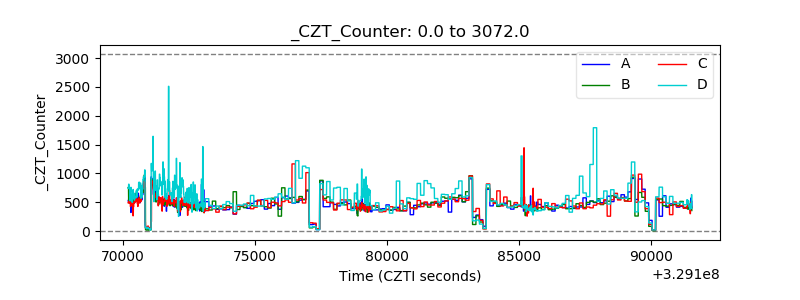 |
| +2.5 Volts monitor |  |
| +5 Volts monitor | 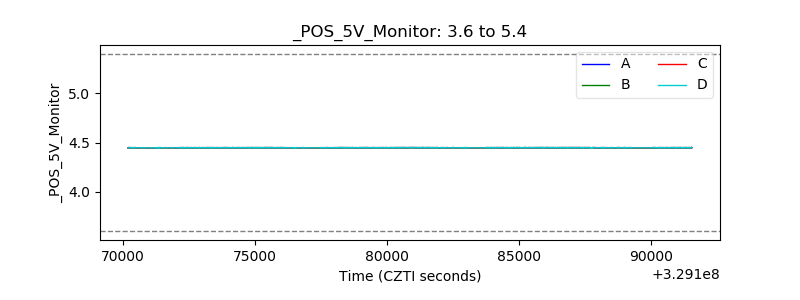 |
| _ROLL_ROT | 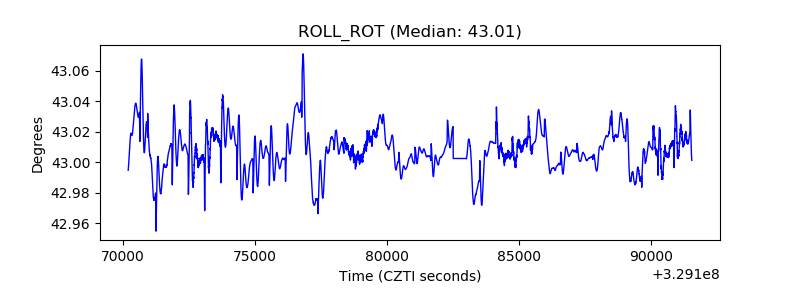 |
| _Roll_DEC | 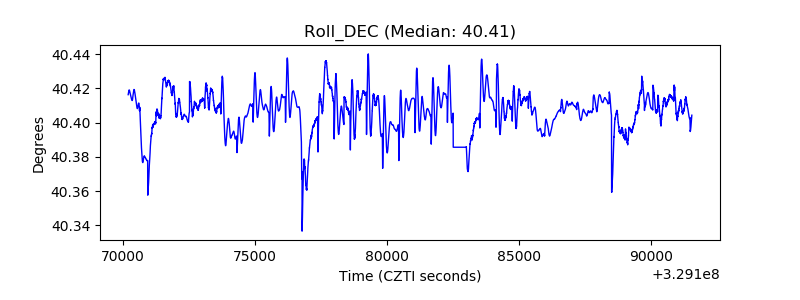 |
| _Roll_RA | 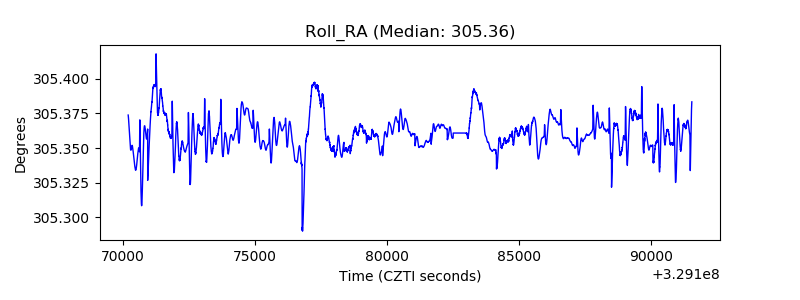 |
| Veto Counter | 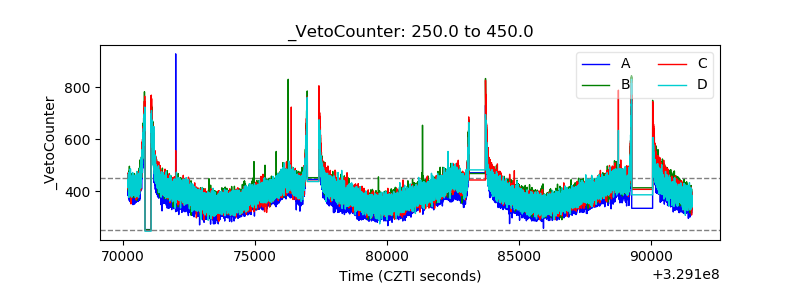 |