| Param | Original file | Final file |
|---|---|---|
| Filename | modeM0/AS1A09_104T01_9000003710_25369cztM0_level2.evt | modeM0/AS1A09_104T01_9000003710_25369cztM0_level2_quad_clean.evt |
| Size (bytes) | 516,375,360 | 104,555,520 |
| Size | 492.5 MB | 99.7 MB |
| Events in quadrant A | 3,644,756 | 683,614 |
| Events in quadrant B | 3,436,167 | 689,918 |
| Events in quadrant C | 3,826,273 | 654,879 |
| Events in quadrant D | 4,250,315 | 644,384 |
| Mode M9 | |||
|---|---|---|---|
| Quadrant | BADHDUFLAG | Total packets | Discarded packets |
| A | 0 | 17 | 0 |
| B | 0 | 17 | 0 |
| C | 0 | 17 | 0 |
| D | 0 | 17 | 0 |
| Mode M0 | |||
|---|---|---|---|
| Quadrant | BADHDUFLAG | Total packets | Discarded packets |
| A | 0 | 15213 | 0 |
| B | 0 | 14713 | 0 |
| C | 0 | 16115 | 0 |
| D | 0 | 17581 | 0 |
| Quadrant | Total seconds | Saturated seconds | Saturation percentage |
|---|---|---|---|
| A | 7088 | 30 | 0.423251% |
| B | 7089 | 60 | 0.846382% |
| C | 7089 | 153 | 2.158273% |
| D | 7089 | 56 | 0.789956% |
Noise dominated data is calculated using 1-second bins in cleaned event files. If a bin has >2000 counts, and if more than 50% of those come from <1% of pixels, then it is considered to be noise-dominated and hence unusable.
| Quadrant | # 1 sec bins | Bins with >0 counts | Bins with >2000 counts | High rate bins dominated by noise | Noise dominated (total time) | Noise dominated (detector-on time) | Marked lightcurve |
|---|---|---|---|---|---|---|---|
| A | 8858 | 7090 | 0 | 0 | 0.00% | 0.00% | 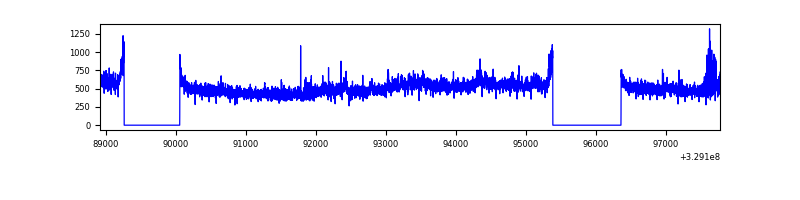 |
| B | 8859 | 7091 | 0 | 0 | 0.00% | 0.00% | 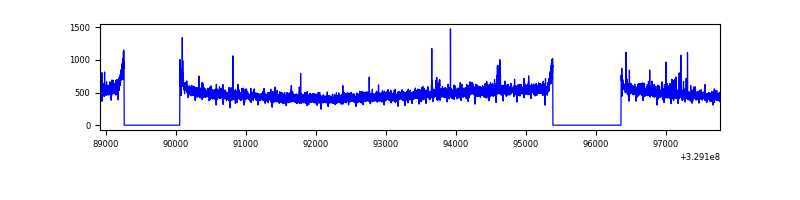 |
| C | 8859 | 7091 | 32 | 32 | 0.36% | 0.45% | 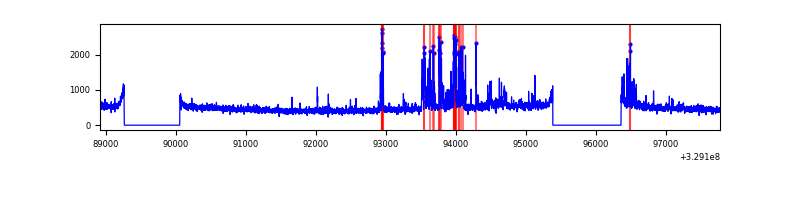 |
| D | 8859 | 7091 | 19 | 19 | 0.21% | 0.27% | 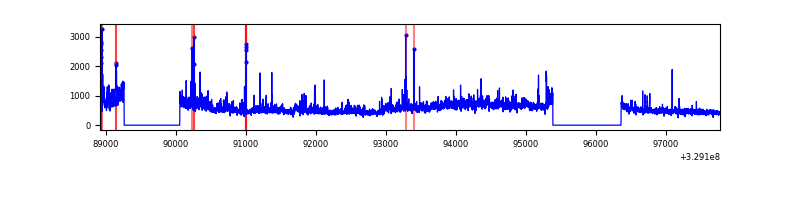 |
Top three noisy pixels from each quadrant. If the there are fewer than three noisy pixels in the level2.evt file, extra rows are filled as -1
| Pixel properties | Quadrant properties | ||||||
|---|---|---|---|---|---|---|---|
| Quadrant | DetID | PixID | Counts | Sigma | Mean | Median | Sigma |
| A | 6 | 16 | 313147 | 1810.49 | 863 | 845 | 172.5 |
| A | 13 | 254 | 11053 | 59.18 | 863 | 845 | 172.5 |
| A | 3 | 137 | 8073 | 41.9 | 863 | 845 | 172.5 |
| B | 3 | 112 | 26579 | 154.56 | 859 | 836 | 166.6 |
| B | 12 | 111 | 20219 | 116.38 | 859 | 836 | 166.6 |
| B | 11 | 111 | 17937 | 102.68 | 859 | 836 | 166.6 |
| C | 7 | 87 | 440376 | 2277.68 | 822 | 825 | 193.0 |
| C | 14 | 238 | 132283 | 681.19 | 822 | 825 | 193.0 |
| C | 3 | 233 | 49860 | 254.09 | 822 | 825 | 193.0 |
| D | 8 | 195 | 719988 | 3561.89 | 830 | 803 | 201.9 |
| D | 1 | 52 | 234989 | 1159.85 | 830 | 803 | 201.9 |
| D | 2 | 244 | 103638 | 509.31 | 830 | 803 | 201.9 |
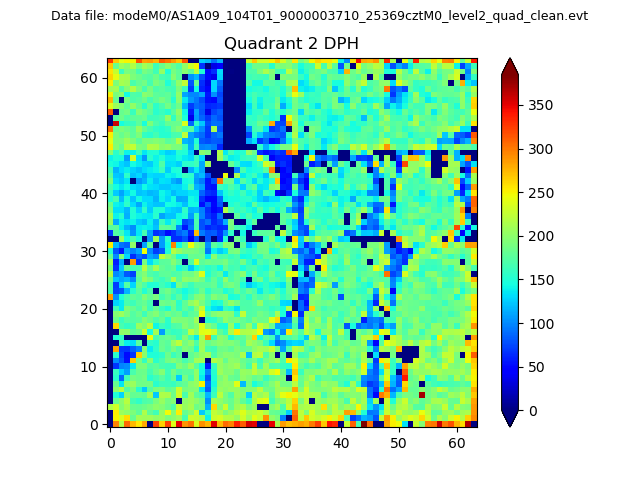
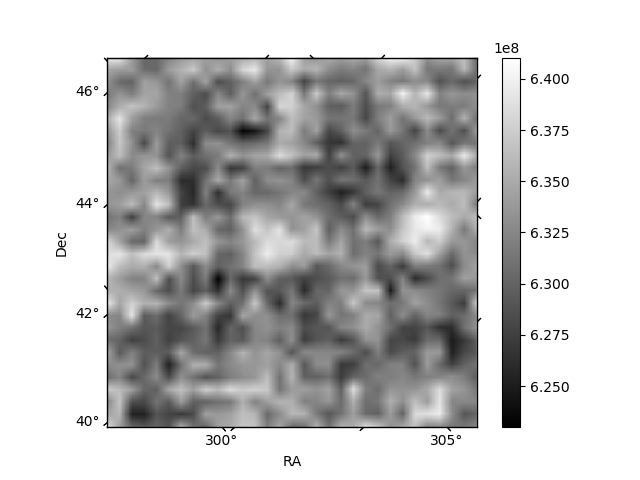
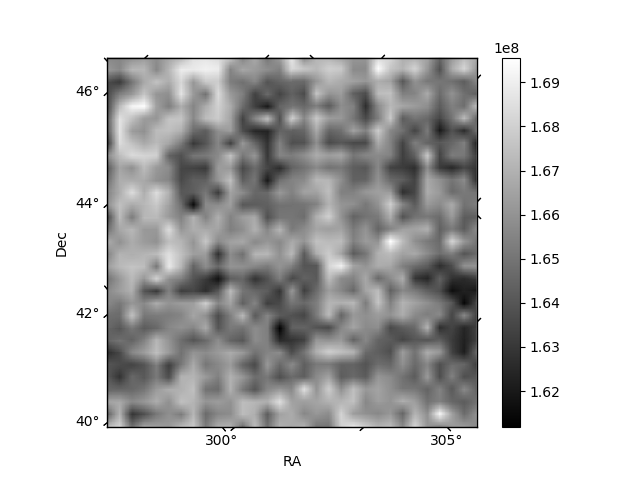
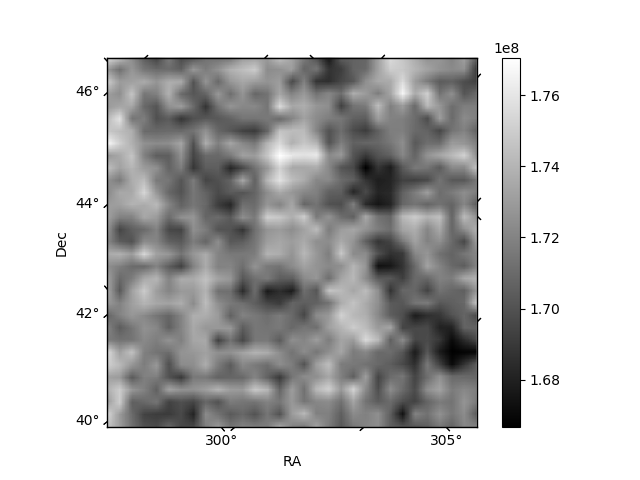
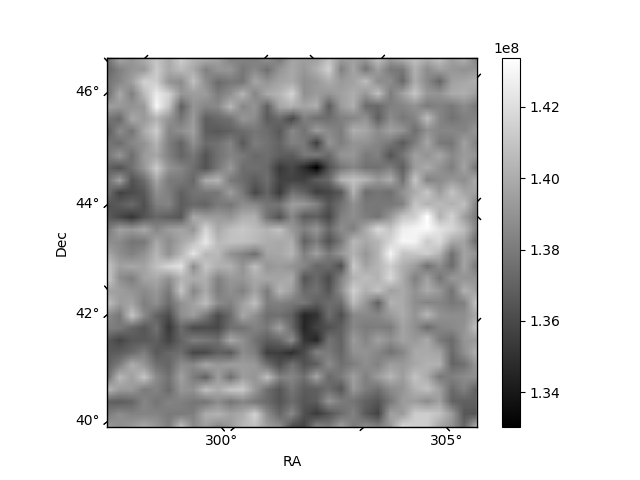
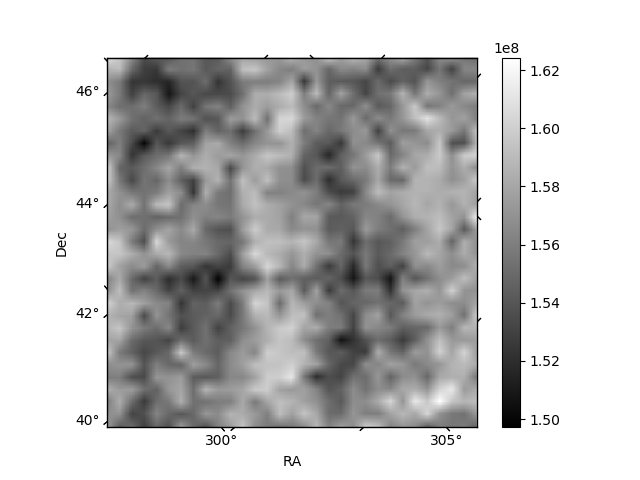
Histogram calculated using DETX and DETY for each event in the final _common_clean file
| Quadrant A | 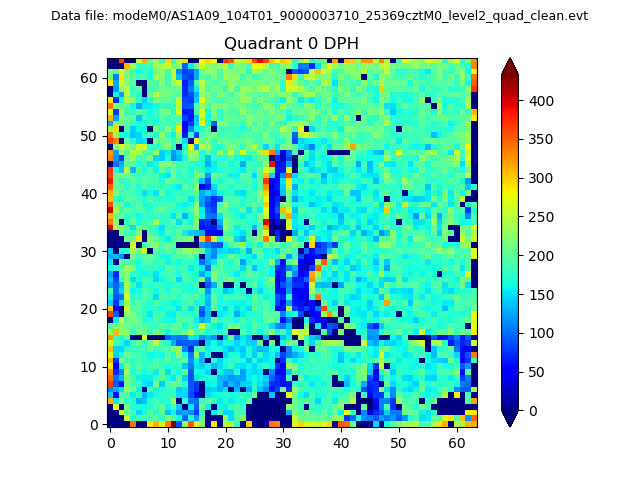 |
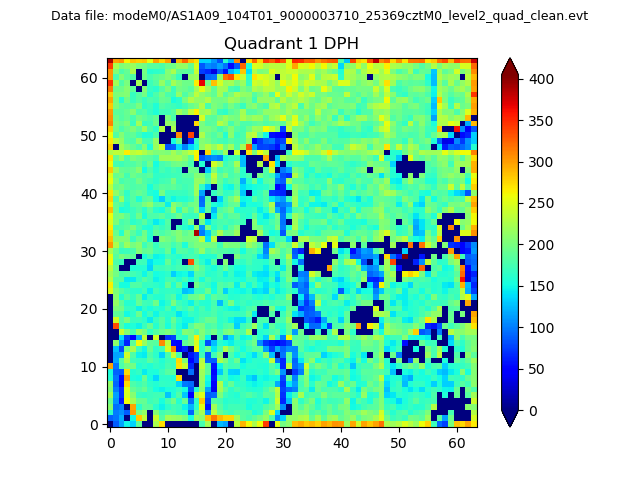 |
Quadrant B |
|---|---|---|---|
| Quadrant D | 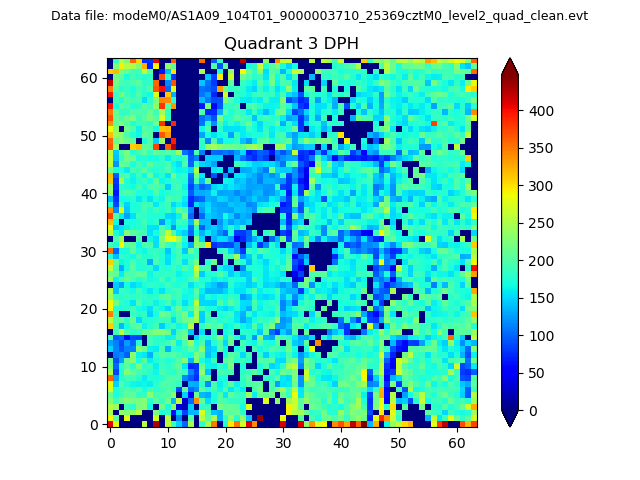 |
 |
Quadrant C |
| Plot type | Count rate plots | Images |
|---|---|---|
| Comparison with Poisson distribution Blue bars denote a histogram of data divided into 1 sec bins. Red curve is a Poisson curve with rate = median count rate of data. |
 |
 |
| Quadrant-wise count rates Data is divided into 100 sec bins |
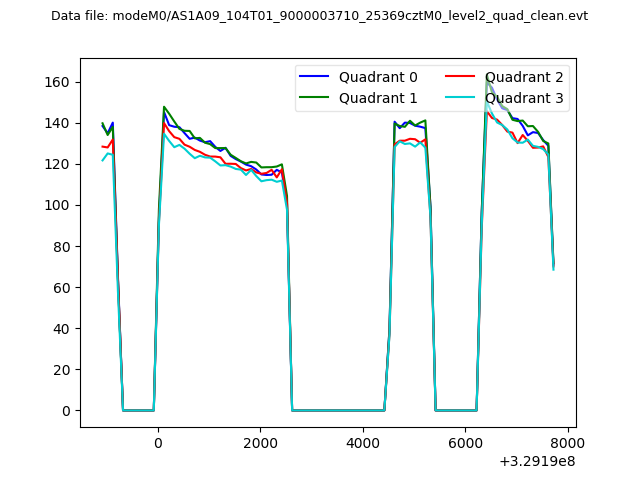 |
|
| Module-wise count rates for Quadrant A Data is divided into 100 sec bins |
 |
 |
| Module-wise count rates for Quadrant B Data is divided into 100 sec bins |
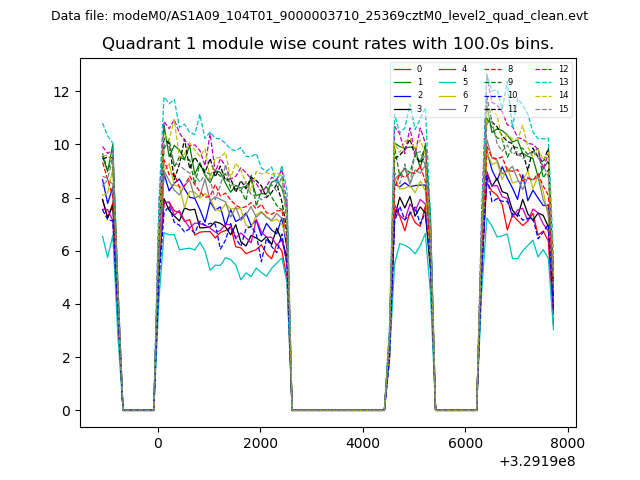 |
 |
| Module-wise count rates for Quadrant C Data is divided into 100 sec bins |
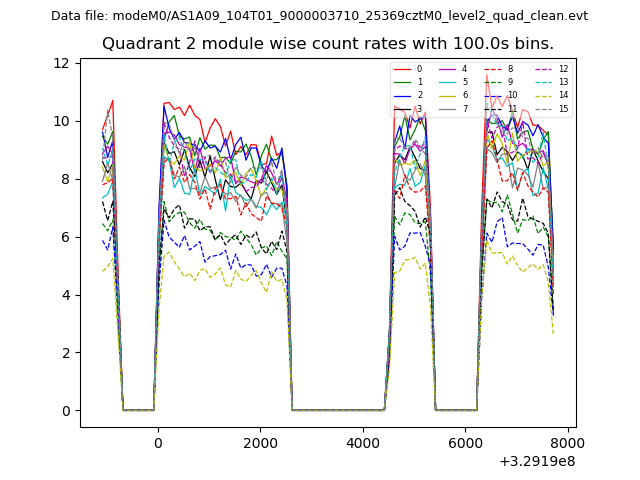 |
 |
| Module-wise count rates for Quadrant D Data is divided into 100 sec bins |
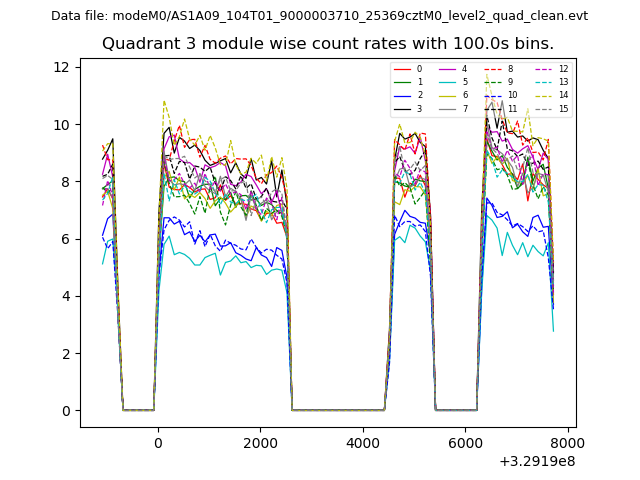 |
 |
| Parameter | Plot |
|---|---|
| CZT HV Monitor | 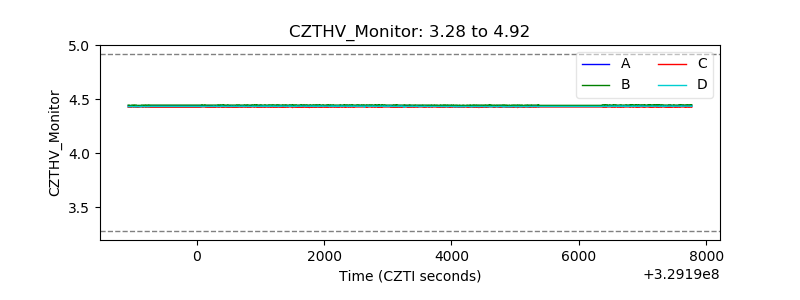 |
| D_VDD | 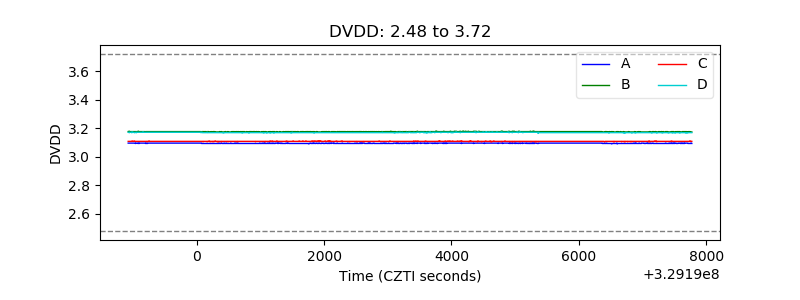 |
| Temperature 1 | 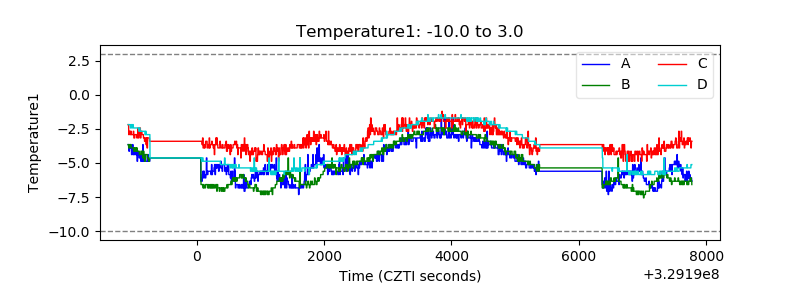 |
| Veto HV Monitor | 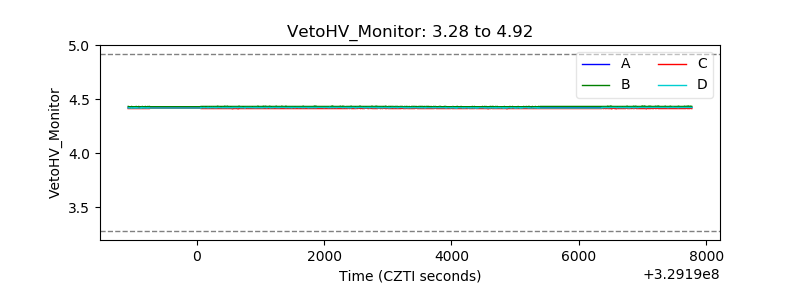 |
| Veto LLD | 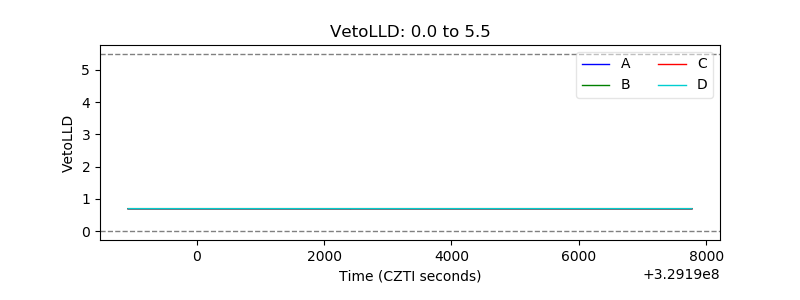 |
| Alpha Counter | 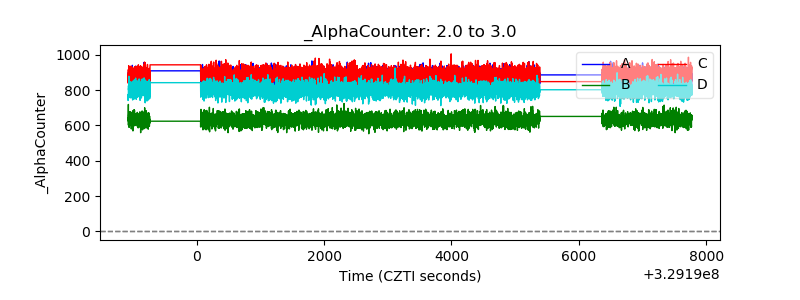 |
| _CPM_Rate | 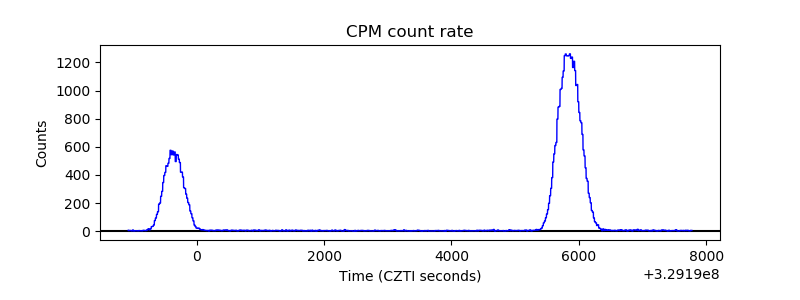 |
| CZT Counter | 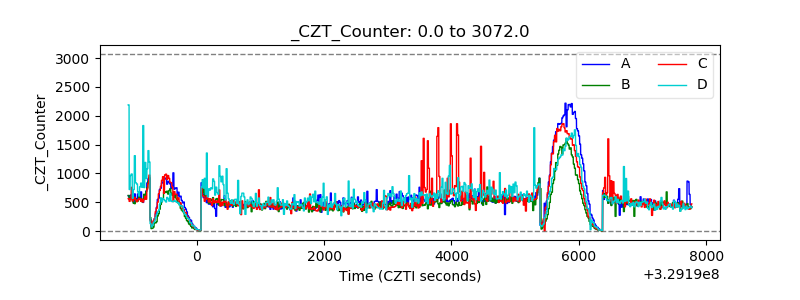 |
| +2.5 Volts monitor |  |
| +5 Volts monitor | 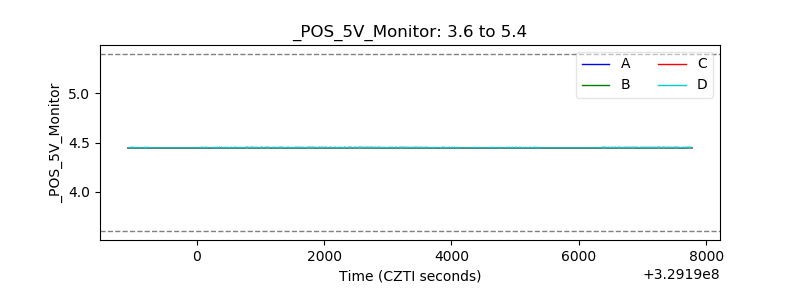 |
| _ROLL_ROT |  |
| _Roll_DEC | 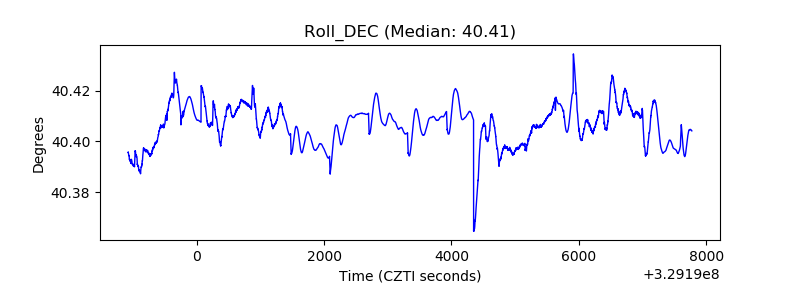 |
| _Roll_RA | 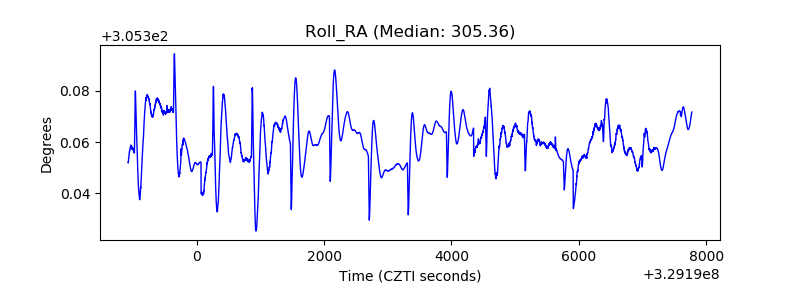 |
| Veto Counter | 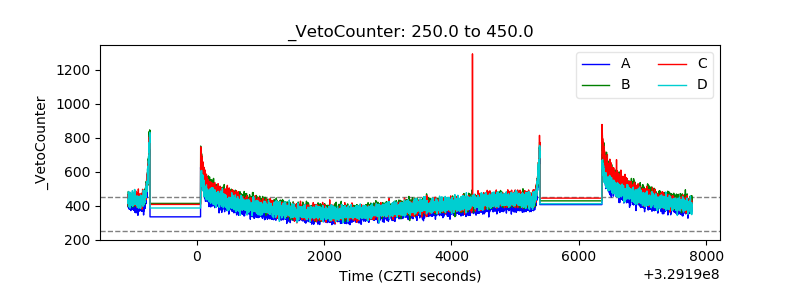 |