| Param | Original file | Final file |
|---|---|---|
| Filename | modeM0/AS1A09_104T01_9000003710_25371cztM0_level2.evt | modeM0/AS1A09_104T01_9000003710_25371cztM0_level2_quad_clean.evt |
| Size (bytes) | 540,383,040 | 99,115,200 |
| Size | 515.3 MB | 94.5 MB |
| Events in quadrant A | 3,276,033 | 657,849 |
| Events in quadrant B | 3,294,940 | 663,080 |
| Events in quadrant C | 3,228,090 | 622,484 |
| Events in quadrant D | 6,122,161 | 601,591 |
| Mode M9 | |||
|---|---|---|---|
| Quadrant | BADHDUFLAG | Total packets | Discarded packets |
| A | 0 | 12 | 0 |
| B | 0 | 13 | 0 |
| C | 0 | 13 | 0 |
| D | 0 | 13 | 0 |
| Mode M0 | |||
|---|---|---|---|
| Quadrant | BADHDUFLAG | Total packets | Discarded packets |
| A | 0 | 13705 | 0 |
| B | 0 | 13739 | 0 |
| C | 0 | 13705 | 0 |
| D | 0 | 22692 | 0 |
| Quadrant | Total seconds | Saturated seconds | Saturation percentage |
|---|---|---|---|
| A | 6545 | 36 | 0.550038% |
| B | 6545 | 61 | 0.932009% |
| C | 6545 | 80 | 1.222307% |
| D | 6545 | 1071 | 16.363636% |
Noise dominated data is calculated using 1-second bins in cleaned event files. If a bin has >2000 counts, and if more than 50% of those come from <1% of pixels, then it is considered to be noise-dominated and hence unusable.
| Quadrant | # 1 sec bins | Bins with >0 counts | Bins with >2000 counts | High rate bins dominated by noise | Noise dominated (total time) | Noise dominated (detector-on time) | Marked lightcurve |
|---|---|---|---|---|---|---|---|
| A | 7635 | 6546 | 0 | 0 | 0.00% | 0.00% | 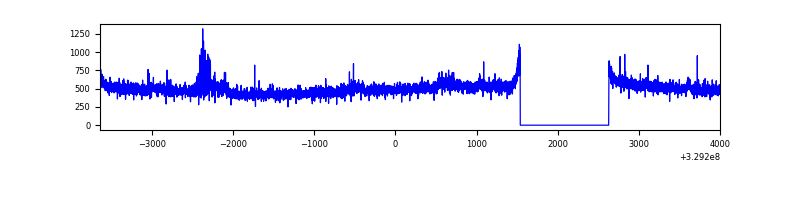 |
| B | 7635 | 6545 | 7 | 7 | 0.09% | 0.11% | 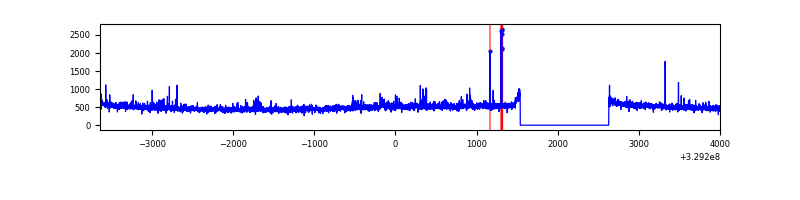 |
| C | 7635 | 6546 | 2 | 2 | 0.03% | 0.03% | 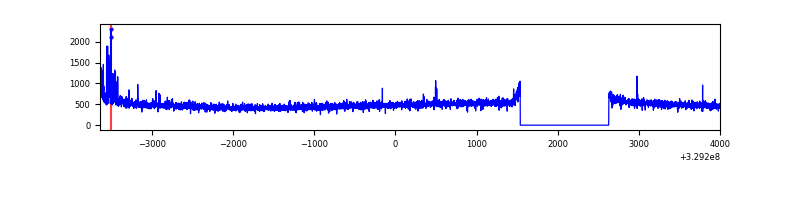 |
| D | 7635 | 6546 | 1002 | 1002 | 13.12% | 15.31% | 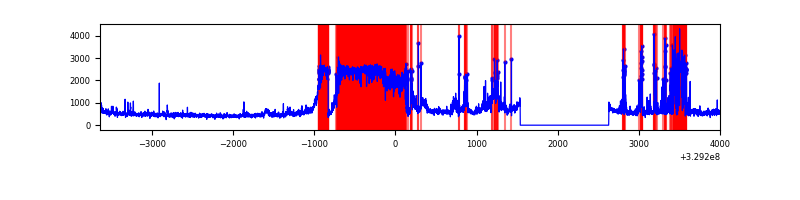 |
Top three noisy pixels from each quadrant. If the there are fewer than three noisy pixels in the level2.evt file, extra rows are filled as -1
| Pixel properties | Quadrant properties | ||||||
|---|---|---|---|---|---|---|---|
| Quadrant | DetID | PixID | Counts | Sigma | Mean | Median | Sigma |
| A | 6 | 16 | 116064 | 709.93 | 818 | 802 | 162.4 |
| A | 13 | 254 | 9477 | 53.43 | 818 | 802 | 162.4 |
| A | 3 | 137 | 7331 | 40.21 | 818 | 802 | 162.4 |
| B | 3 | 112 | 90077 | 581.04 | 809 | 789 | 153.7 |
| B | 12 | 111 | 18554 | 115.61 | 809 | 789 | 153.7 |
| B | 11 | 111 | 16654 | 103.24 | 809 | 789 | 153.7 |
| C | 14 | 238 | 126386 | 697.73 | 770 | 774 | 180.0 |
| C | 7 | 87 | 74337 | 408.62 | 770 | 774 | 180.0 |
| C | 3 | 233 | 24388 | 131.17 | 770 | 774 | 180.0 |
| D | 7 | 238 | 2904404 | 16594.3 | 719 | 696 | 175.0 |
| D | 8 | 195 | 347076 | 1979.51 | 719 | 696 | 175.0 |
| D | 2 | 244 | 61741 | 348.86 | 719 | 696 | 175.0 |
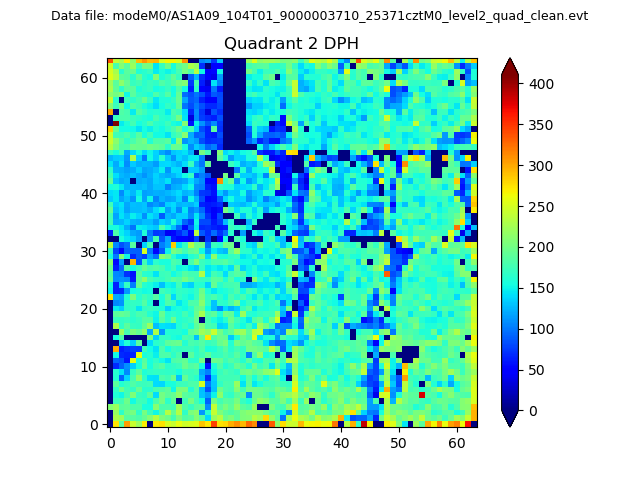
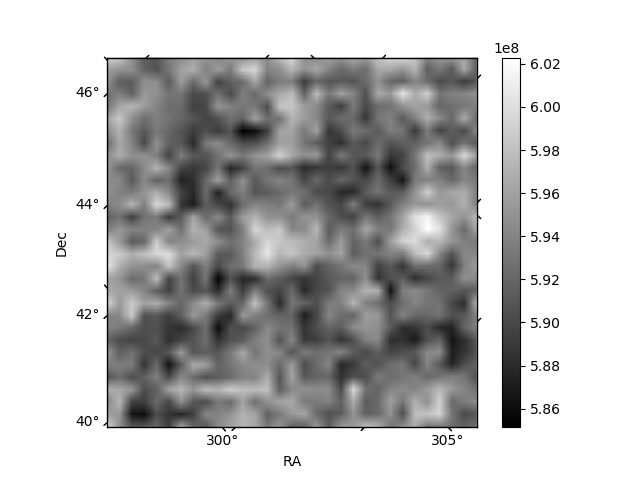
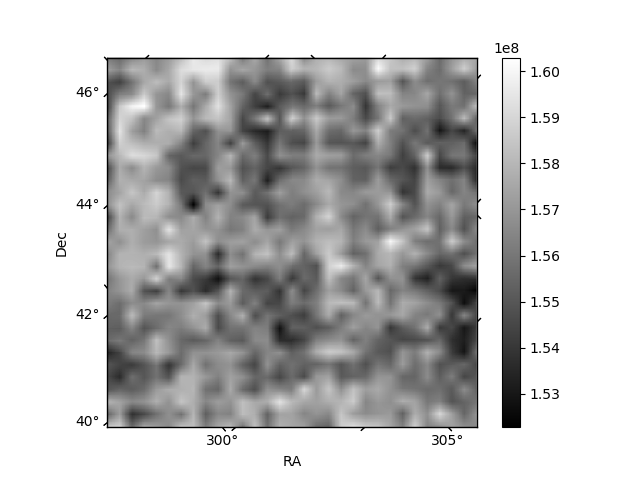
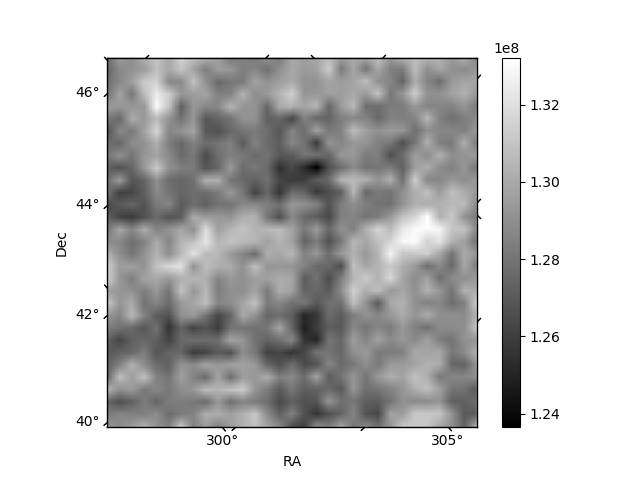
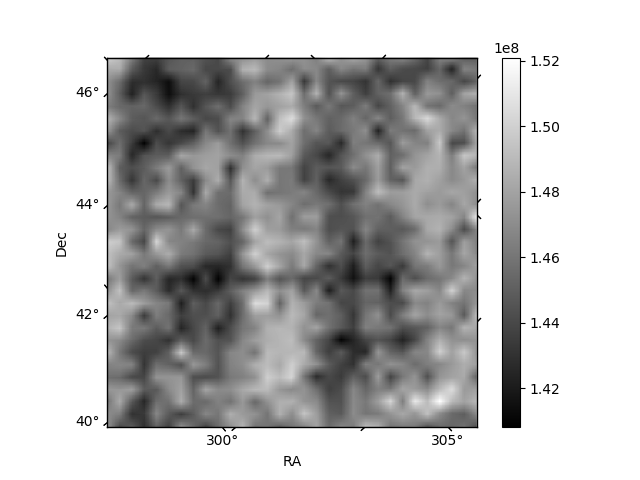
Histogram calculated using DETX and DETY for each event in the final _common_clean file
| Quadrant A | 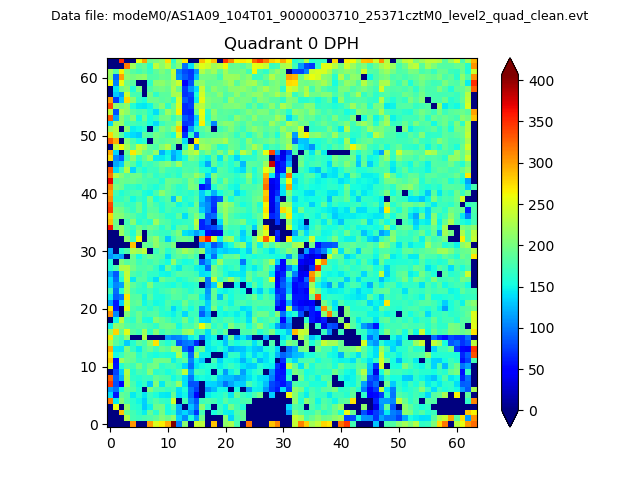 |
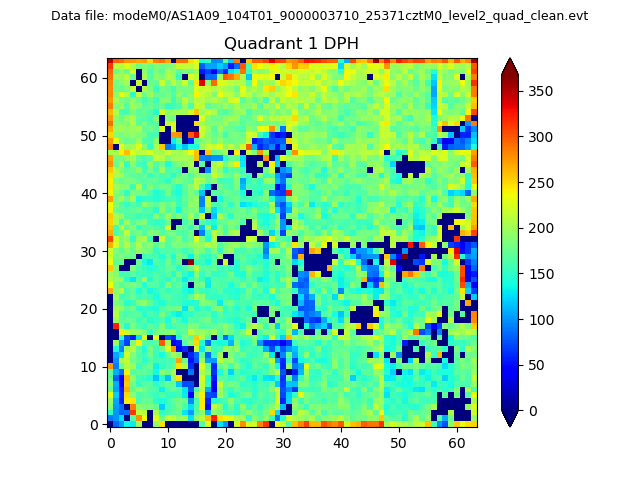 |
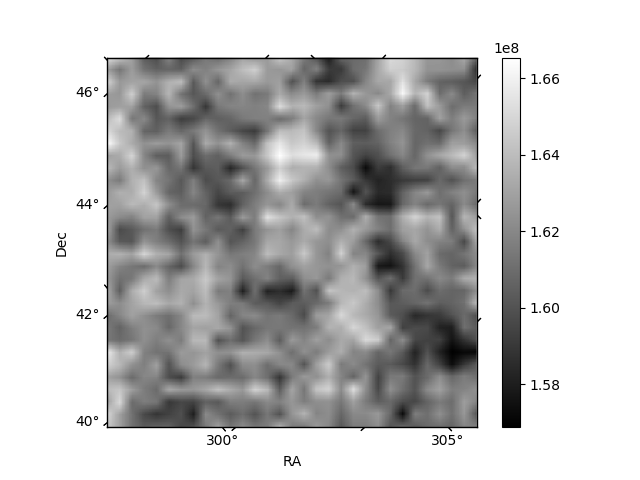
Quadrant B |
|---|---|---|---|
| Quadrant D | 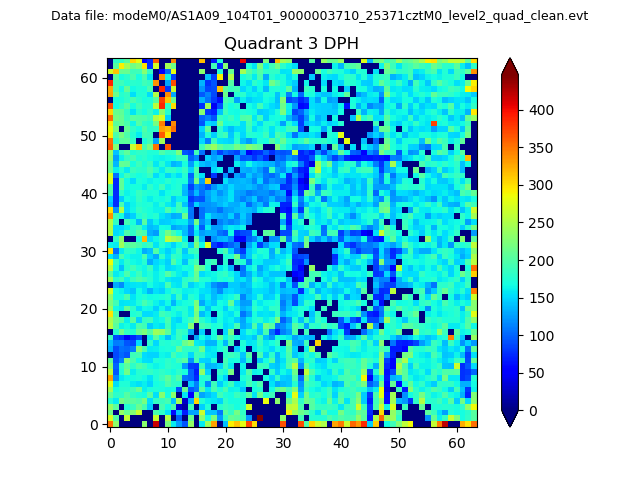 |
 |
Quadrant C |
| Plot type | Count rate plots | Images |
|---|---|---|
| Comparison with Poisson distribution Blue bars denote a histogram of data divided into 1 sec bins. Red curve is a Poisson curve with rate = median count rate of data. |
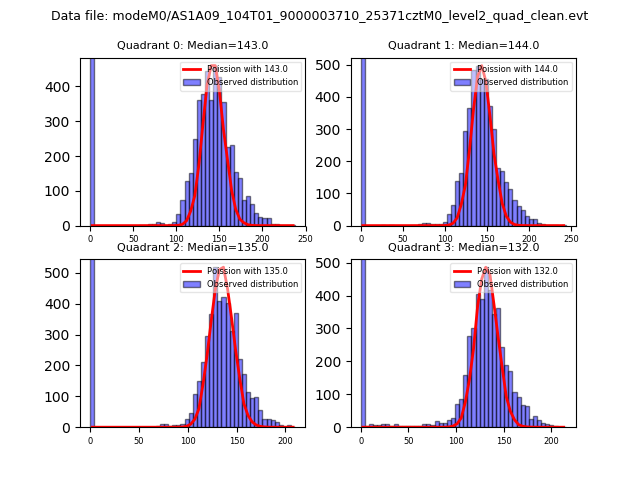 |
 |
| Quadrant-wise count rates Data is divided into 100 sec bins |
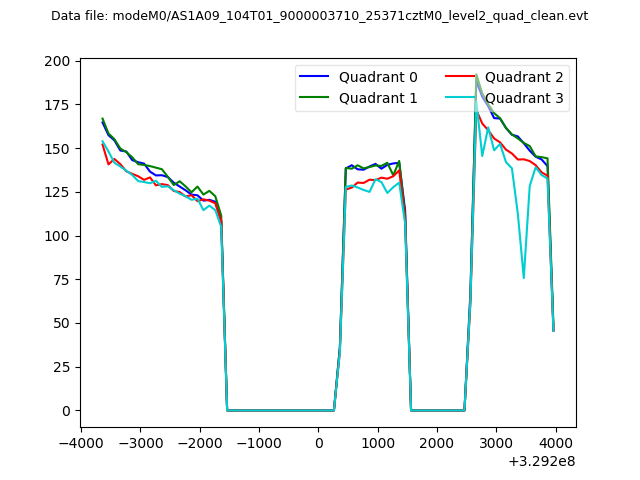 |
|
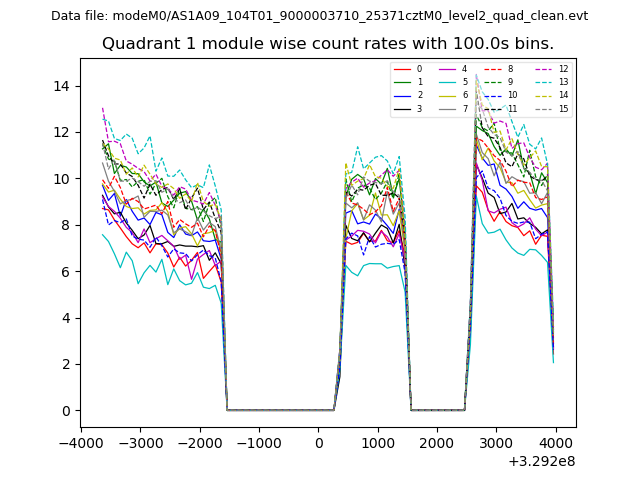
| Module-wise count rates for Quadrant A Data is divided into 100 sec bins |
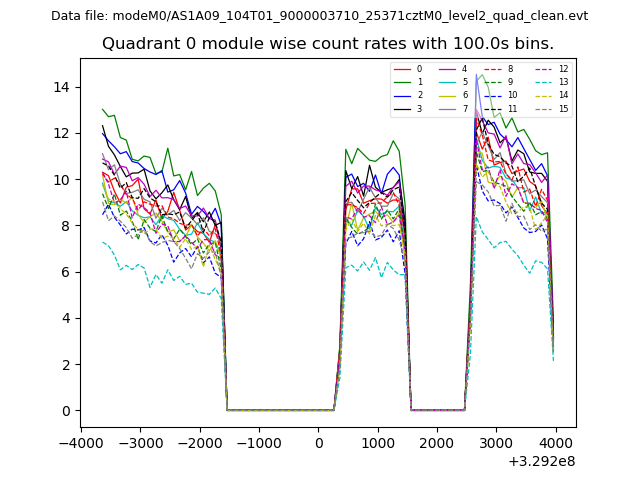 |
 |
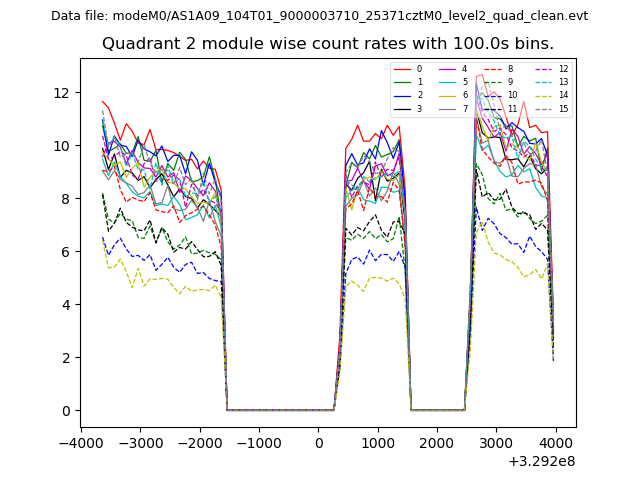
| Module-wise count rates for Quadrant B Data is divided into 100 sec bins |
 |
 |
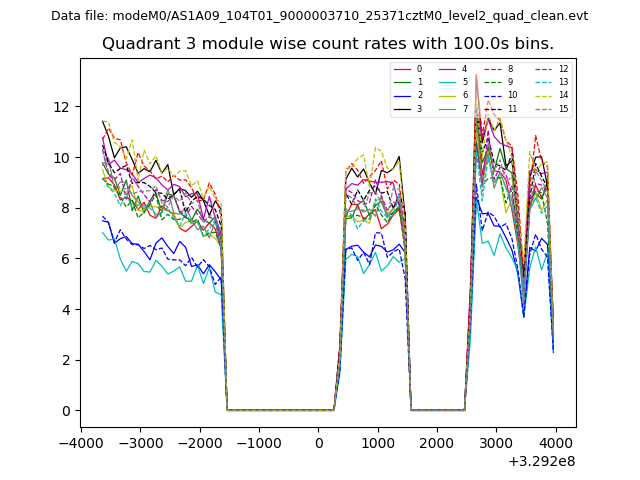
| Module-wise count rates for Quadrant C Data is divided into 100 sec bins |
 |
 |
| Module-wise count rates for Quadrant D Data is divided into 100 sec bins |
 |
 |
| Parameter | Plot |
|---|---|
| CZT HV Monitor | 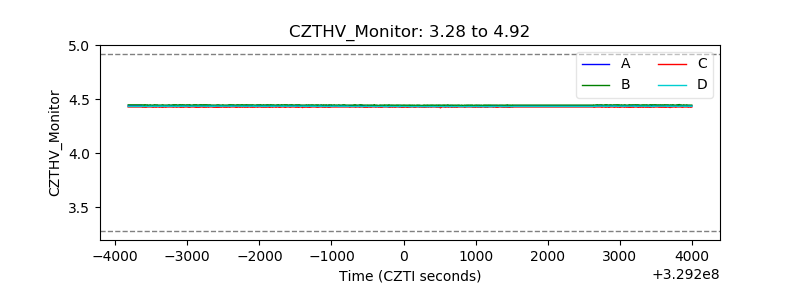 |
| D_VDD | 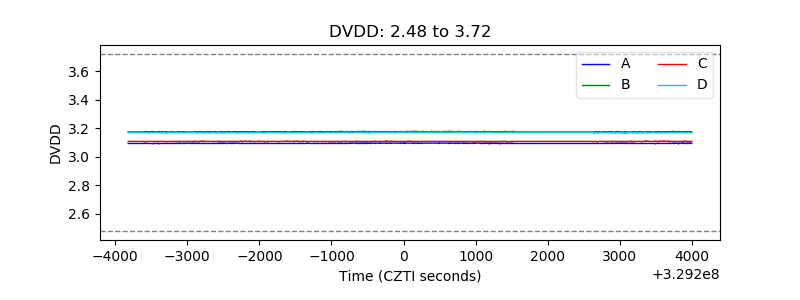 |
| Temperature 1 | 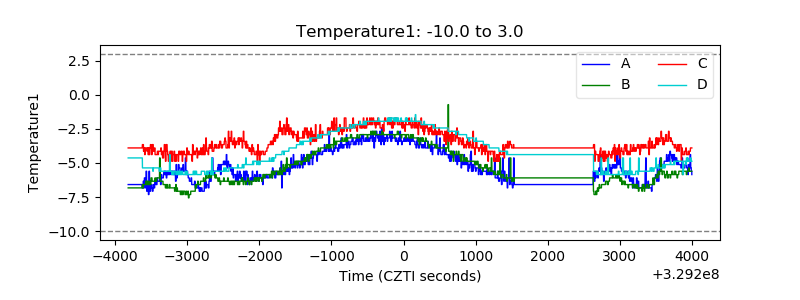 |
| Veto HV Monitor | 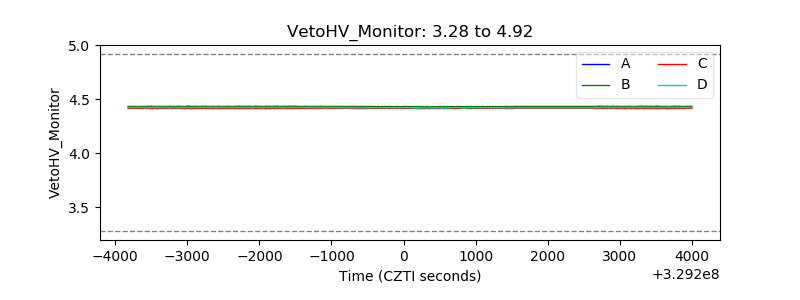 |
| Veto LLD | 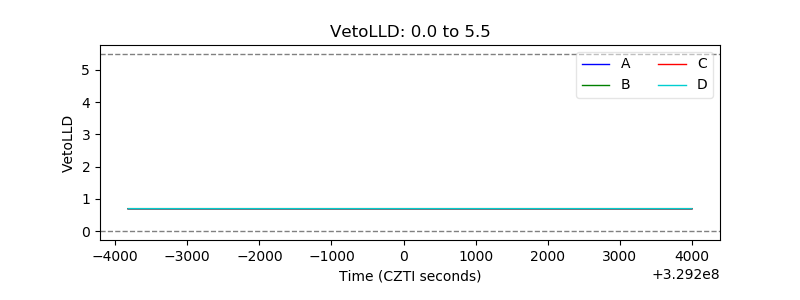 |
| Alpha Counter | 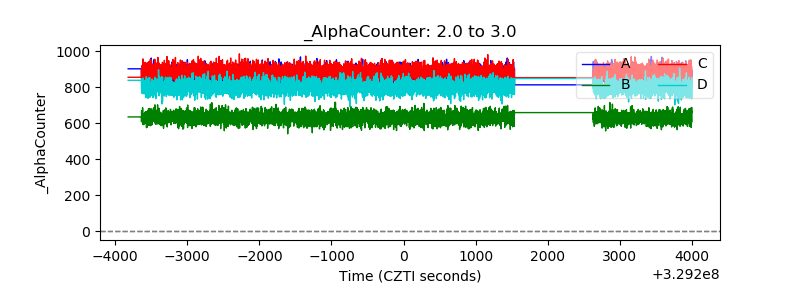 |
| _CPM_Rate | 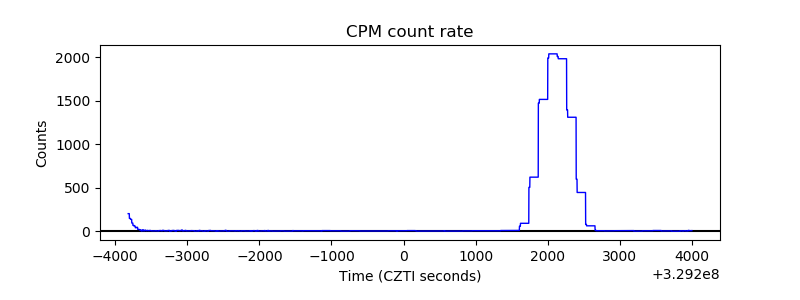 |
| CZT Counter | 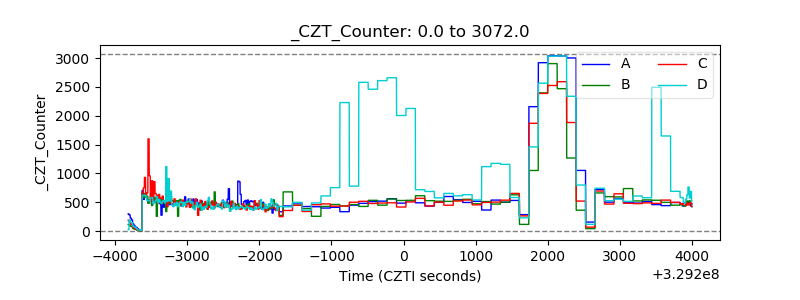 |
| +2.5 Volts monitor |  |
| +5 Volts monitor | 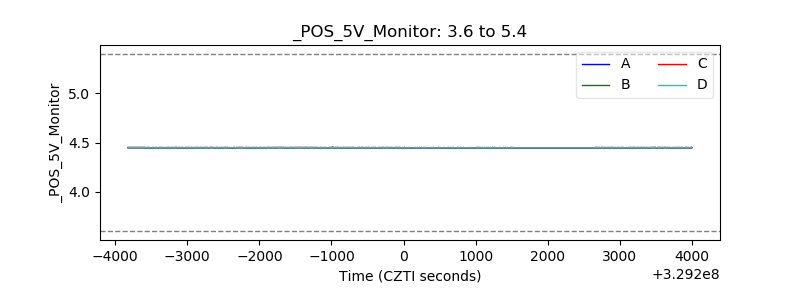 |
| _ROLL_ROT | 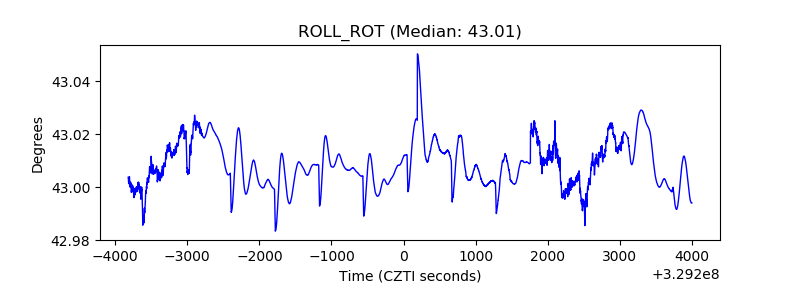 |
| _Roll_DEC | 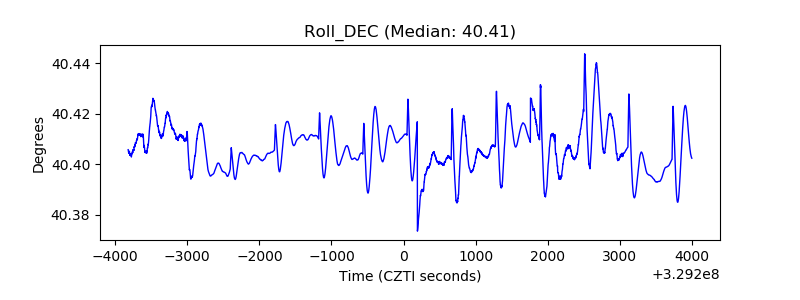 |
| _Roll_RA | 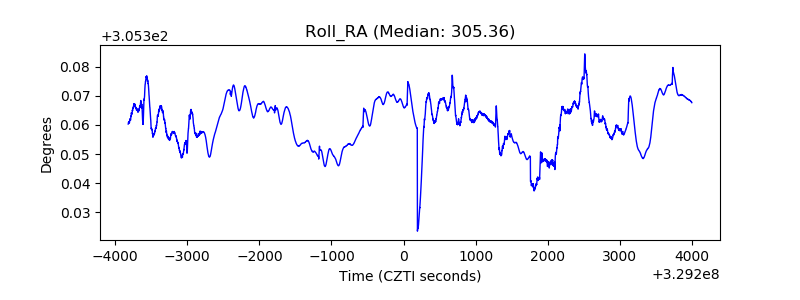 |
| Veto Counter | 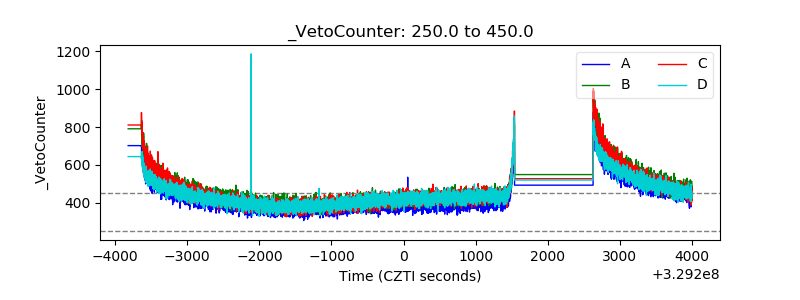 |