| Param | Original file | Final file |
|---|---|---|
| Filename | modeM0/AS1A09_104T01_9000003710_25373cztM0_level2.evt | modeM0/AS1A09_104T01_9000003710_25373cztM0_level2_quad_clean.evt |
| Size (bytes) | 856,186,560 | 144,783,360 |
| Size | 816.5 MB | 138.1 MB |
| Events in quadrant A | 5,866,718 | 941,134 |
| Events in quadrant B | 5,572,222 | 944,723 |
| Events in quadrant C | 5,495,977 | 885,523 |
| Events in quadrant D | 8,276,679 | 877,941 |
| Mode M9 | |||
|---|---|---|---|
| Quadrant | BADHDUFLAG | Total packets | Discarded packets |
| A | 0 | 25 | 0 |
| B | 0 | 25 | 0 |
| C | 0 | 25 | 0 |
| D | 0 | 25 | 0 |
| Mode M0 | |||
|---|---|---|---|
| Quadrant | BADHDUFLAG | Total packets | Discarded packets |
| A | 0 | 23891 | 0 |
| B | 0 | 22802 | 0 |
| C | 0 | 22644 | 0 |
| D | 0 | 31362 | 0 |
| Quadrant | Total seconds | Saturated seconds | Saturation percentage |
|---|---|---|---|
| A | 10623 | 134 | 1.261414% |
| B | 10624 | 162 | 1.524849% |
| C | 10624 | 172 | 1.618976% |
| D | 10624 | 813 | 7.652485% |
Noise dominated data is calculated using 1-second bins in cleaned event files. If a bin has >2000 counts, and if more than 50% of those come from <1% of pixels, then it is considered to be noise-dominated and hence unusable.
| Quadrant | # 1 sec bins | Bins with >0 counts | Bins with >2000 counts | High rate bins dominated by noise | Noise dominated (total time) | Noise dominated (detector-on time) | Marked lightcurve |
|---|---|---|---|---|---|---|---|
| A | 13128 | 10623 | 4 | 4 | 0.03% | 0.04% | 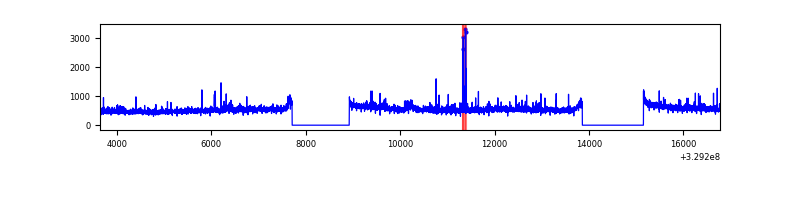 |
| B | 13129 | 10624 | 1 | 1 | 0.01% | 0.01% | 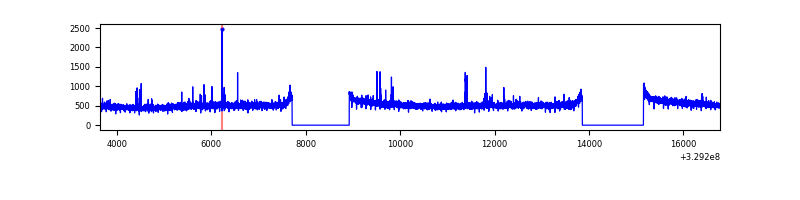 |
| C | 13129 | 10624 | 4 | 4 | 0.03% | 0.04% | 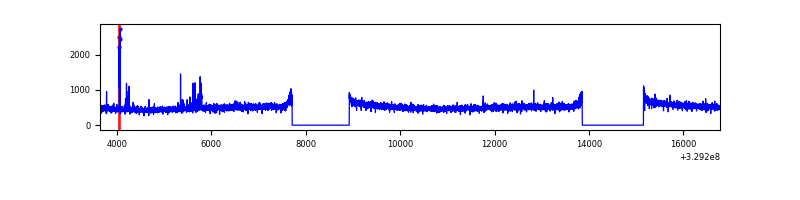 |
| D | 13129 | 10624 | 550 | 550 | 4.19% | 5.18% | 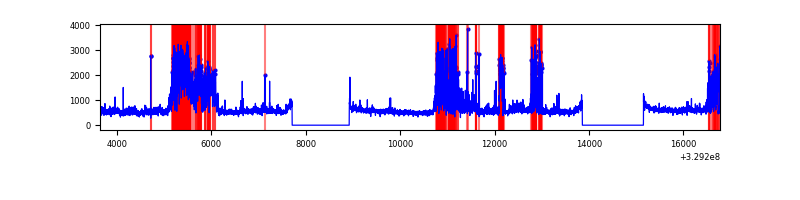 |
Top three noisy pixels from each quadrant. If the there are fewer than three noisy pixels in the level2.evt file, extra rows are filled as -1
| Pixel properties | Quadrant properties | ||||||
|---|---|---|---|---|---|---|---|
| Quadrant | DetID | PixID | Counts | Sigma | Mean | Median | Sigma |
| A | 6 | 16 | 239101 | 844.42 | 1436 | 1410 | 281.5 |
| A | 15 | 173 | 54453 | 188.44 | 1436 | 1410 | 281.5 |
| A | 12 | 96 | 40986 | 140.6 | 1436 | 1410 | 281.5 |
| B | 0 | 190 | 44128 | 163.58 | 1407 | 1378 | 261.3 |
| B | 12 | 111 | 31343 | 114.66 | 1407 | 1378 | 261.3 |
| B | 11 | 111 | 28435 | 103.53 | 1407 | 1378 | 261.3 |
| C | 14 | 238 | 219905 | 714.29 | 1337 | 1348 | 306.0 |
| C | 9 | 54 | 36864 | 116.07 | 1337 | 1348 | 306.0 |
| C | 0 | 239 | 20297 | 61.93 | 1337 | 1348 | 306.0 |
| D | 7 | 238 | 2485056 | 7660.4 | 1354 | 1317 | 324.2 |
| D | 8 | 195 | 522313 | 1606.87 | 1354 | 1317 | 324.2 |
| D | 2 | 244 | 75541 | 228.92 | 1354 | 1317 | 324.2 |
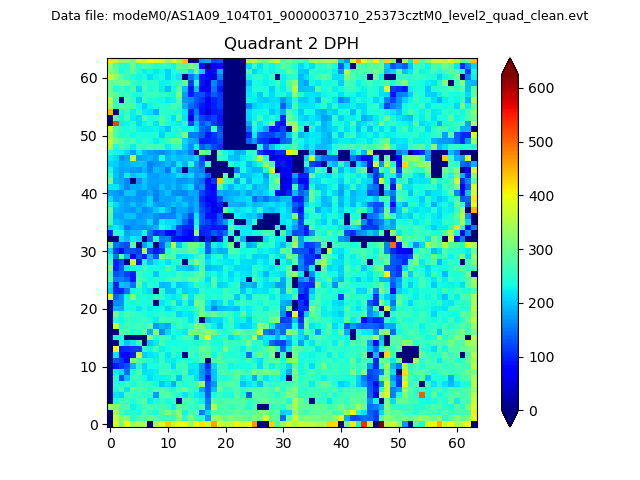
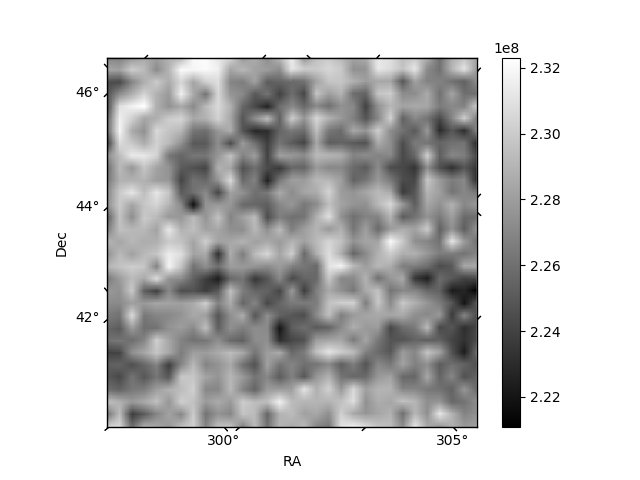
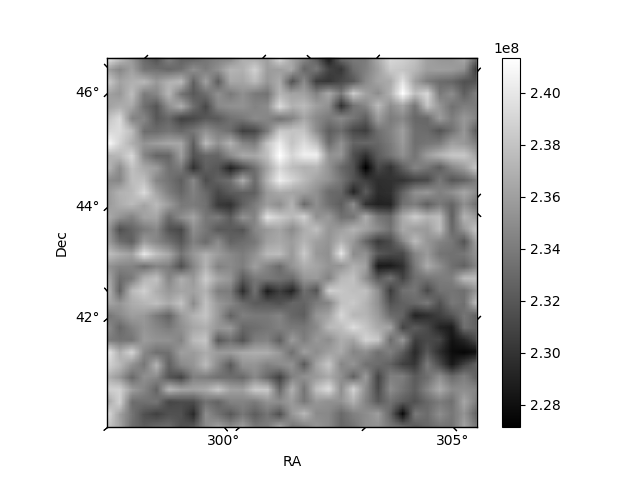
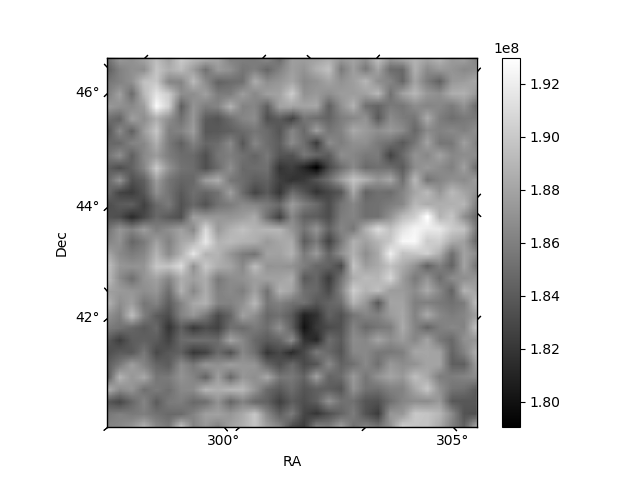
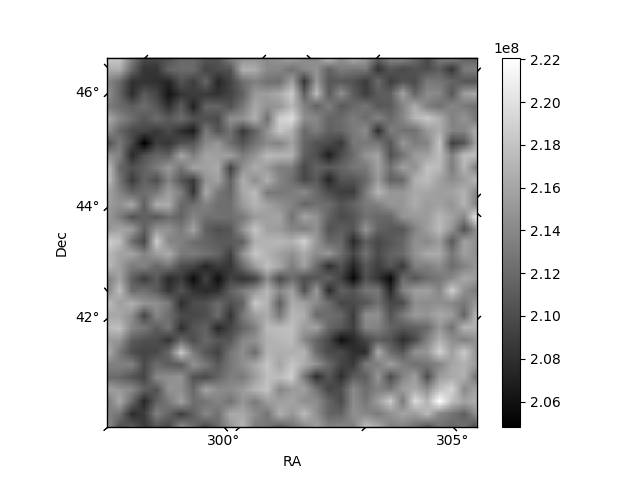
Histogram calculated using DETX and DETY for each event in the final _common_clean file
| Quadrant A | 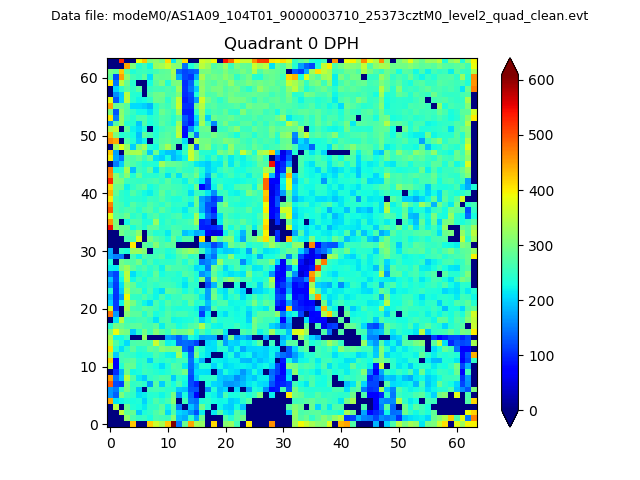 |
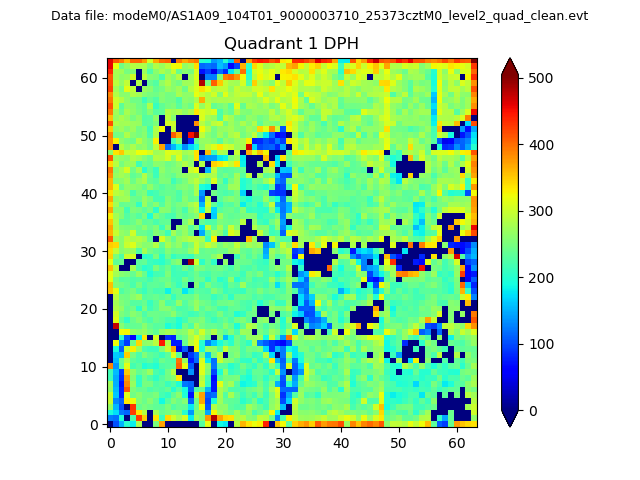 |
Quadrant B |
|---|---|---|---|
| Quadrant D | 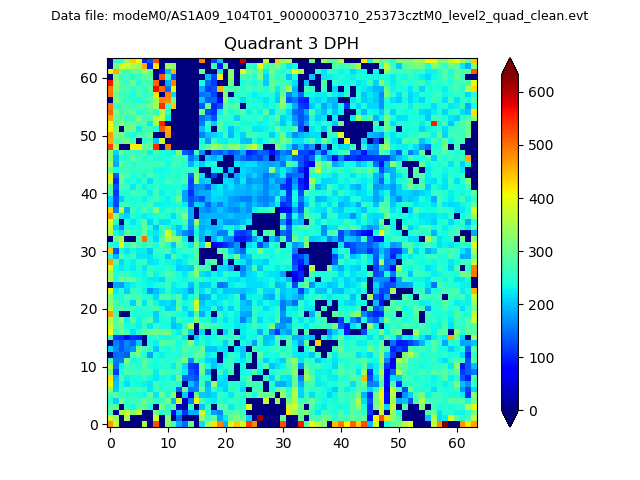 |
 |
Quadrant C |
| Plot type | Count rate plots | Images |
|---|---|---|
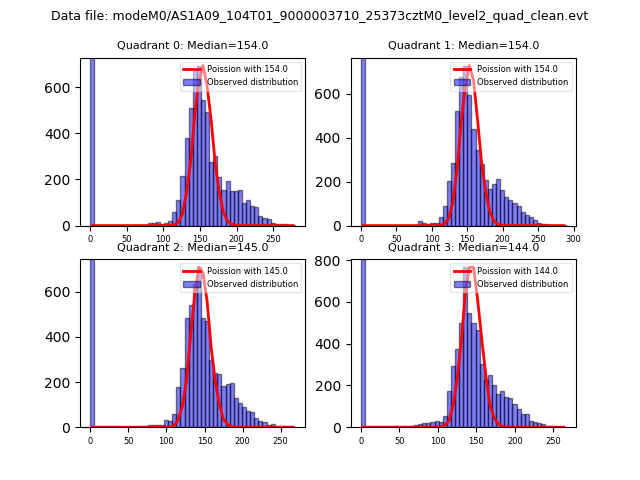
| Comparison with Poisson distribution Blue bars denote a histogram of data divided into 1 sec bins. Red curve is a Poisson curve with rate = median count rate of data. |
 |
 |
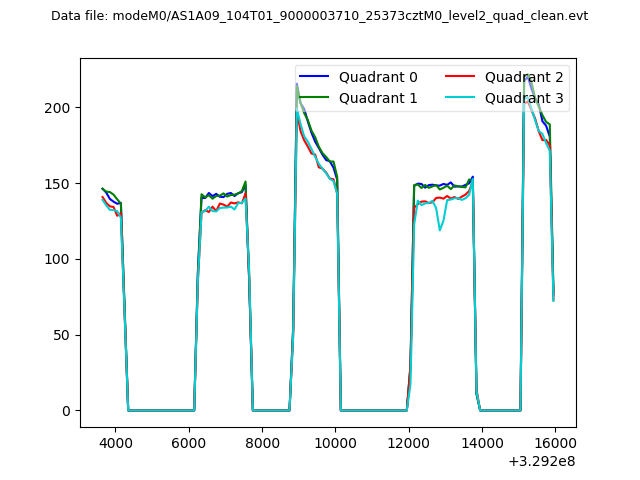
| Quadrant-wise count rates Data is divided into 100 sec bins |
 |
|
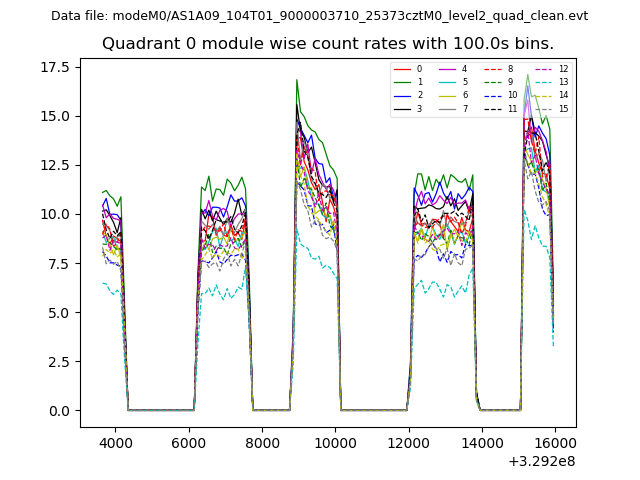
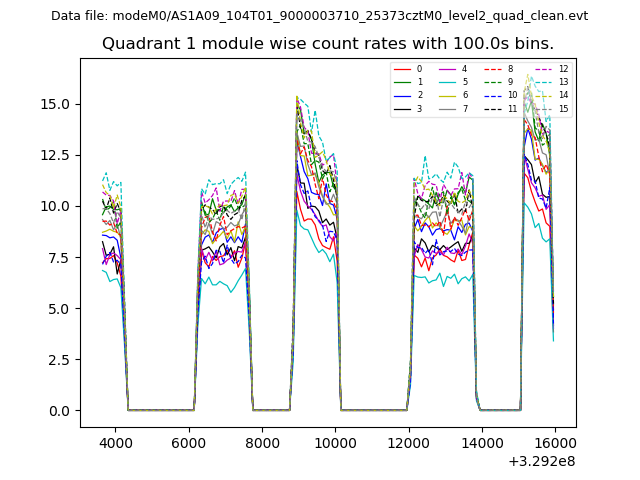
| Module-wise count rates for Quadrant A Data is divided into 100 sec bins |
 |
 |
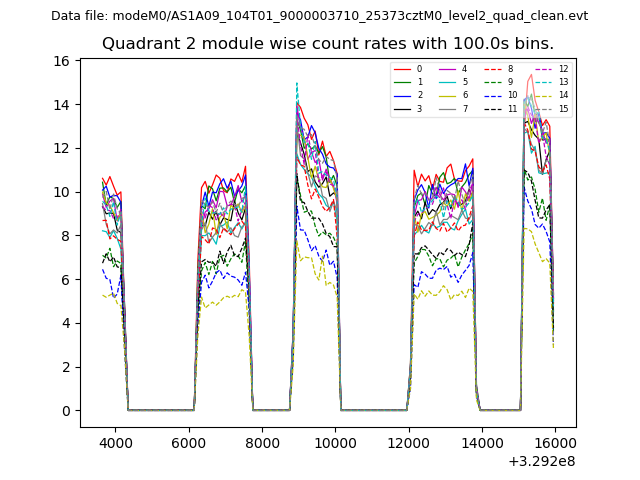
| Module-wise count rates for Quadrant B Data is divided into 100 sec bins |
 |
 |
| Module-wise count rates for Quadrant C Data is divided into 100 sec bins |
 |
 |
| Module-wise count rates for Quadrant D Data is divided into 100 sec bins |
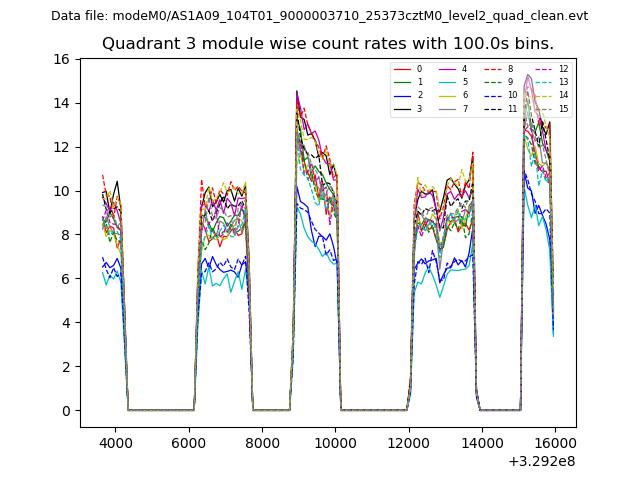 |
 |
| Parameter | Plot |
|---|---|
| CZT HV Monitor | 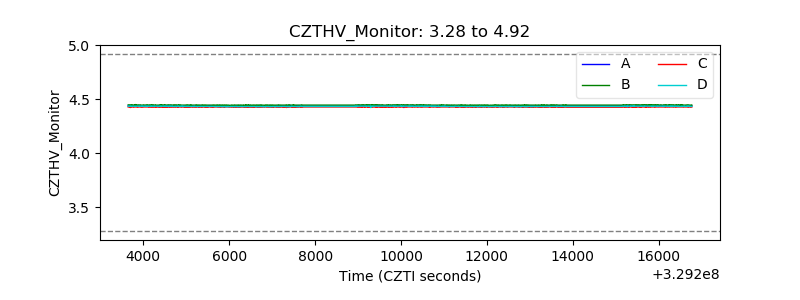 |
| D_VDD | 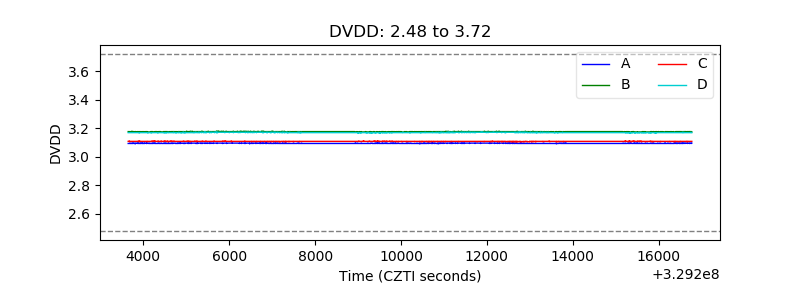 |
| Temperature 1 | 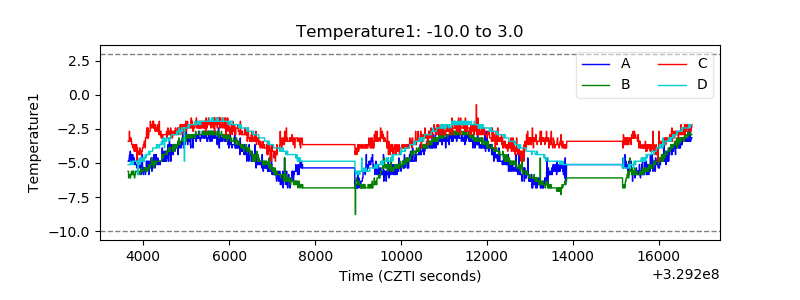 |
| Veto HV Monitor | 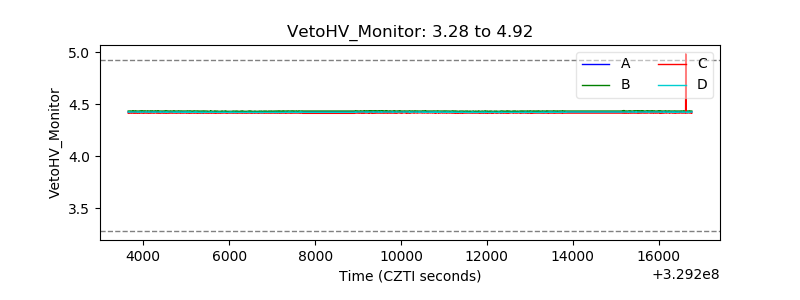 |
| Veto LLD | 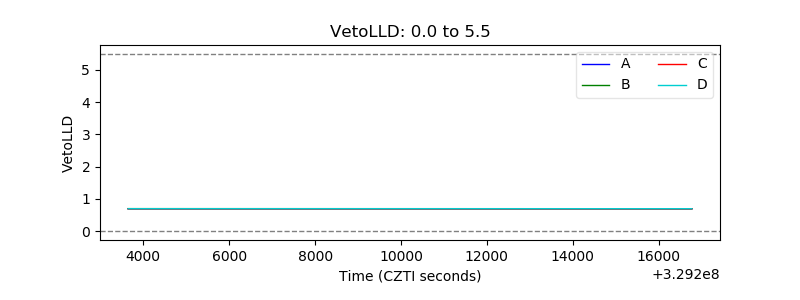 |
| Alpha Counter | 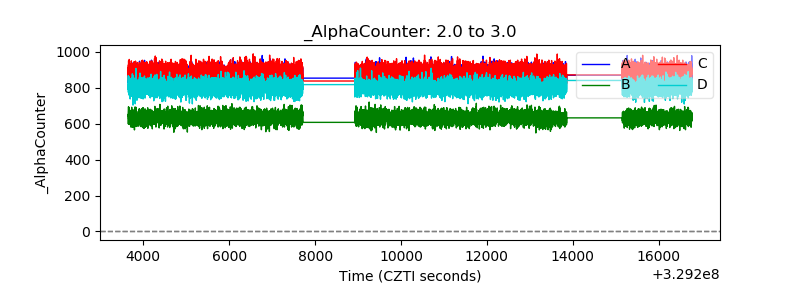 |
| _CPM_Rate | 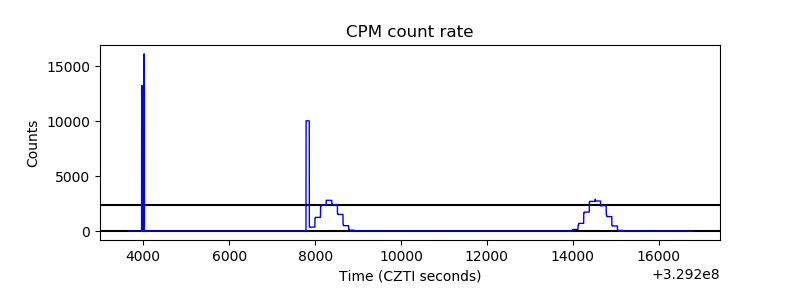 |
| CZT Counter | 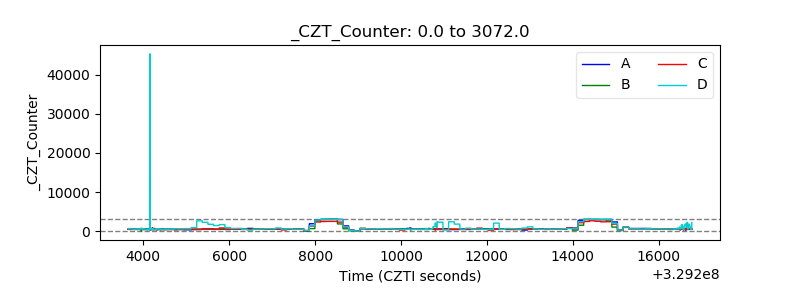 |
| +2.5 Volts monitor |  |
| +5 Volts monitor |  |
| _ROLL_ROT | 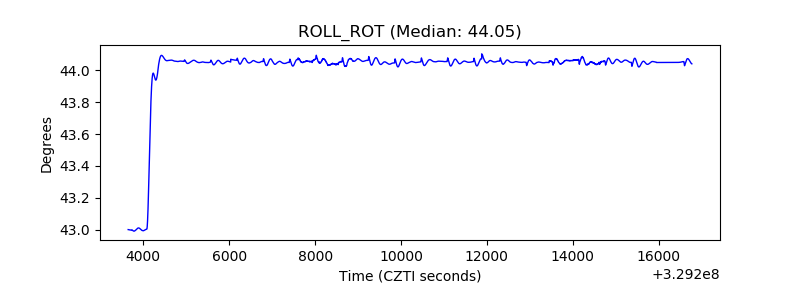 |
| _Roll_DEC | 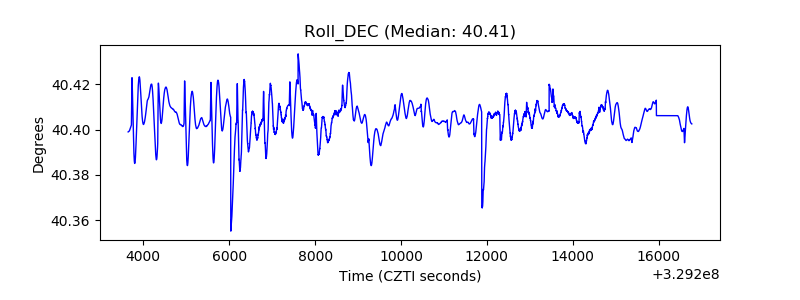 |
| _Roll_RA | 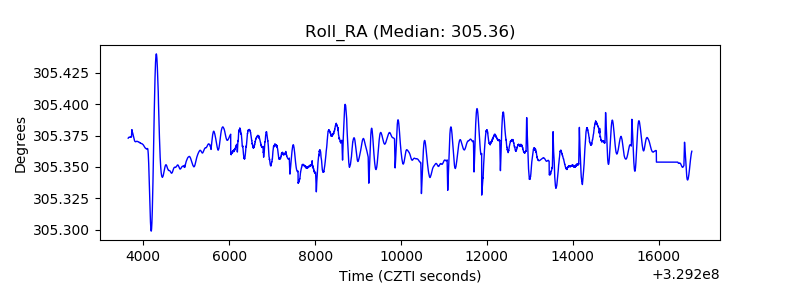 |
| Veto Counter | 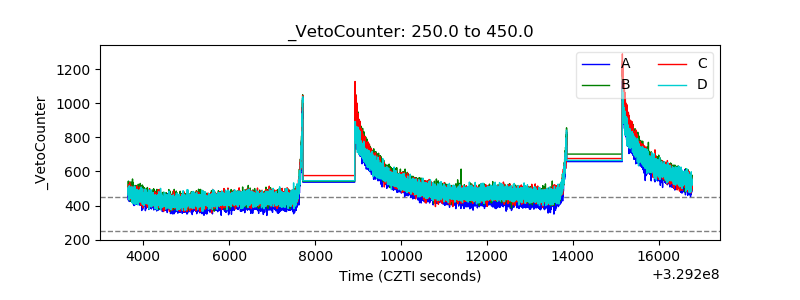 |