| Param | Original file | Final file |
|---|---|---|
| Filename | modeM0/AS1A09_104T01_9000003710_25374cztM0_level2.evt | modeM0/AS1A09_104T01_9000003710_25374cztM0_level2_quad_clean.evt |
| Size (bytes) | 522,763,200 | 76,017,600 |
| Size | 498.5 MB | 72.5 MB |
| Events in quadrant A | 3,511,721 | 486,861 |
| Events in quadrant B | 3,308,186 | 490,741 |
| Events in quadrant C | 3,268,282 | 460,504 |
| Events in quadrant D | 5,339,793 | 447,220 |
| Mode M9 | |||
|---|---|---|---|
| Quadrant | BADHDUFLAG | Total packets | Discarded packets |
| A | 0 | 14 | 0 |
| B | 0 | 14 | 0 |
| C | 0 | 14 | 0 |
| D | 0 | 14 | 0 |
| Mode M0 | |||
|---|---|---|---|
| Quadrant | BADHDUFLAG | Total packets | Discarded packets |
| A | 0 | 14126 | 0 |
| B | 0 | 13275 | 0 |
| C | 0 | 13105 | 0 |
| D | 0 | 19900 | 0 |
| Quadrant | Total seconds | Saturated seconds | Saturation percentage |
|---|---|---|---|
| A | 5964 | 101 | 1.693494% |
| B | 5965 | 106 | 1.777033% |
| C | 5965 | 113 | 1.894384% |
| D | 5965 | 563 | 9.438391% |
Noise dominated data is calculated using 1-second bins in cleaned event files. If a bin has >2000 counts, and if more than 50% of those come from <1% of pixels, then it is considered to be noise-dominated and hence unusable.
| Quadrant | # 1 sec bins | Bins with >0 counts | Bins with >2000 counts | High rate bins dominated by noise | Noise dominated (total time) | Noise dominated (detector-on time) | Marked lightcurve |
|---|---|---|---|---|---|---|---|
| A | 7304 | 5964 | 3 | 3 | 0.04% | 0.05% | 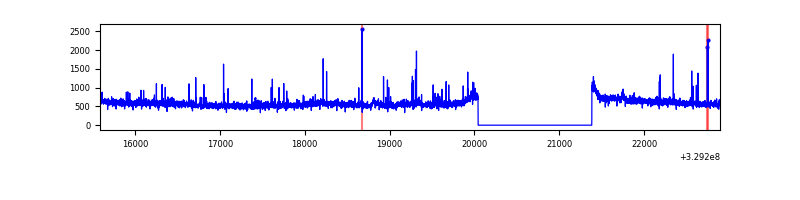 |
| B | 7305 | 5965 | 0 | 0 | 0.00% | 0.00% | 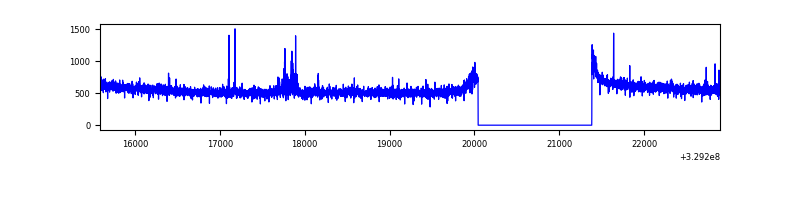 |
| C | 7305 | 5966 | 3 | 3 | 0.04% | 0.05% | 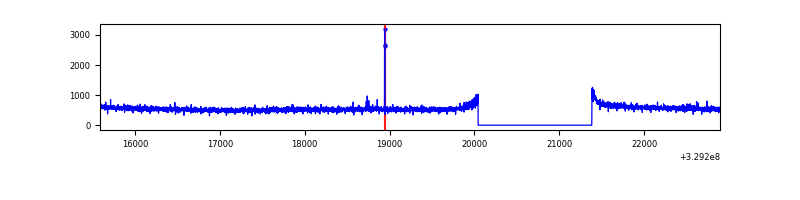 |
| D | 7305 | 5965 | 401 | 401 | 5.49% | 6.72% | 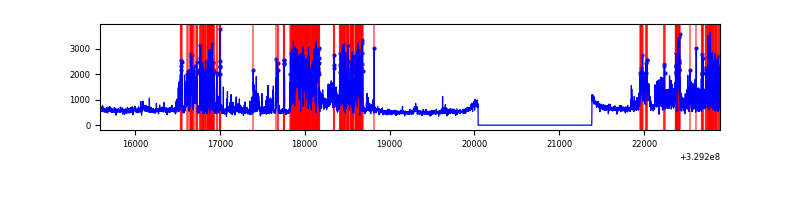 |
Top three noisy pixels from each quadrant. If the there are fewer than three noisy pixels in the level2.evt file, extra rows are filled as -1
| Pixel properties | Quadrant properties | ||||||
|---|---|---|---|---|---|---|---|
| Quadrant | DetID | PixID | Counts | Sigma | Mean | Median | Sigma |
| A | 6 | 16 | 143518 | 844.47 | 858 | 845 | 168.9 |
| A | 15 | 173 | 64388 | 376.11 | 858 | 845 | 168.9 |
| A | 13 | 254 | 7889 | 41.69 | 858 | 845 | 168.9 |
| B | 0 | 190 | 34589 | 217.71 | 837 | 820 | 155.1 |
| B | 12 | 111 | 17885 | 110.02 | 837 | 820 | 155.1 |
| B | 11 | 111 | 16477 | 100.94 | 837 | 820 | 155.1 |
| C | 14 | 238 | 132626 | 722.81 | 799 | 806 | 182.4 |
| C | 9 | 16 | 9924 | 49.99 | 799 | 806 | 182.4 |
| C | 3 | 233 | 7305 | 35.63 | 799 | 806 | 182.4 |
| D | 7 | 238 | 1949137 | 10216.61 | 804 | 784 | 190.7 |
| D | 8 | 195 | 215797 | 1127.47 | 804 | 784 | 190.7 |
| D | 12 | 233 | 76221 | 395.57 | 804 | 784 | 190.7 |
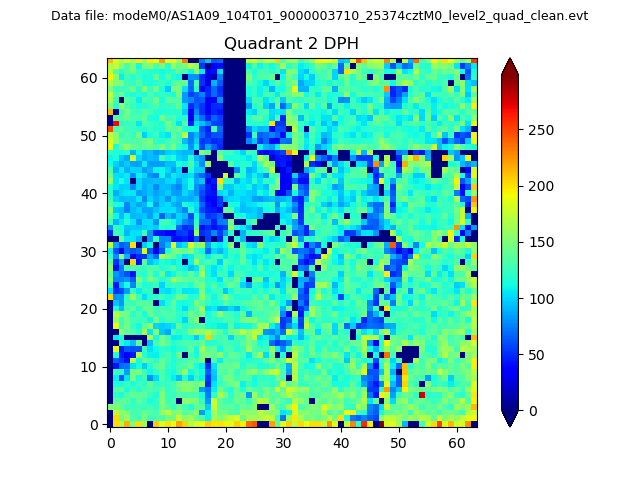
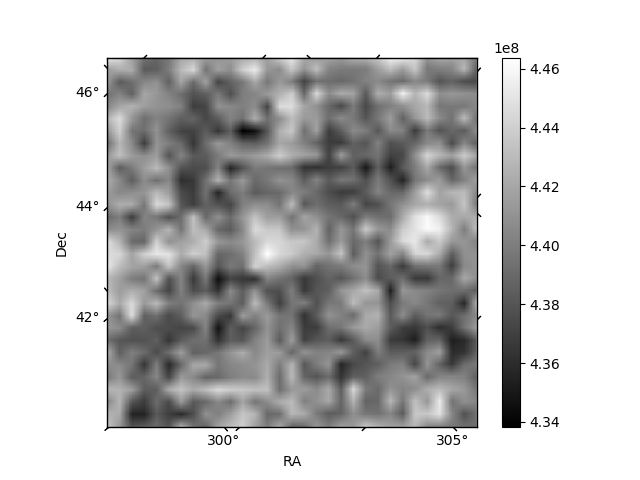
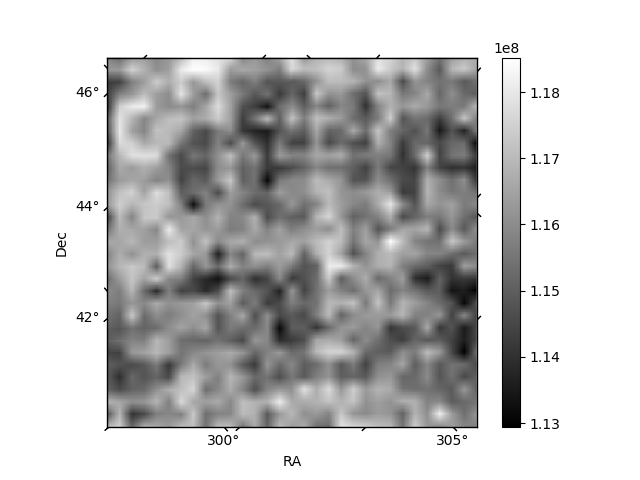
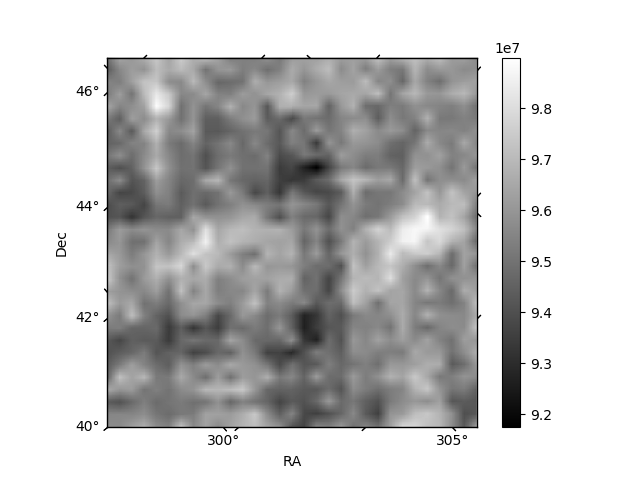
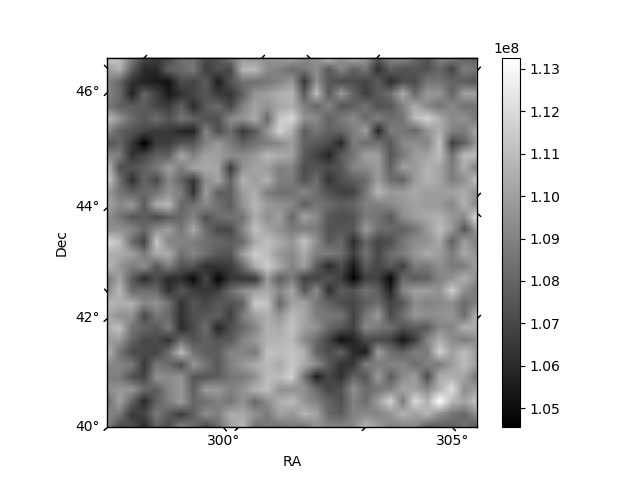
Histogram calculated using DETX and DETY for each event in the final _common_clean file
| Quadrant A | 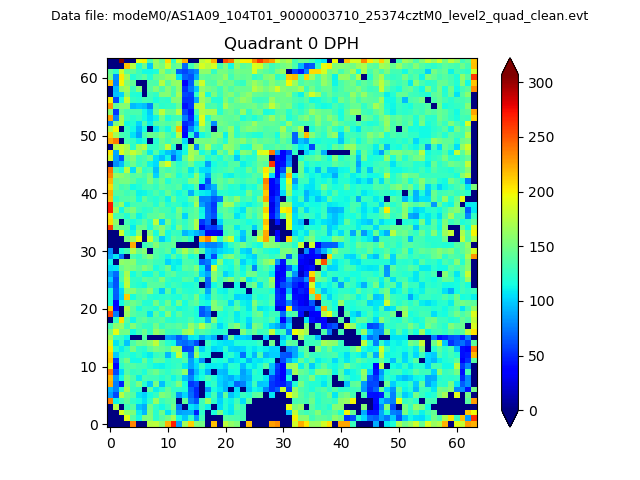 |
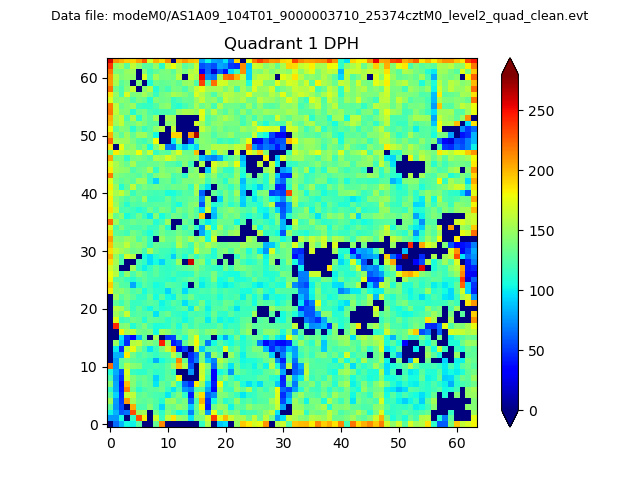 |
Quadrant B |
|---|---|---|---|
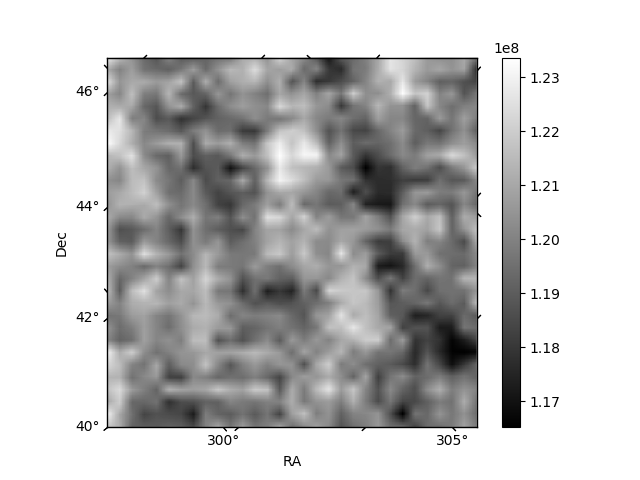
| Quadrant D | 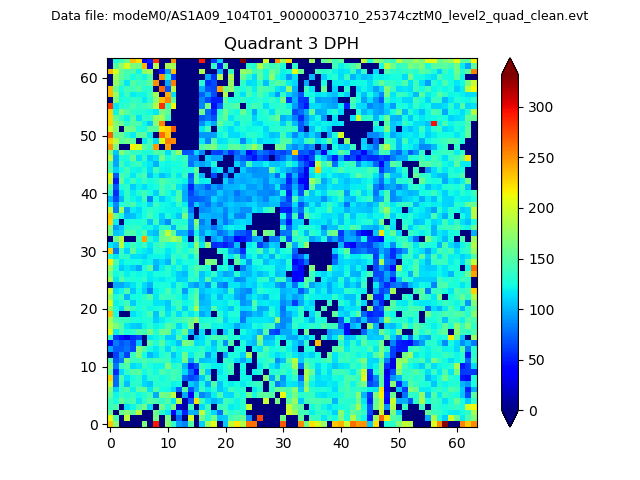 |
 |
Quadrant C |
| Plot type | Count rate plots | Images |
|---|---|---|
| Comparison with Poisson distribution Blue bars denote a histogram of data divided into 1 sec bins. Red curve is a Poisson curve with rate = median count rate of data. |
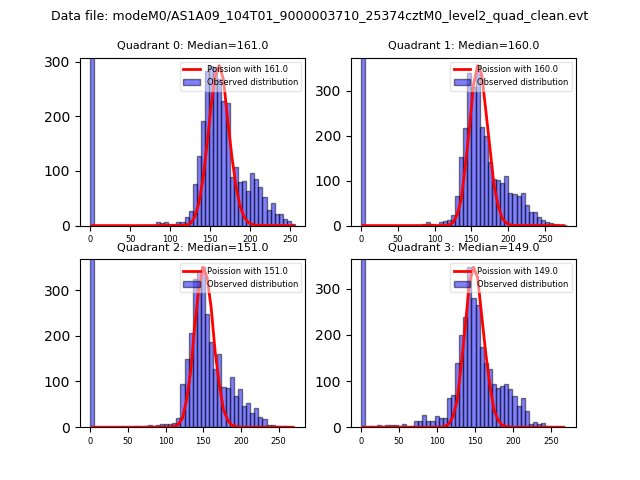 |
 |
| Quadrant-wise count rates Data is divided into 100 sec bins |
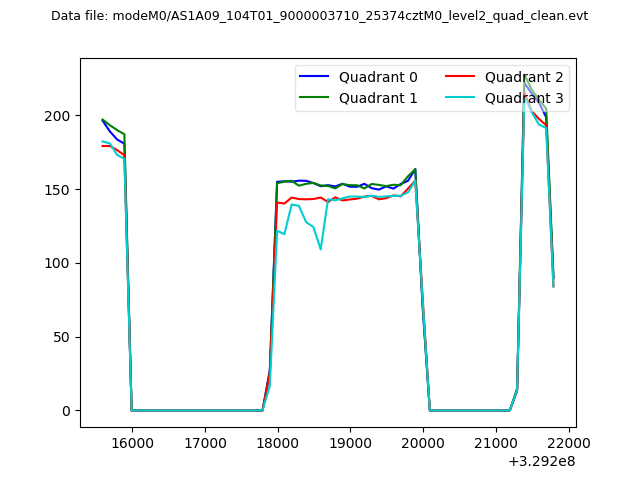 |
|
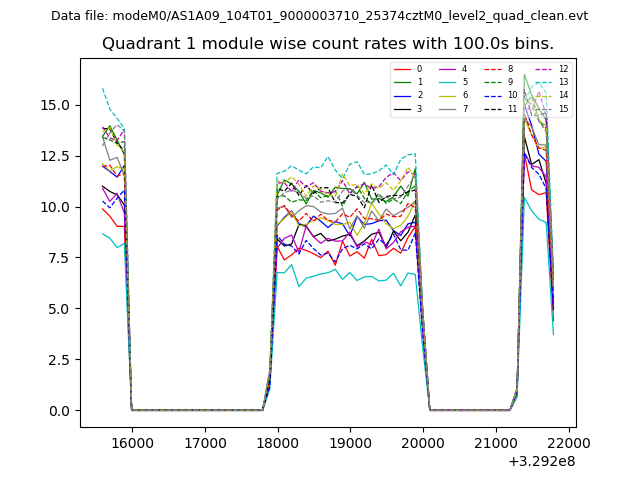
| Module-wise count rates for Quadrant A Data is divided into 100 sec bins |
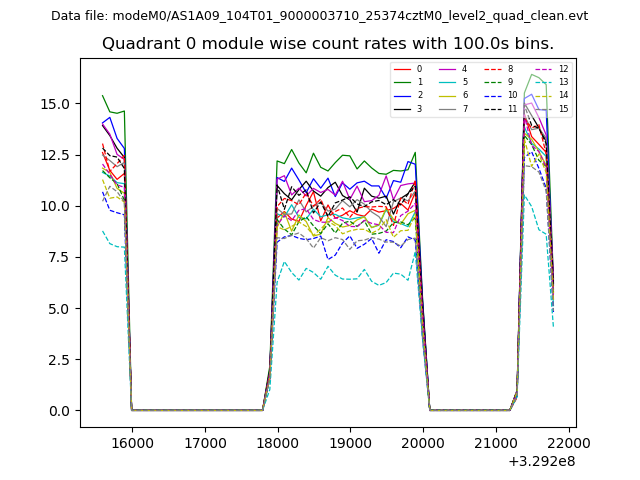 |
 |
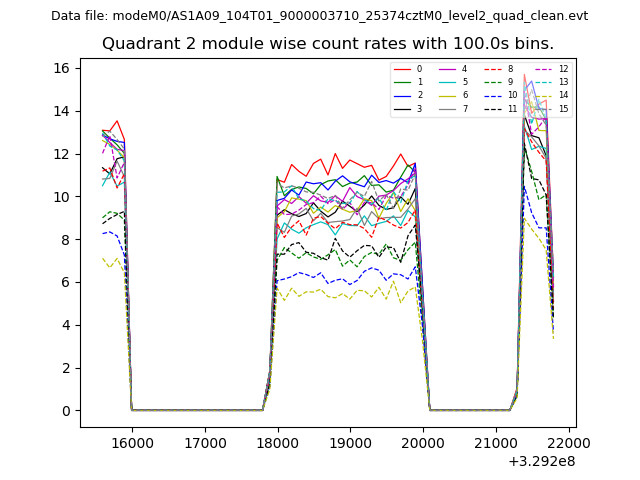
| Module-wise count rates for Quadrant B Data is divided into 100 sec bins |
 |
 |
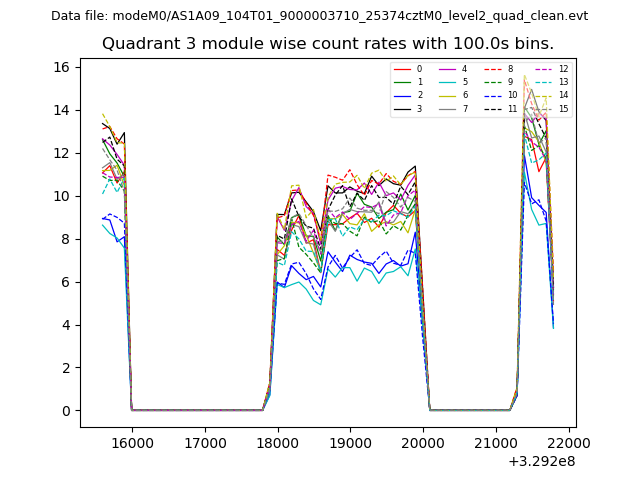
| Module-wise count rates for Quadrant C Data is divided into 100 sec bins |
 |
 |
| Module-wise count rates for Quadrant D Data is divided into 100 sec bins |
 |
 |
| Parameter | Plot |
|---|---|
| CZT HV Monitor | 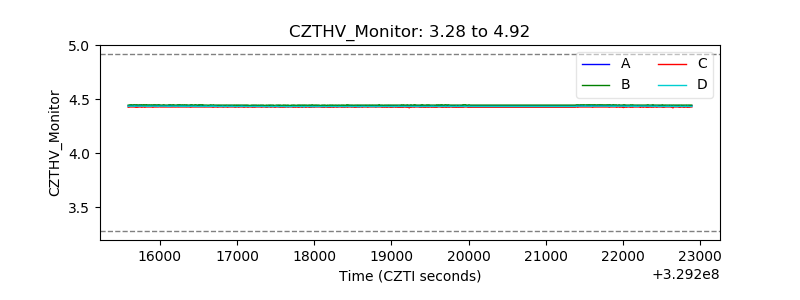 |
| D_VDD | 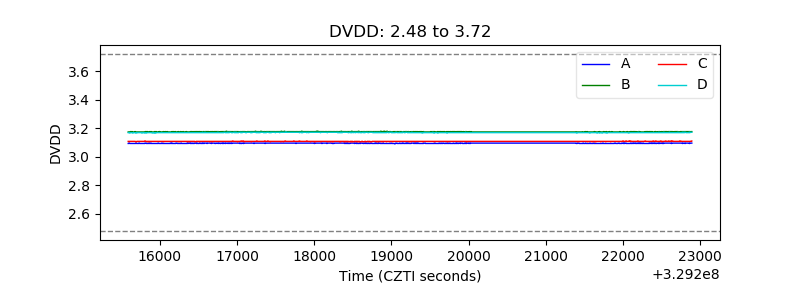 |
| Temperature 1 | 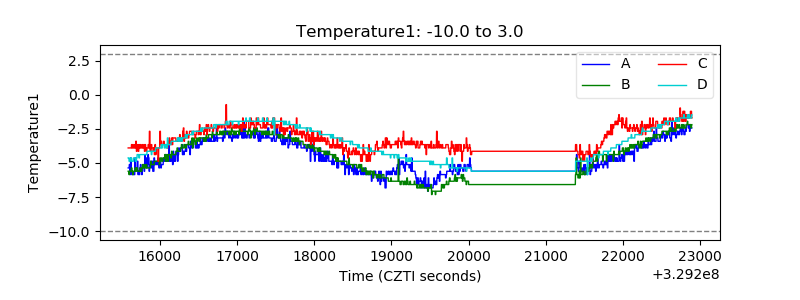 |
| Veto HV Monitor | 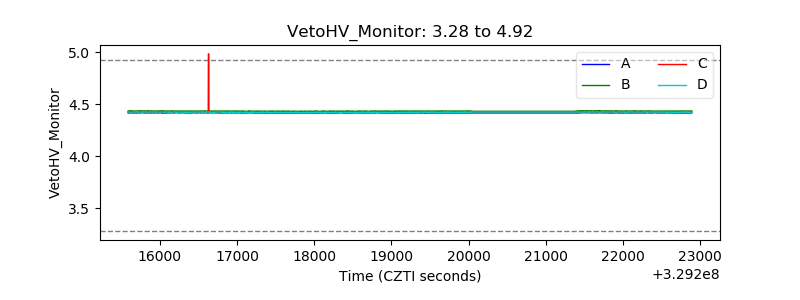 |
| Veto LLD | 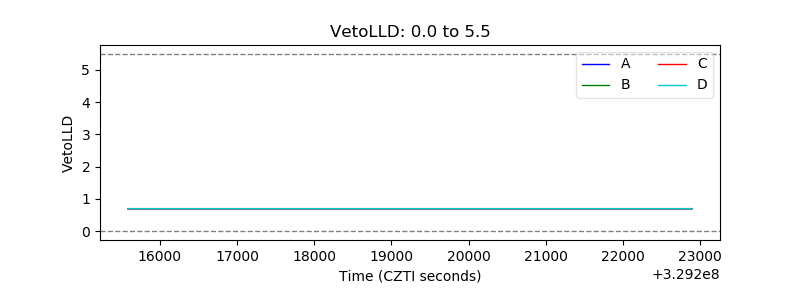 |
| Alpha Counter | 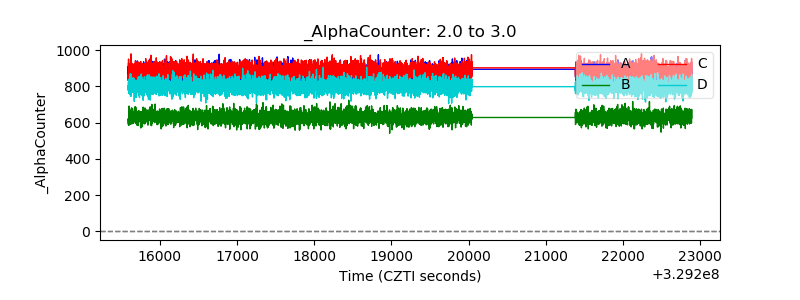 |
| _CPM_Rate | 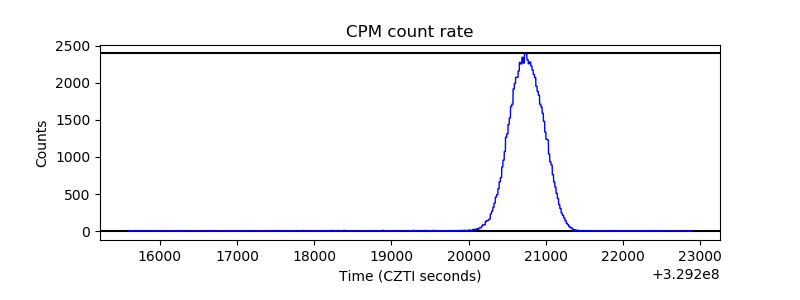 |
| CZT Counter | 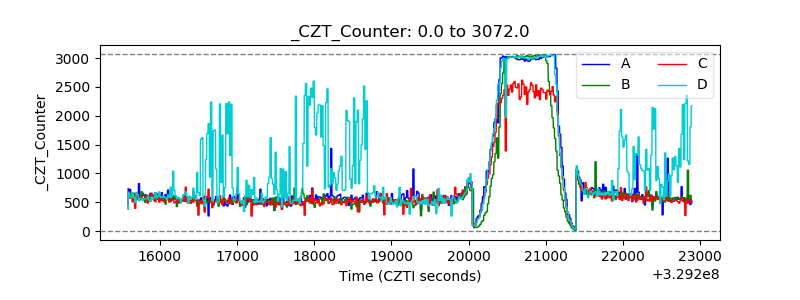 |
| +2.5 Volts monitor |  |
| +5 Volts monitor |  |
| _ROLL_ROT | 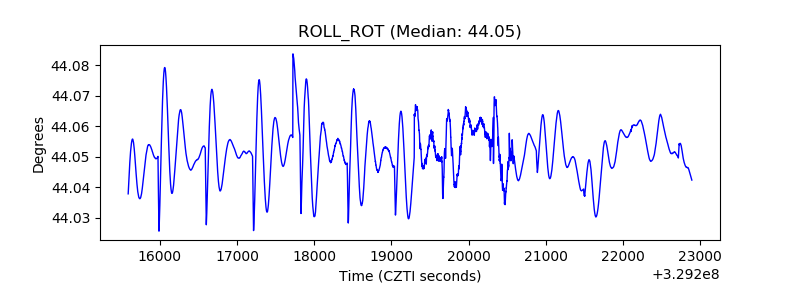 |
| _Roll_DEC | 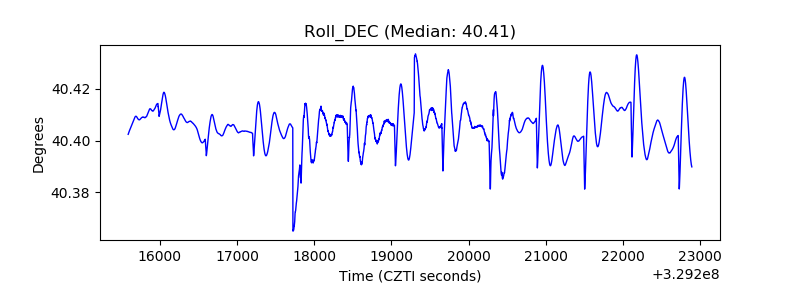 |
| _Roll_RA | 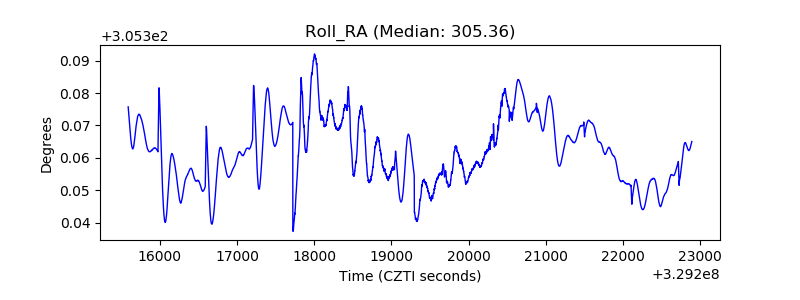 |
| Veto Counter | 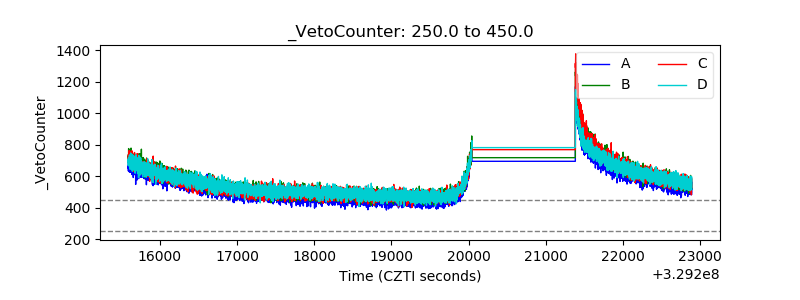 |