| Param | Original file | Final file |
|---|---|---|
| Filename | modeM0/AS1A09_104T01_9000003710_25375cztM0_level2.evt | modeM0/AS1A09_104T01_9000003710_25375cztM0_level2_quad_clean.evt |
| Size (bytes) | 529,467,840 | 74,358,720 |
| Size | 504.9 MB | 70.9 MB |
| Events in quadrant A | 3,587,565 | 468,246 |
| Events in quadrant B | 3,476,266 | 466,372 |
| Events in quadrant C | 3,436,096 | 440,169 |
| Events in quadrant D | 5,110,110 | 439,296 |
| Mode M9 | |||
|---|---|---|---|
| Quadrant | BADHDUFLAG | Total packets | Discarded packets |
| A | 0 | 13 | 0 |
| B | 0 | 13 | 0 |
| C | 0 | 13 | 0 |
| D | 0 | 13 | 0 |
| Mode M0 | |||
|---|---|---|---|
| Quadrant | BADHDUFLAG | Total packets | Discarded packets |
| A | 0 | 14442 | 0 |
| B | 0 | 14023 | 0 |
| C | 0 | 13793 | 0 |
| D | 0 | 19554 | 0 |
| Quadrant | Total seconds | Saturated seconds | Saturation percentage |
|---|---|---|---|
| A | 6265 | 128 | 2.043097% |
| B | 6266 | 125 | 1.994893% |
| C | 6266 | 136 | 2.170444% |
| D | 6265 | 357 | 5.698324% |
Noise dominated data is calculated using 1-second bins in cleaned event files. If a bin has >2000 counts, and if more than 50% of those come from <1% of pixels, then it is considered to be noise-dominated and hence unusable.
| Quadrant | # 1 sec bins | Bins with >0 counts | Bins with >2000 counts | High rate bins dominated by noise | Noise dominated (total time) | Noise dominated (detector-on time) | Marked lightcurve |
|---|---|---|---|---|---|---|---|
| A | 7605 | 6265 | 2 | 2 | 0.03% | 0.03% | 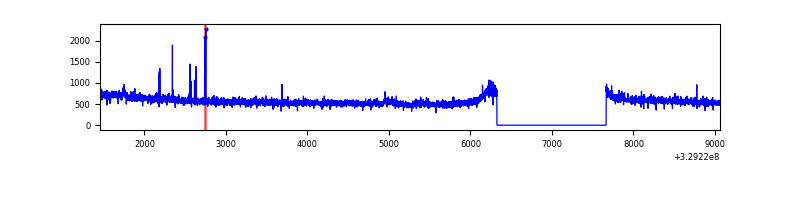 |
| B | 7606 | 6266 | 1 | 1 | 0.01% | 0.02% | 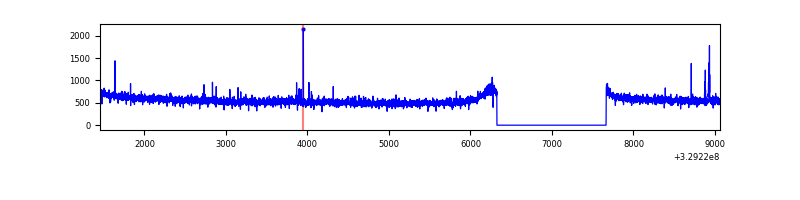 |
| C | 7606 | 6266 | 0 | 0 | 0.00% | 0.00% | 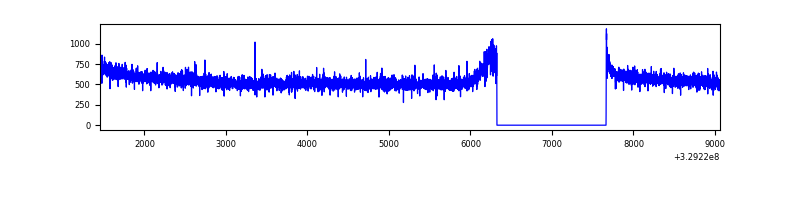 |
| D | 7605 | 6265 | 238 | 238 | 3.13% | 3.80% | 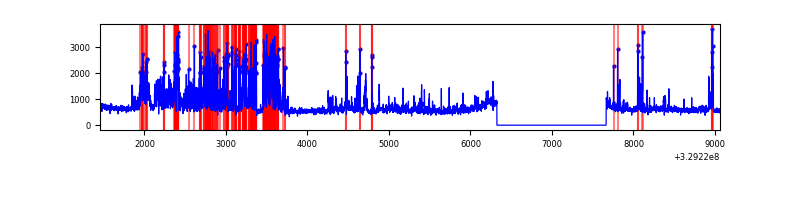 |
Top three noisy pixels from each quadrant. If the there are fewer than three noisy pixels in the level2.evt file, extra rows are filled as -1
| Pixel properties | Quadrant properties | ||||||
|---|---|---|---|---|---|---|---|
| Quadrant | DetID | PixID | Counts | Sigma | Mean | Median | Sigma |
| A | 6 | 16 | 93400 | 519.67 | 902 | 887 | 178.0 |
| A | 15 | 173 | 19118 | 102.41 | 902 | 887 | 178.0 |
| A | 13 | 254 | 9205 | 46.72 | 902 | 887 | 178.0 |
| B | 0 | 190 | 19788 | 116.0 | 880 | 860 | 163.2 |
| B | 12 | 111 | 19168 | 112.2 | 880 | 860 | 163.2 |
| B | 11 | 111 | 17110 | 99.58 | 880 | 860 | 163.2 |
| C | 14 | 238 | 140476 | 728.94 | 843 | 851 | 191.5 |
| C | 3 | 233 | 9921 | 47.35 | 843 | 851 | 191.5 |
| C | 13 | 61 | 5955 | 26.65 | 843 | 851 | 191.5 |
| D | 7 | 238 | 1226545 | 5983.66 | 858 | 838 | 204.8 |
| D | 8 | 195 | 333923 | 1626.06 | 858 | 838 | 204.8 |
| D | 1 | 52 | 146897 | 713.03 | 858 | 838 | 204.8 |
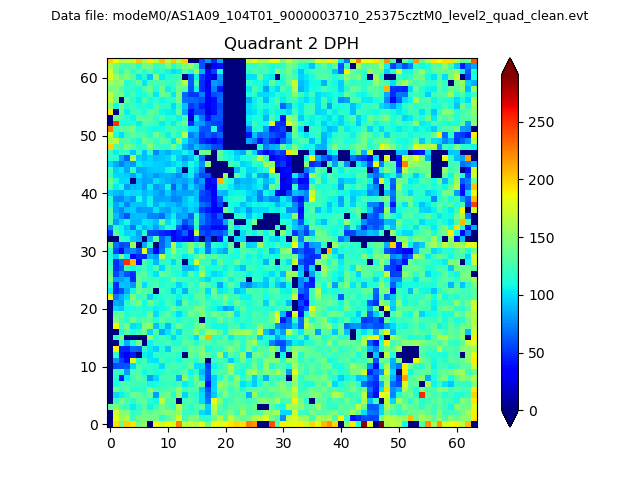
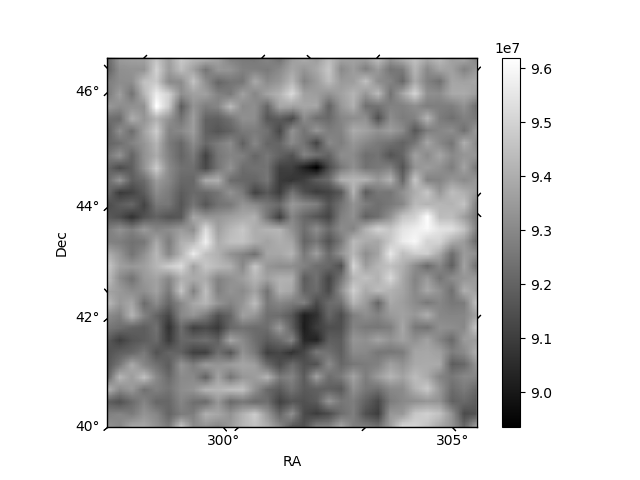
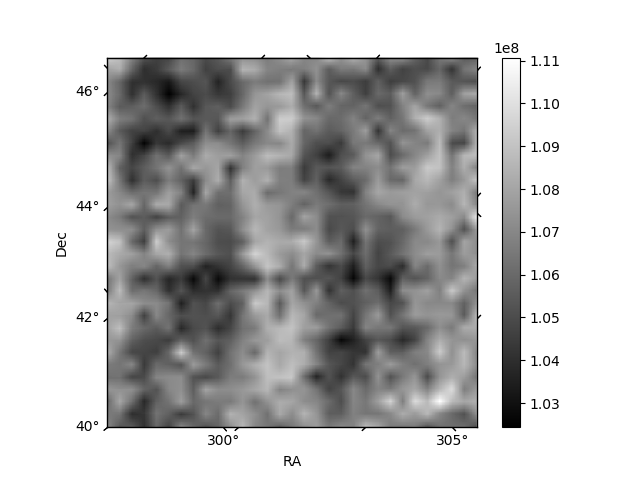
Histogram calculated using DETX and DETY for each event in the final _common_clean file
| Quadrant A | 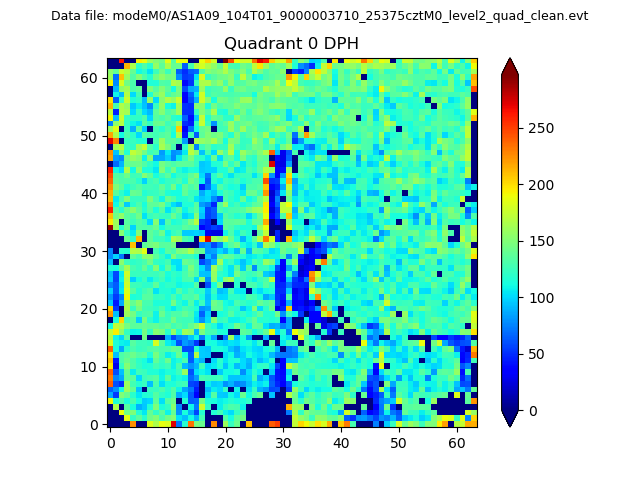 |
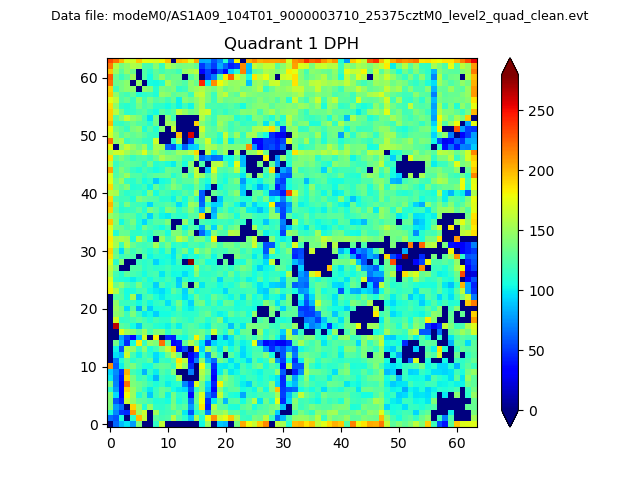 |
Quadrant B |
|---|---|---|---|
| Quadrant D | 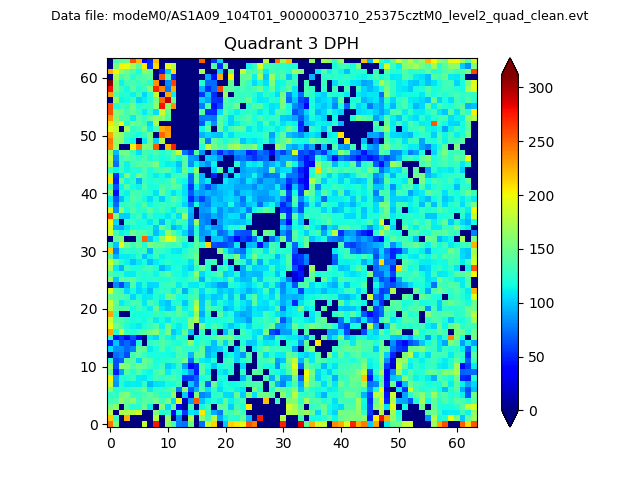 |
 |
Quadrant C |
| Plot type | Count rate plots | Images |
|---|---|---|
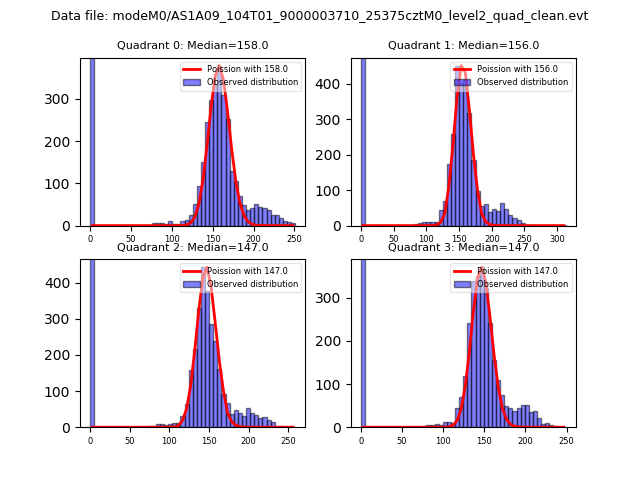
| Comparison with Poisson distribution Blue bars denote a histogram of data divided into 1 sec bins. Red curve is a Poisson curve with rate = median count rate of data. |
 |
 |
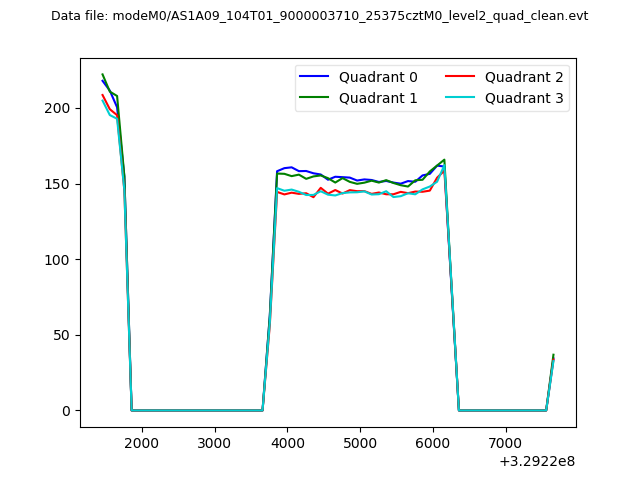
| Quadrant-wise count rates Data is divided into 100 sec bins |
 |
|
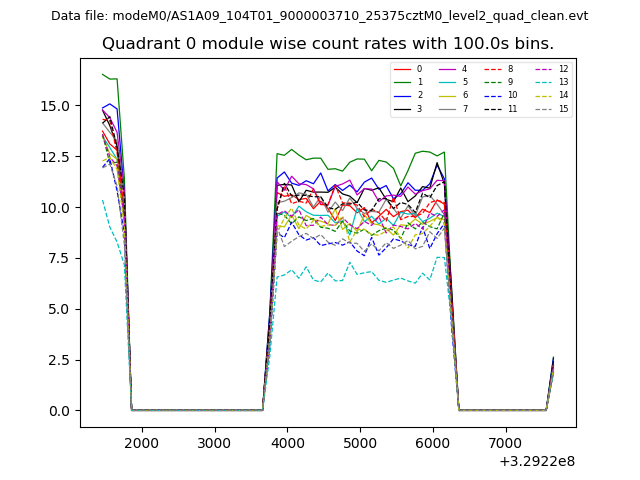
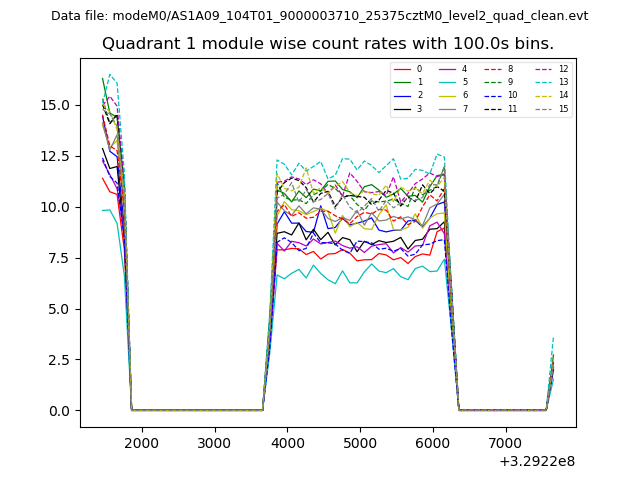
| Module-wise count rates for Quadrant A Data is divided into 100 sec bins |
 |
 |
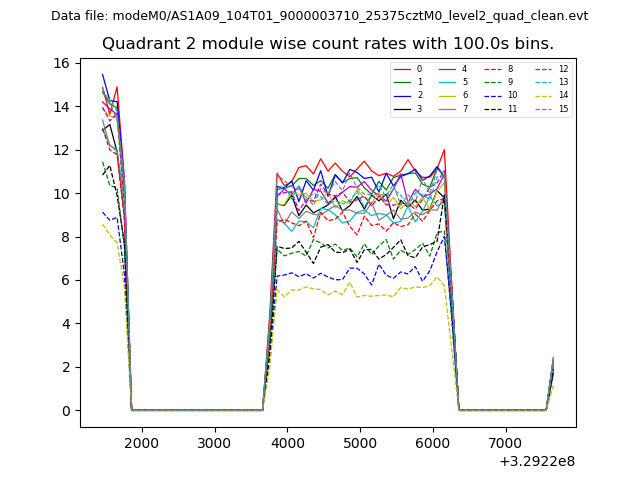
| Module-wise count rates for Quadrant B Data is divided into 100 sec bins |
 |
 |
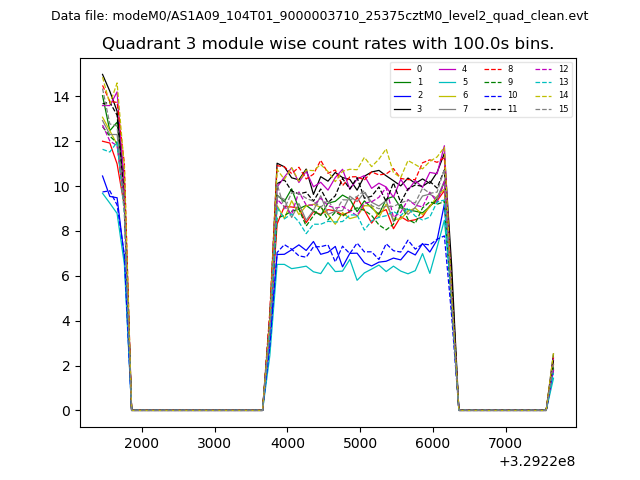
| Module-wise count rates for Quadrant C Data is divided into 100 sec bins |
 |
 |
| Module-wise count rates for Quadrant D Data is divided into 100 sec bins |
 |
 |
| Parameter | Plot |
|---|---|
| CZT HV Monitor | 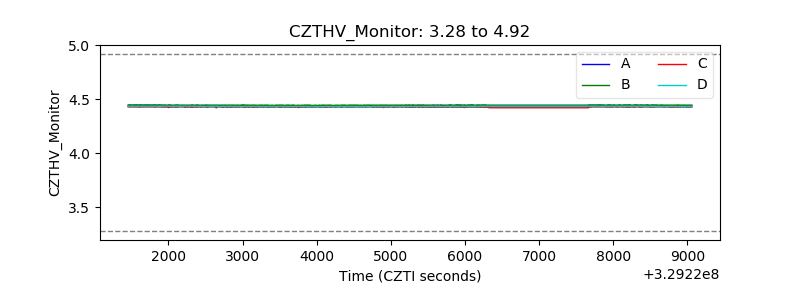 |
| D_VDD | 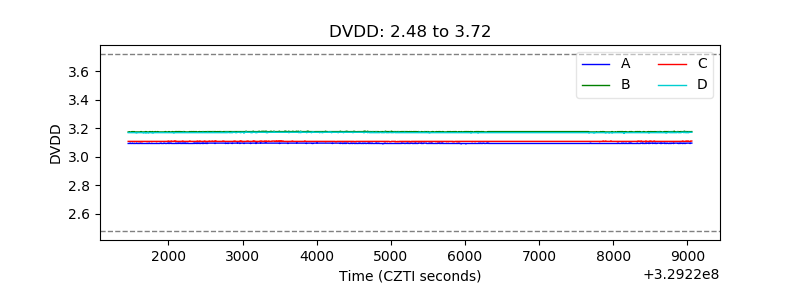 |
| Temperature 1 | 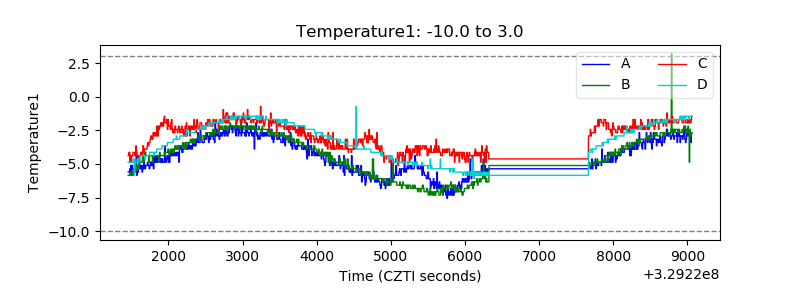 |
| Veto HV Monitor | 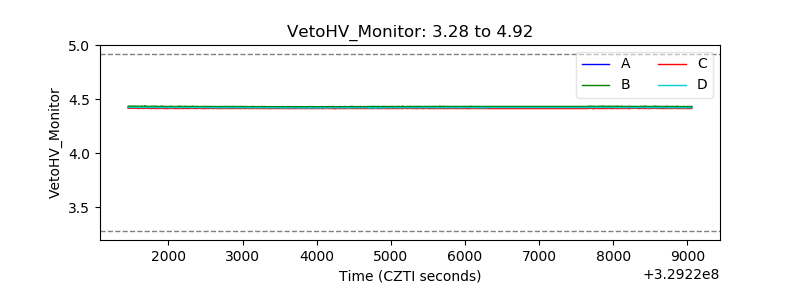 |
| Veto LLD | 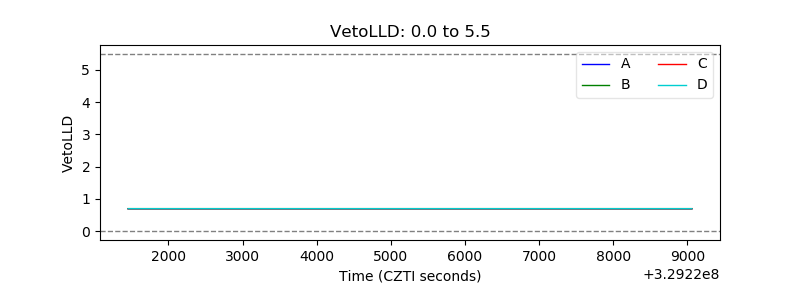 |
| Alpha Counter | 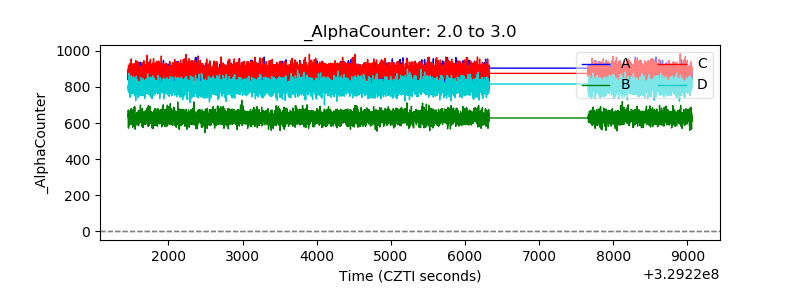 |
| _CPM_Rate | 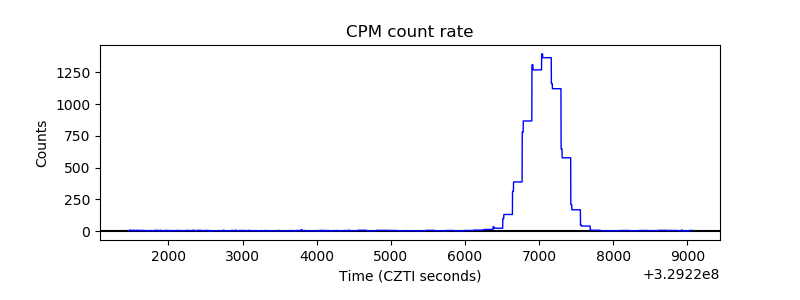 |
| CZT Counter | 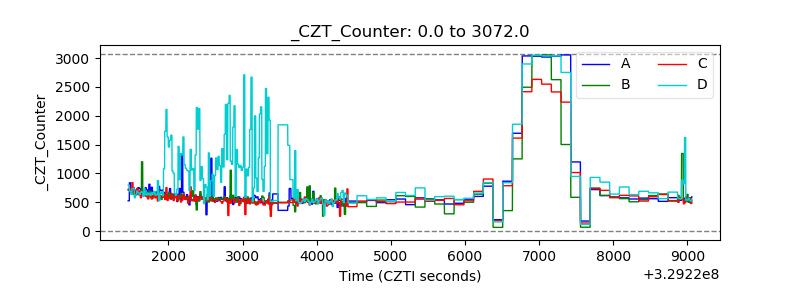 |
| +2.5 Volts monitor |  |
| +5 Volts monitor | 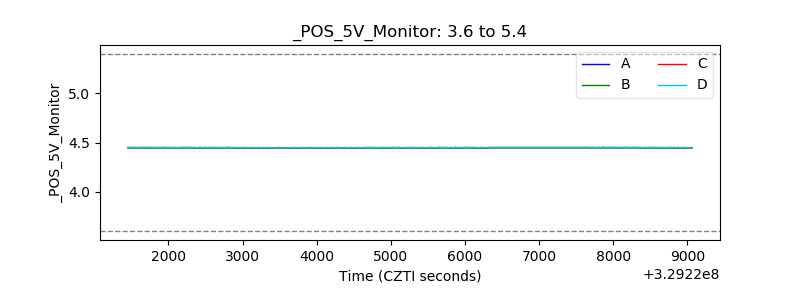 |
| _ROLL_ROT | 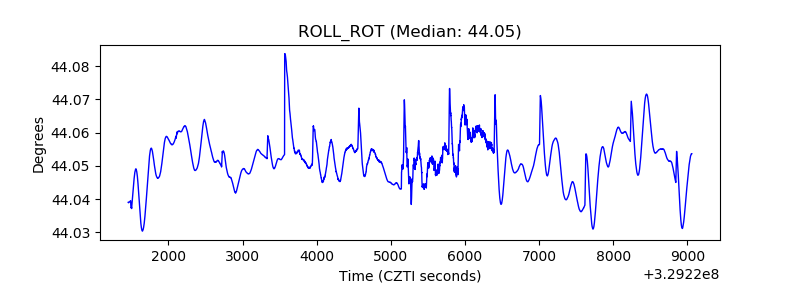 |
| _Roll_DEC | 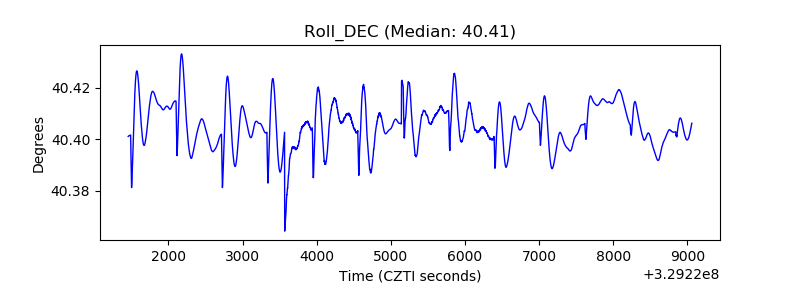 |
| _Roll_RA | 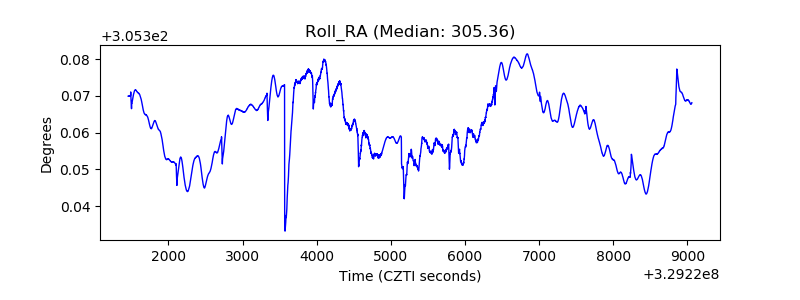 |
| Veto Counter | 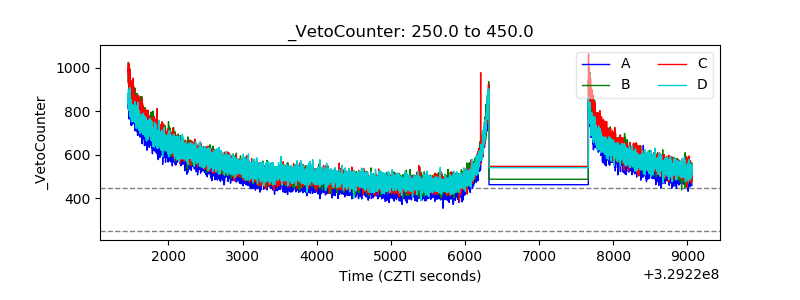 |