| Param | Original file | Final file |
|---|---|---|
| Filename | modeM0/AS1A09_104T01_9000003710_25376cztM0_level2.evt | modeM0/AS1A09_104T01_9000003710_25376cztM0_level2_quad_clean.evt |
| Size (bytes) | 525,772,800 | 73,647,360 |
| Size | 501.4 MB | 70.2 MB |
| Events in quadrant A | 3,535,452 | 459,947 |
| Events in quadrant B | 3,547,695 | 455,955 |
| Events in quadrant C | 3,497,648 | 434,488 |
| Events in quadrant D | 4,895,076 | 419,856 |
| Mode M9 | |||
|---|---|---|---|
| Quadrant | BADHDUFLAG | Total packets | Discarded packets |
| A | 0 | 13 | 0 |
| B | 0 | 14 | 0 |
| C | 0 | 14 | 0 |
| D | 0 | 14 | 0 |
| Mode M0 | |||
|---|---|---|---|
| Quadrant | BADHDUFLAG | Total packets | Discarded packets |
| A | 0 | 14321 | 0 |
| B | 0 | 14355 | 0 |
| C | 0 | 14120 | 0 |
| D | 0 | 18925 | 0 |
| Quadrant | Total seconds | Saturated seconds | Saturation percentage |
|---|---|---|---|
| A | 6583 | 132 | 2.005165% |
| B | 6583 | 142 | 2.157071% |
| C | 6583 | 157 | 2.384931% |
| D | 6583 | 390 | 5.924351% |
Noise dominated data is calculated using 1-second bins in cleaned event files. If a bin has >2000 counts, and if more than 50% of those come from <1% of pixels, then it is considered to be noise-dominated and hence unusable.
| Quadrant | # 1 sec bins | Bins with >0 counts | Bins with >2000 counts | High rate bins dominated by noise | Noise dominated (total time) | Noise dominated (detector-on time) | Marked lightcurve |
|---|---|---|---|---|---|---|---|
| A | 7733 | 6583 | 0 | 0 | 0.00% | 0.00% | 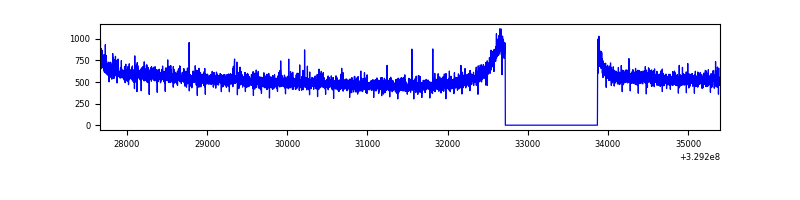 |
| B | 7733 | 6583 | 1 | 1 | 0.01% | 0.02% | 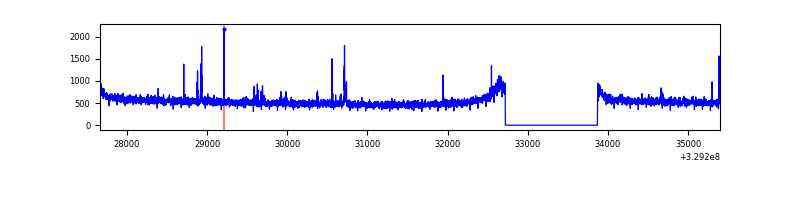 |
| C | 7733 | 6583 | 0 | 0 | 0.00% | 0.00% | 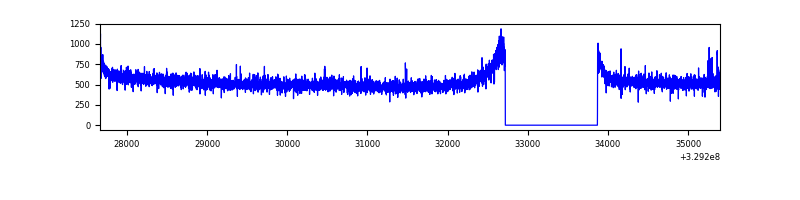 |
| D | 7733 | 6583 | 303 | 303 | 3.92% | 4.60% | 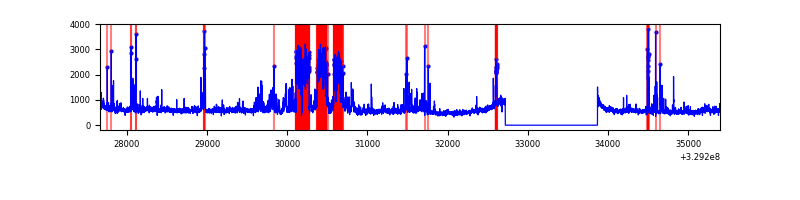 |
Top three noisy pixels from each quadrant. If the there are fewer than three noisy pixels in the level2.evt file, extra rows are filled as -1
| Pixel properties | Quadrant properties | ||||||
|---|---|---|---|---|---|---|---|
| Quadrant | DetID | PixID | Counts | Sigma | Mean | Median | Sigma |
| A | 6 | 16 | 16460 | 86.93 | 911 | 896 | 179.0 |
| A | 13 | 254 | 10320 | 52.64 | 911 | 896 | 179.0 |
| A | 0 | 226 | 7863 | 38.91 | 911 | 896 | 179.0 |
| B | 0 | 190 | 37956 | 221.18 | 890 | 870 | 167.7 |
| B | 0 | 245 | 21928 | 125.59 | 890 | 870 | 167.7 |
| B | 12 | 111 | 19922 | 113.63 | 890 | 870 | 167.7 |
| C | 14 | 238 | 140210 | 704.08 | 858 | 867 | 197.9 |
| C | 0 | 207 | 8924 | 40.71 | 858 | 867 | 197.9 |
| C | 13 | 61 | 6050 | 26.19 | 858 | 867 | 197.9 |
| D | 7 | 238 | 929313 | 4411.51 | 871 | 847 | 210.5 |
| D | 8 | 195 | 513914 | 2437.79 | 871 | 847 | 210.5 |
| D | 1 | 52 | 73402 | 344.74 | 871 | 847 | 210.5 |
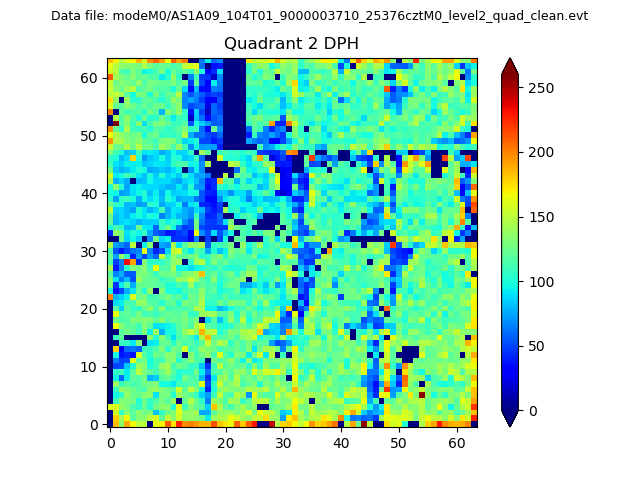
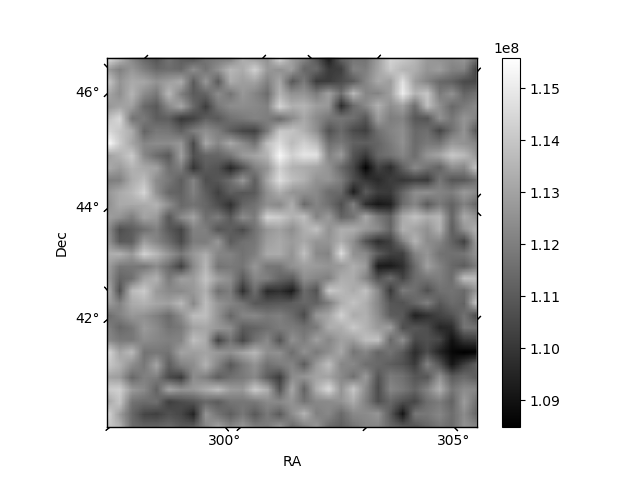
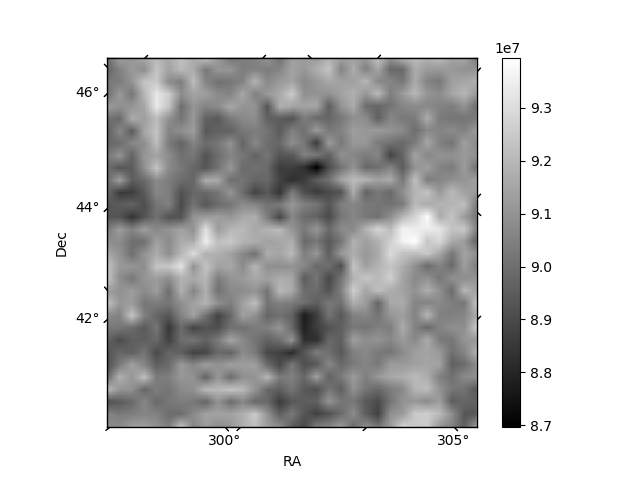
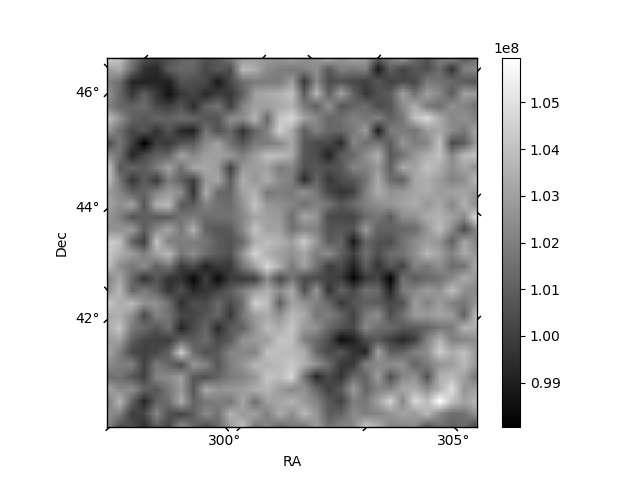
Histogram calculated using DETX and DETY for each event in the final _common_clean file
| Quadrant A | 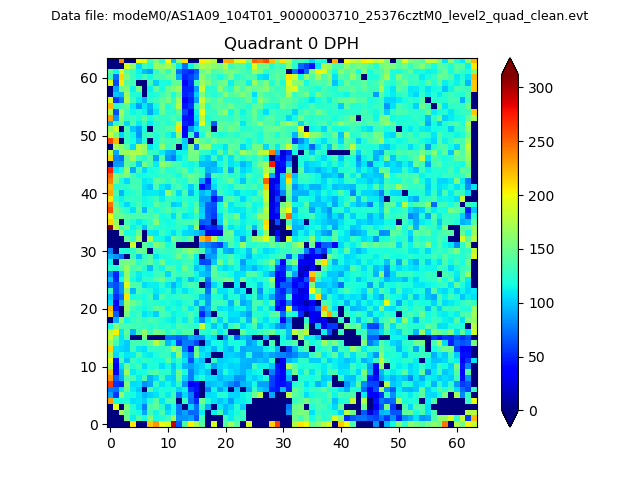 |
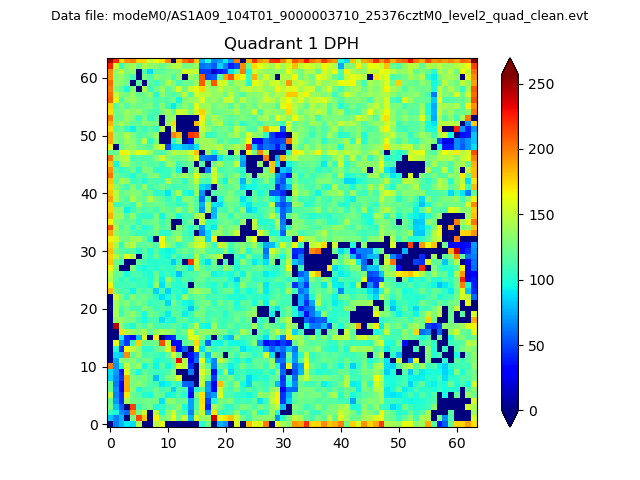 |
Quadrant B |
|---|---|---|---|
| Quadrant D | 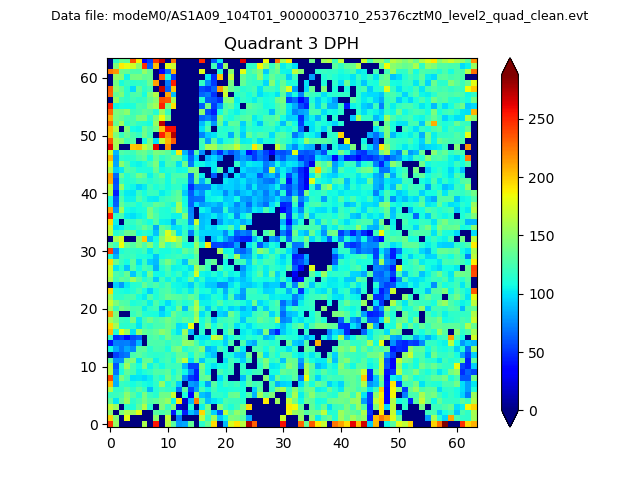 |
 |
Quadrant C |
| Plot type | Count rate plots | Images |
|---|---|---|
| Comparison with Poisson distribution Blue bars denote a histogram of data divided into 1 sec bins. Red curve is a Poisson curve with rate = median count rate of data. |
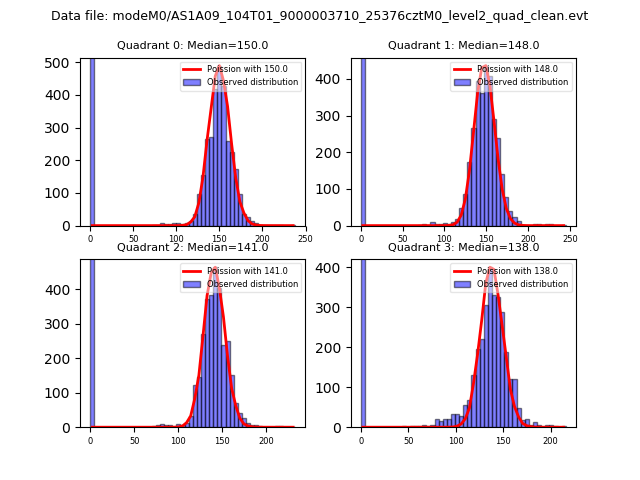 |
 |
| Quadrant-wise count rates Data is divided into 100 sec bins |
 |
|
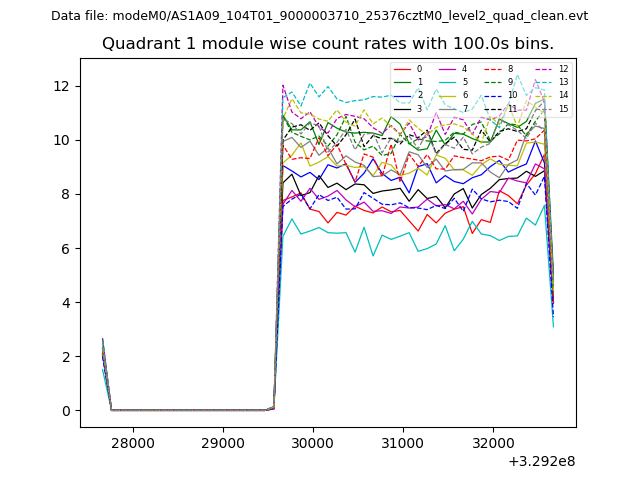
| Module-wise count rates for Quadrant A Data is divided into 100 sec bins |
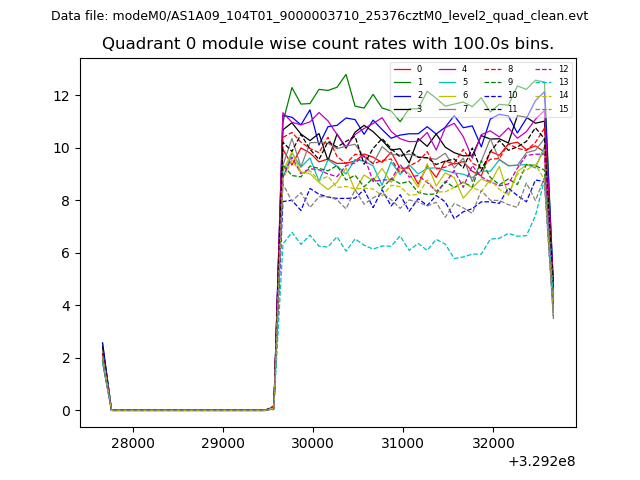 |
 |
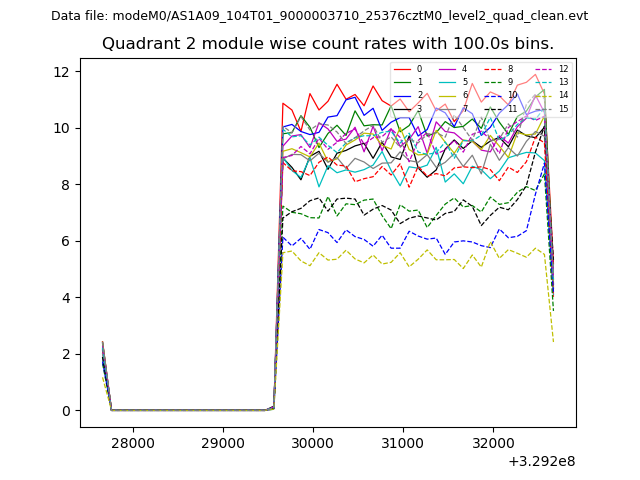
| Module-wise count rates for Quadrant B Data is divided into 100 sec bins |
 |
 |
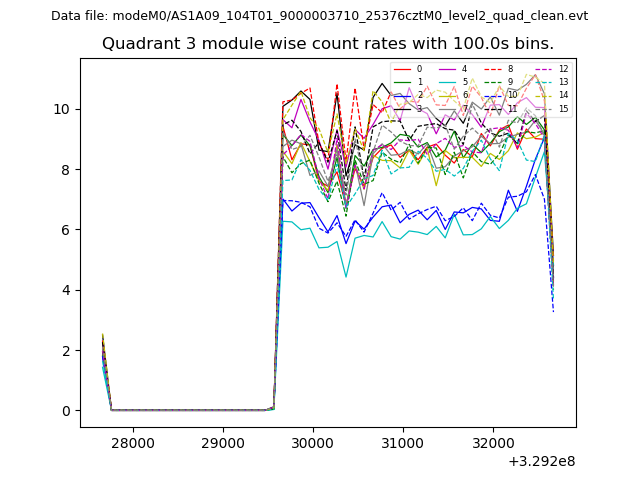
| Module-wise count rates for Quadrant C Data is divided into 100 sec bins |
 |
 |
| Module-wise count rates for Quadrant D Data is divided into 100 sec bins |
 |
 |
| Parameter | Plot |
|---|---|
| CZT HV Monitor | 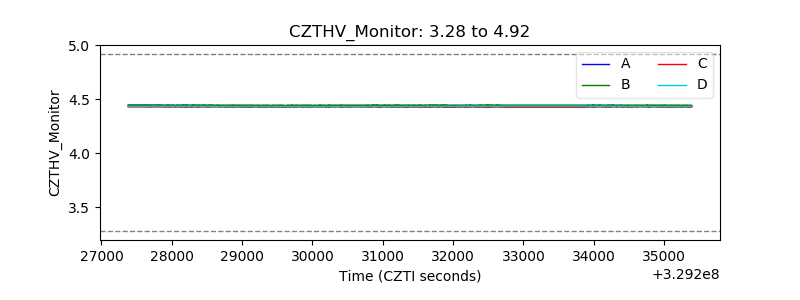 |
| D_VDD | 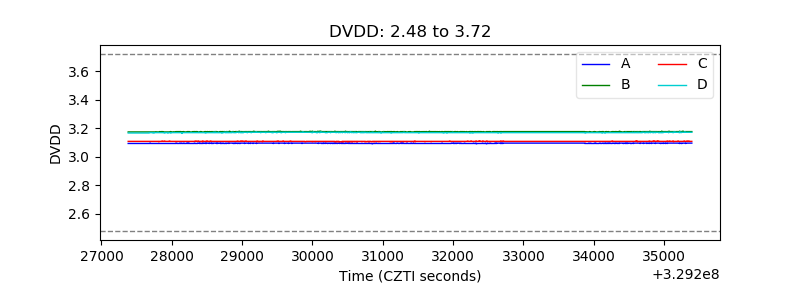 |
| Temperature 1 | 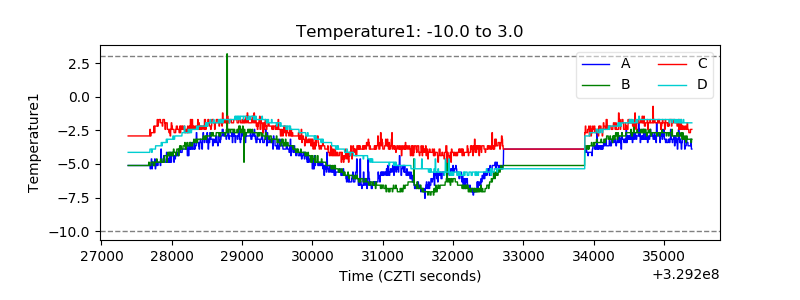 |
| Veto HV Monitor | 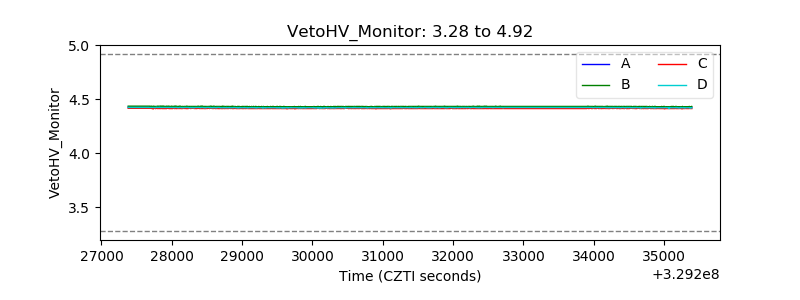 |
| Veto LLD | 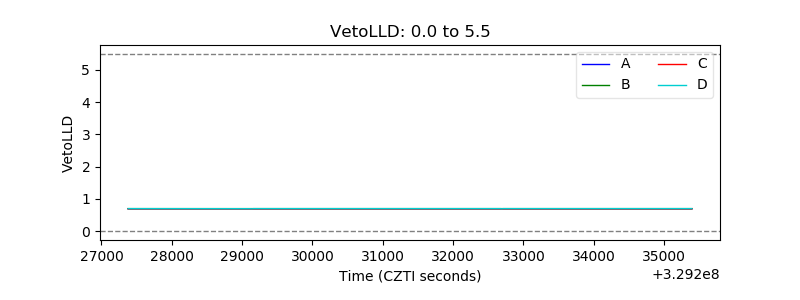 |
| Alpha Counter | 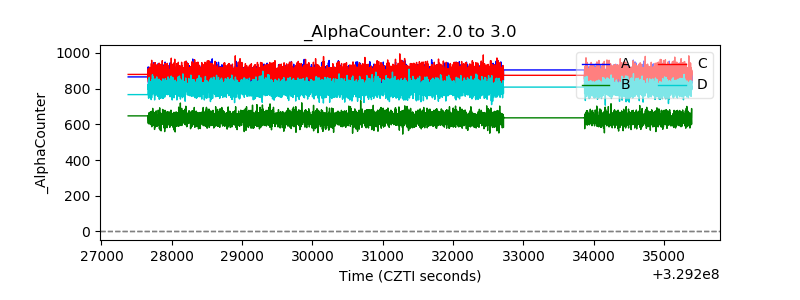 |
| _CPM_Rate | 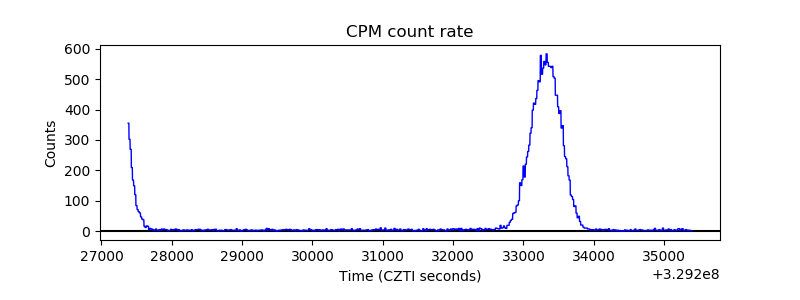 |
| CZT Counter | 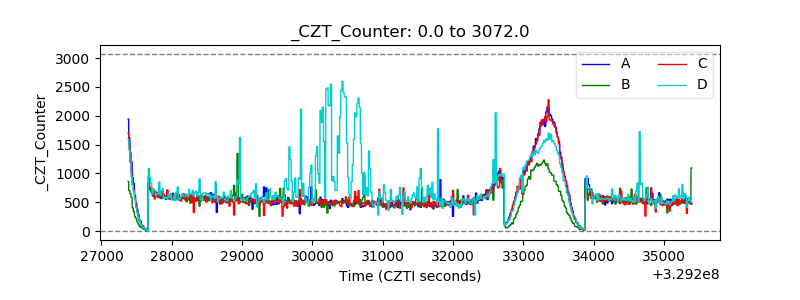 |
| +2.5 Volts monitor |  |
| +5 Volts monitor |  |
| _ROLL_ROT | 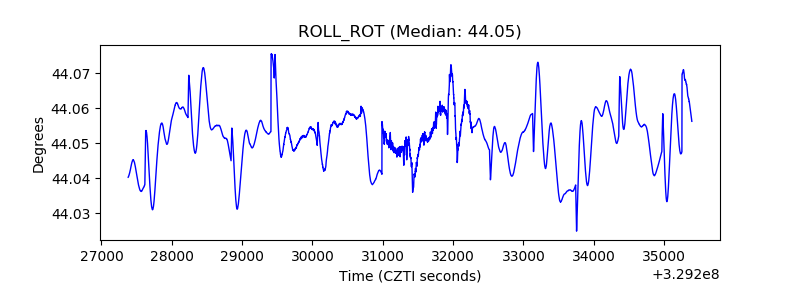 |
| _Roll_DEC | 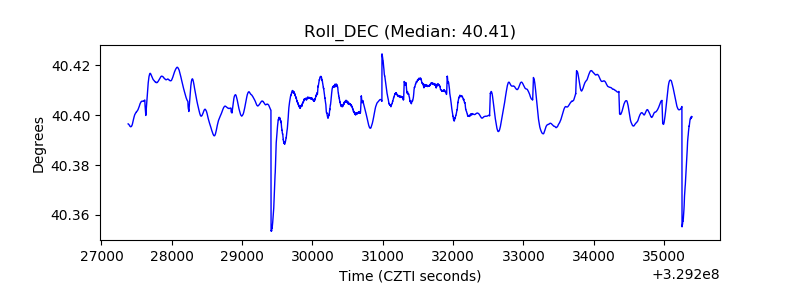 |
| _Roll_RA | 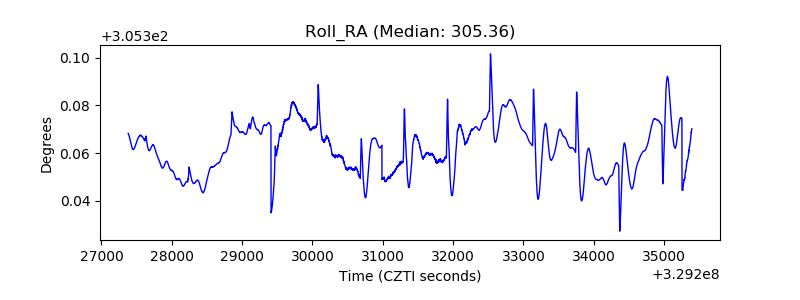 |
| Veto Counter | 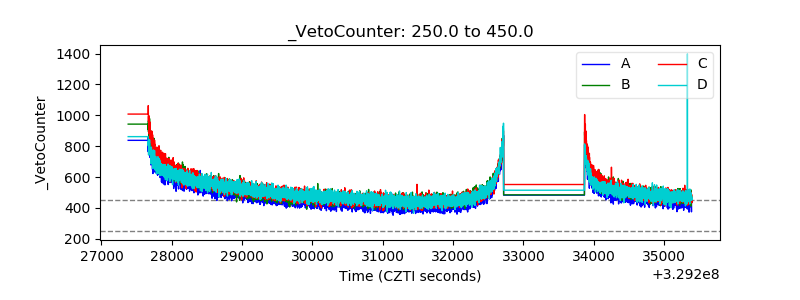 |