| Param | Original file | Final file |
|---|---|---|
| Filename | modeM0/AS1A09_104T01_9000003710_25377cztM0_level2.evt | modeM0/AS1A09_104T01_9000003710_25377cztM0_level2_quad_clean.evt |
| Size (bytes) | 520,280,640 | 85,587,840 |
| Size | 496.2 MB | 81.6 MB |
| Events in quadrant A | 3,430,977 | 545,015 |
| Events in quadrant B | 3,462,850 | 543,591 |
| Events in quadrant C | 3,467,531 | 517,794 |
| Events in quadrant D | 4,934,309 | 511,943 |
| Mode M9 | |||
|---|---|---|---|
| Quadrant | BADHDUFLAG | Total packets | Discarded packets |
| A | 0 | 12 | 0 |
| B | 0 | 13 | 0 |
| C | 0 | 13 | 0 |
| D | 0 | 13 | 0 |
| Mode M0 | |||
|---|---|---|---|
| Quadrant | BADHDUFLAG | Total packets | Discarded packets |
| A | 0 | 14218 | 0 |
| B | 0 | 14321 | 0 |
| C | 0 | 14248 | 0 |
| D | 0 | 19019 | 0 |
| Quadrant | Total seconds | Saturated seconds | Saturation percentage |
|---|---|---|---|
| A | 6791 | 88 | 1.295833% |
| B | 6791 | 108 | 1.590340% |
| C | 6791 | 148 | 2.179355% |
| D | 6791 | 621 | 9.144456% |
Noise dominated data is calculated using 1-second bins in cleaned event files. If a bin has >2000 counts, and if more than 50% of those come from <1% of pixels, then it is considered to be noise-dominated and hence unusable.
| Quadrant | # 1 sec bins | Bins with >0 counts | Bins with >2000 counts | High rate bins dominated by noise | Noise dominated (total time) | Noise dominated (detector-on time) | Marked lightcurve |
|---|---|---|---|---|---|---|---|
| A | 7621 | 6791 | 0 | 0 | 0.00% | 0.00% | 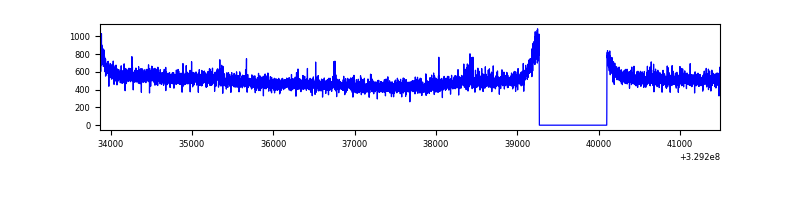 |
| B | 7621 | 6791 | 1 | 1 | 0.01% | 0.01% | 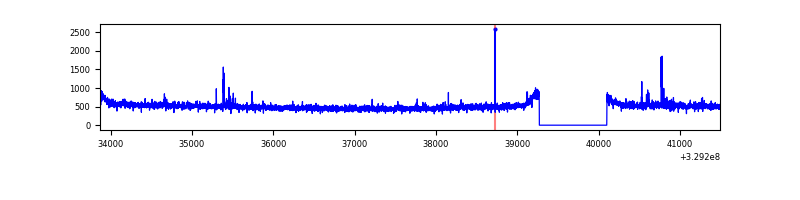 |
| C | 7621 | 6791 | 5 | 5 | 0.07% | 0.07% | 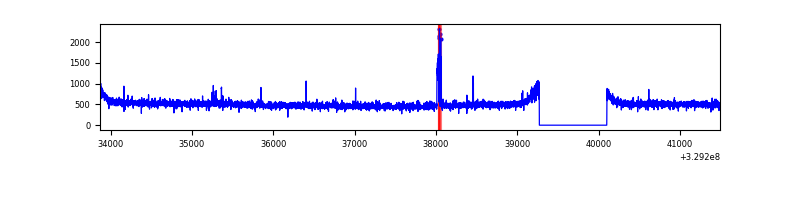 |
| D | 7620 | 6790 | 456 | 456 | 5.98% | 6.72% | 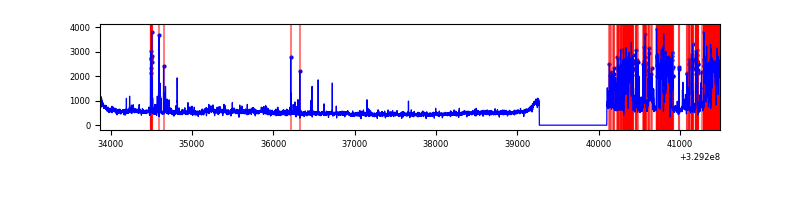 |
Top three noisy pixels from each quadrant. If the there are fewer than three noisy pixels in the level2.evt file, extra rows are filled as -1
| Pixel properties | Quadrant properties | ||||||
|---|---|---|---|---|---|---|---|
| Quadrant | DetID | PixID | Counts | Sigma | Mean | Median | Sigma |
| A | 6 | 16 | 27147 | 149.0 | 882 | 866 | 176.4 |
| A | 13 | 254 | 11382 | 59.62 | 882 | 866 | 176.4 |
| A | 3 | 137 | 7836 | 39.52 | 882 | 866 | 176.4 |
| B | 0 | 190 | 37210 | 222.59 | 867 | 845 | 163.4 |
| B | 12 | 111 | 19636 | 115.02 | 867 | 845 | 163.4 |
| B | 11 | 111 | 18090 | 105.56 | 867 | 845 | 163.4 |
| C | 14 | 238 | 133961 | 683.75 | 836 | 842 | 194.7 |
| C | 9 | 54 | 50017 | 252.58 | 836 | 842 | 194.7 |
| C | 0 | 207 | 16440 | 80.12 | 836 | 842 | 194.7 |
| D | 7 | 238 | 1434738 | 7192.52 | 823 | 798 | 199.4 |
| D | 8 | 195 | 289071 | 1445.95 | 823 | 798 | 199.4 |
| D | 2 | 244 | 53430 | 264.0 | 823 | 798 | 199.4 |
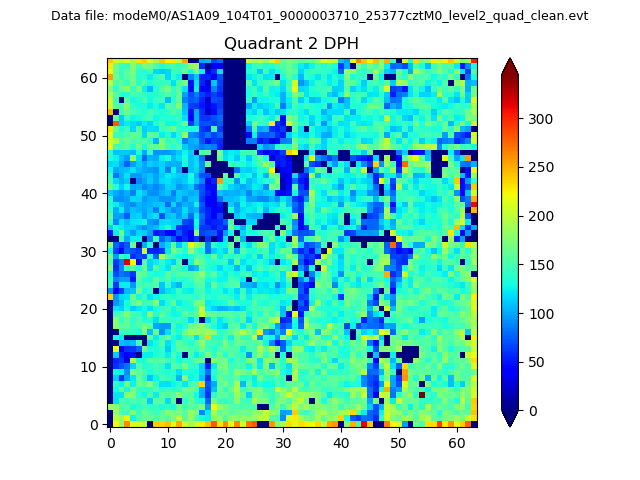
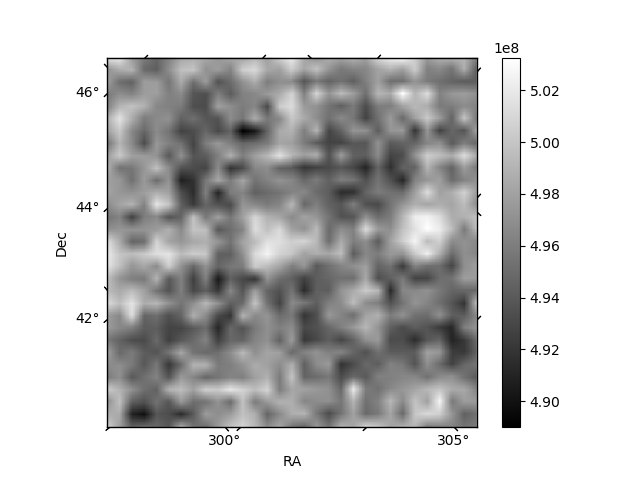
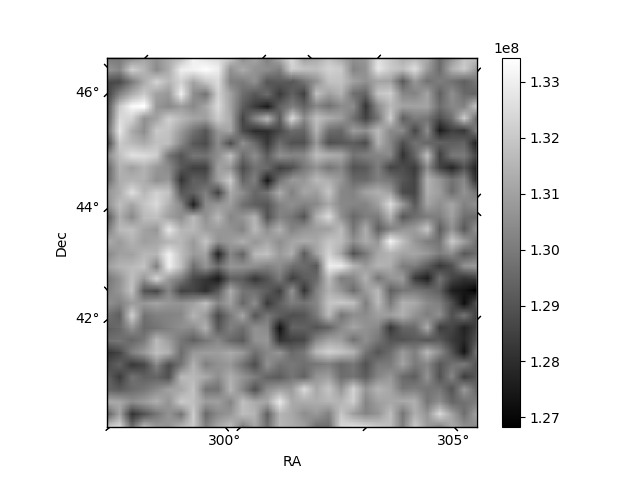
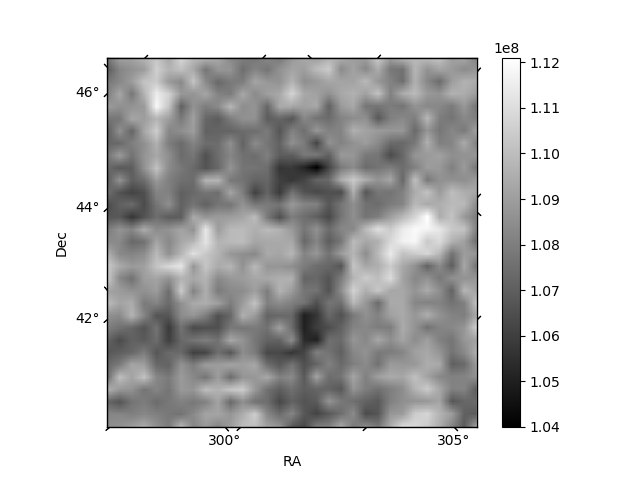
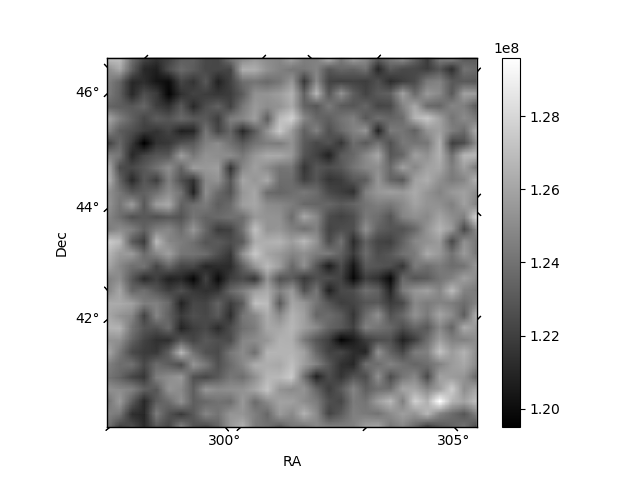
Histogram calculated using DETX and DETY for each event in the final _common_clean file
| Quadrant A | 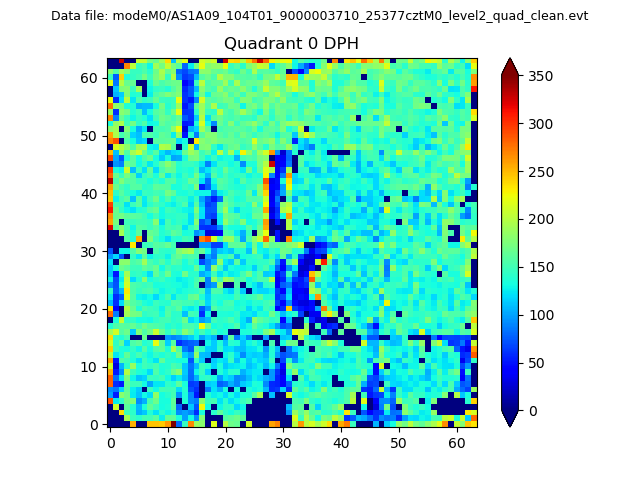 |
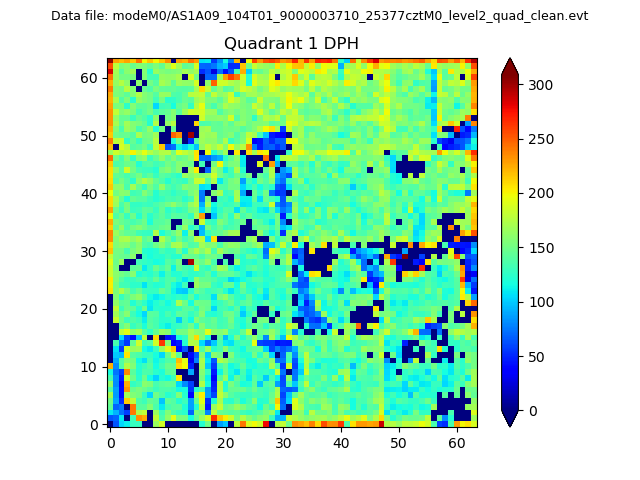 |
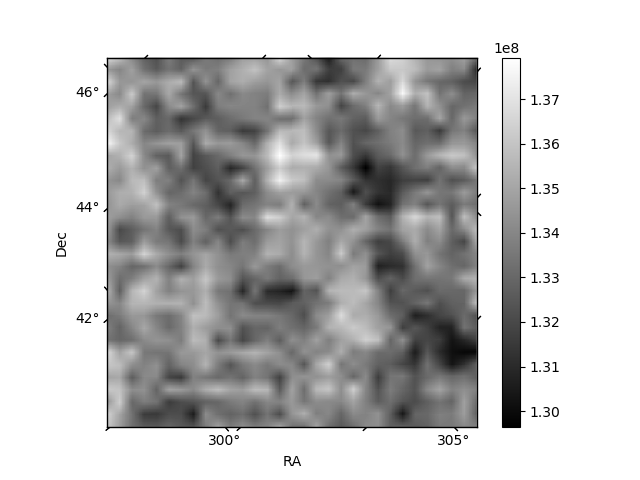
Quadrant B |
|---|---|---|---|
| Quadrant D | 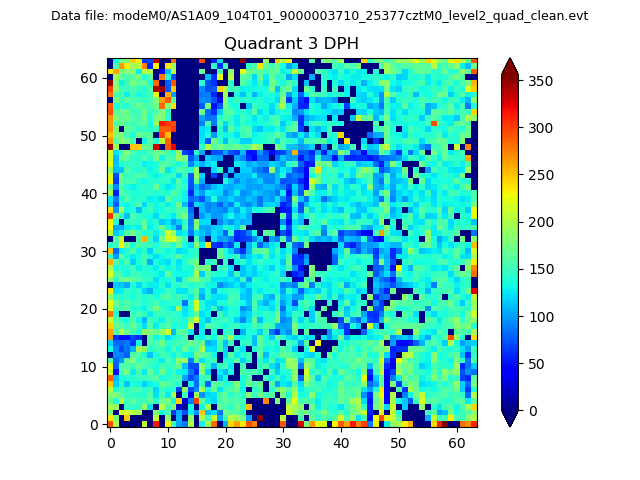 |
 |
Quadrant C |
| Plot type | Count rate plots | Images |
|---|---|---|
| Comparison with Poisson distribution Blue bars denote a histogram of data divided into 1 sec bins. Red curve is a Poisson curve with rate = median count rate of data. |
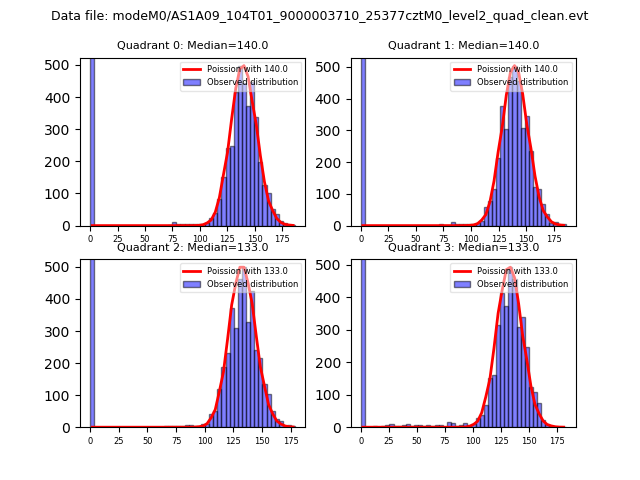 |
 |
| Quadrant-wise count rates Data is divided into 100 sec bins |
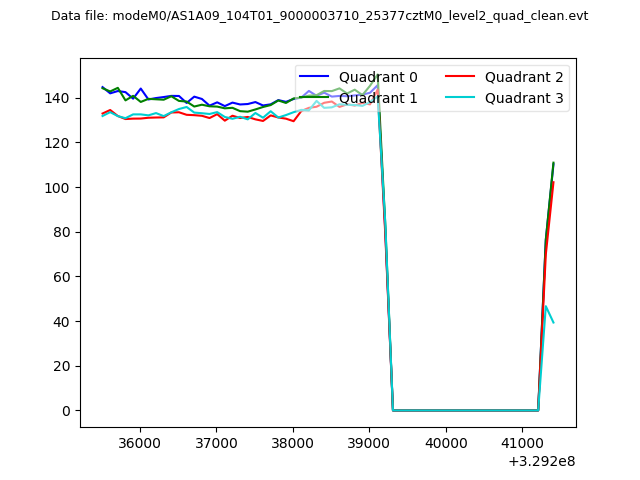 |
|
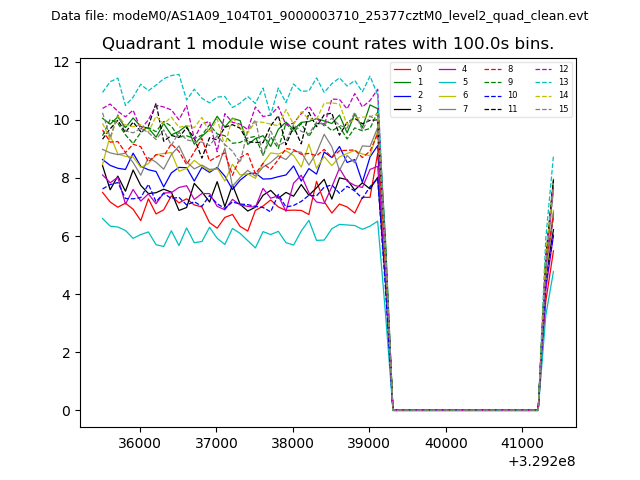
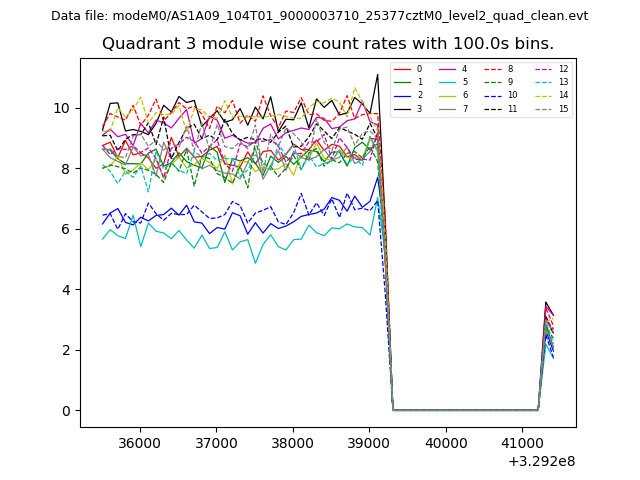
| Module-wise count rates for Quadrant A Data is divided into 100 sec bins |
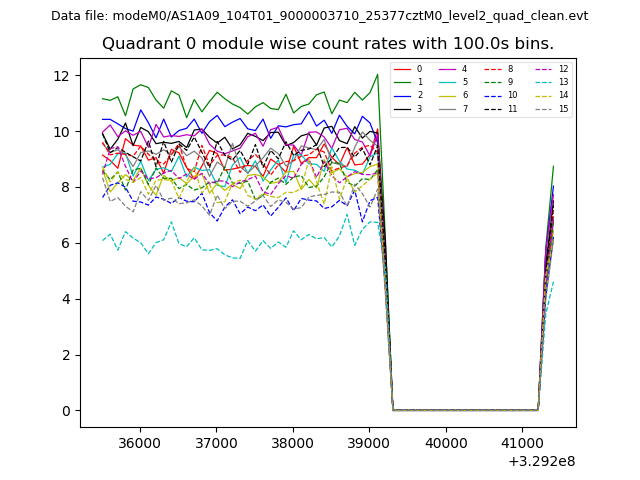 |
 |
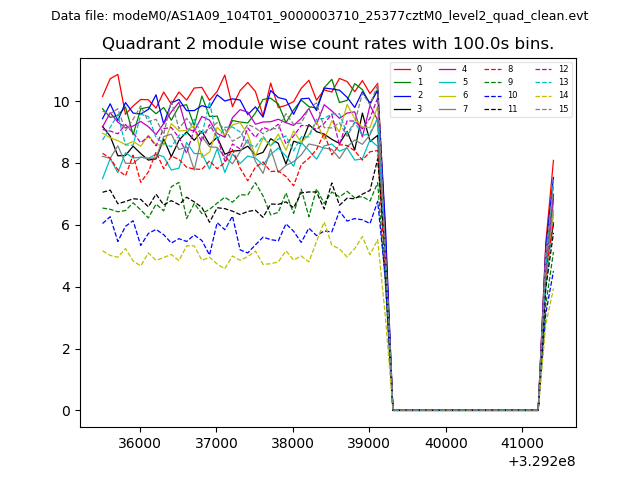
| Module-wise count rates for Quadrant B Data is divided into 100 sec bins |
 |
 |
| Module-wise count rates for Quadrant C Data is divided into 100 sec bins |
 |
 |
| Module-wise count rates for Quadrant D Data is divided into 100 sec bins |
 |
 |
| Parameter | Plot |
|---|---|
| CZT HV Monitor | 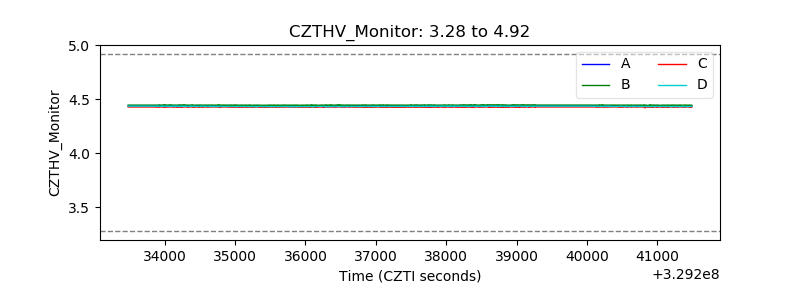 |
| D_VDD | 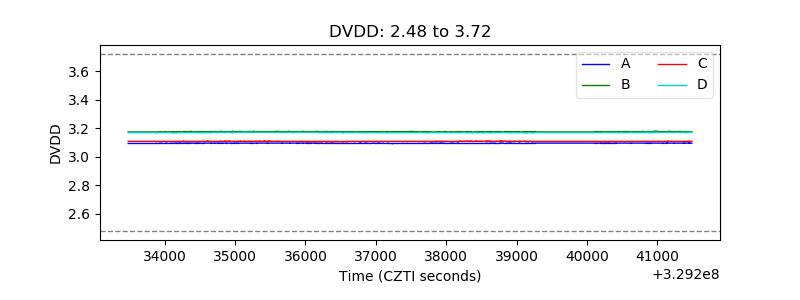 |
| Temperature 1 | 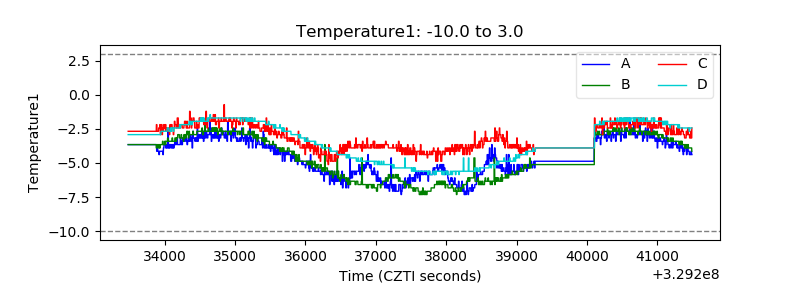 |
| Veto HV Monitor | 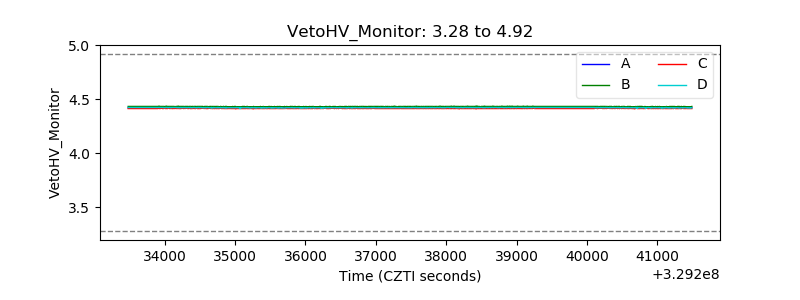 |
| Veto LLD | 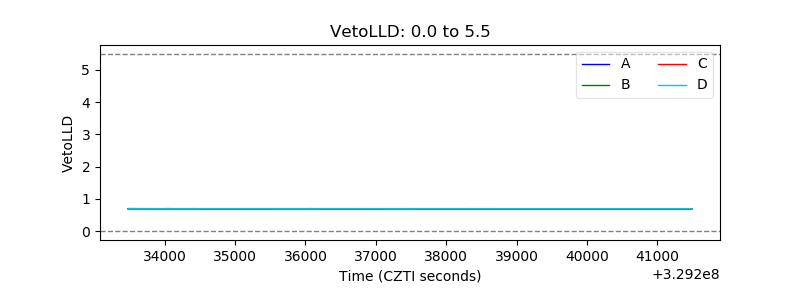 |
| Alpha Counter |  |
| _CPM_Rate | 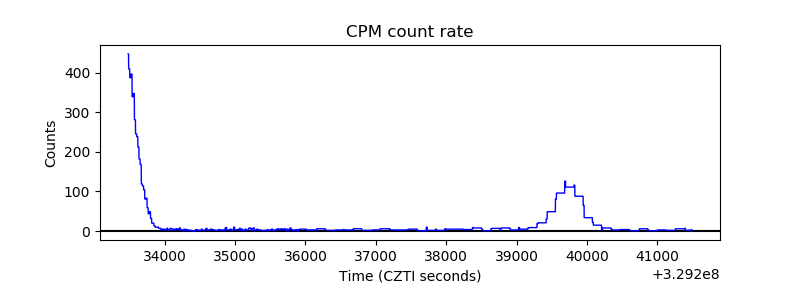 |
| CZT Counter | 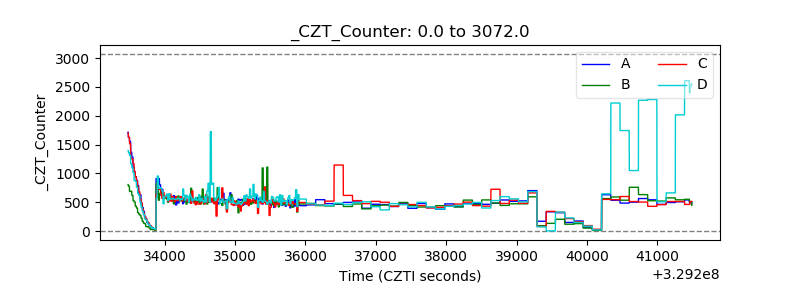 |
| +2.5 Volts monitor |  |
| +5 Volts monitor |  |
| _ROLL_ROT | 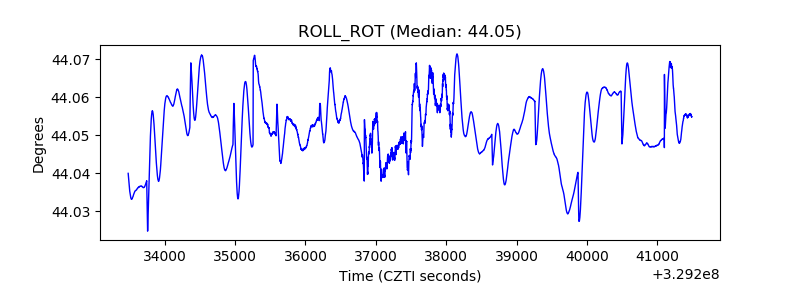 |
| _Roll_DEC | 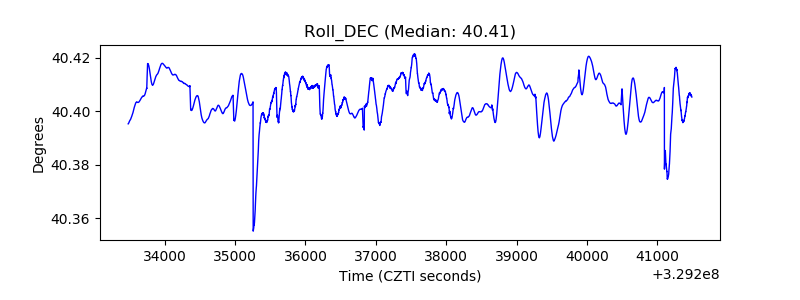 |
| _Roll_RA | 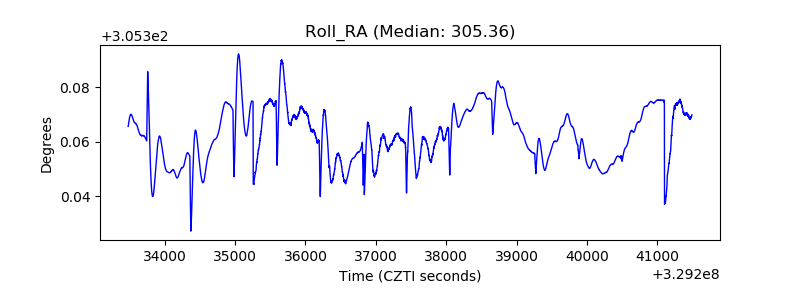 |
| Veto Counter | 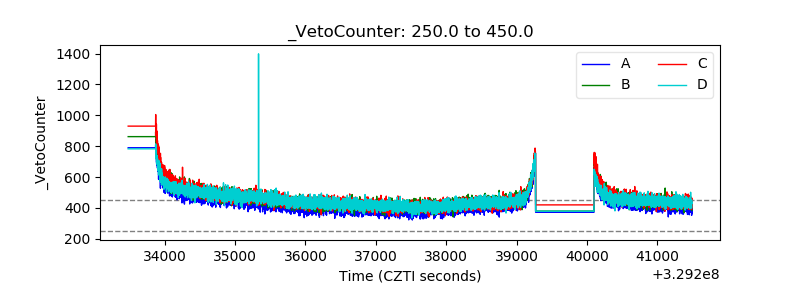 |