| Param | Original file | Final file |
|---|---|---|
| Filename | modeM0/AS1A09_104T01_9000003710_25378cztM0_level2.evt | modeM0/AS1A09_104T01_9000003710_25378cztM0_level2_quad_clean.evt |
| Size (bytes) | 649,356,480 | 90,524,160 |
| Size | 619.3 MB | 86.3 MB |
| Events in quadrant A | 3,601,305 | 592,931 |
| Events in quadrant B | 3,629,327 | 592,693 |
| Events in quadrant C | 3,567,415 | 562,443 |
| Events in quadrant D | 8,370,121 | 481,719 |
| Mode M9 | |||
|---|---|---|---|
| Quadrant | BADHDUFLAG | Total packets | Discarded packets |
| A | 0 | 6 | 0 |
| B | 0 | 7 | 0 |
| C | 0 | 7 | 0 |
| D | 0 | 7 | 0 |
| Mode M0 | |||
|---|---|---|---|
| Quadrant | BADHDUFLAG | Total packets | Discarded packets |
| A | 0 | 15251 | 0 |
| B | 0 | 15356 | 0 |
| C | 0 | 15146 | 0 |
| D | 0 | 29735 | 0 |
| Quadrant | Total seconds | Saturated seconds | Saturation percentage |
|---|---|---|---|
| A | 7336 | 107 | 1.458561% |
| B | 7336 | 162 | 2.208288% |
| C | 7336 | 190 | 2.589967% |
| D | 7336 | 1773 | 24.168484% |
Noise dominated data is calculated using 1-second bins in cleaned event files. If a bin has >2000 counts, and if more than 50% of those come from <1% of pixels, then it is considered to be noise-dominated and hence unusable.
| Quadrant | # 1 sec bins | Bins with >0 counts | Bins with >2000 counts | High rate bins dominated by noise | Noise dominated (total time) | Noise dominated (detector-on time) | Marked lightcurve |
|---|---|---|---|---|---|---|---|
| A | 7681 | 7337 | 0 | 0 | 0.00% | 0.00% | 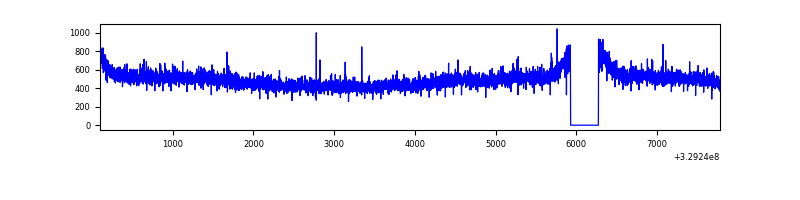 |
| B | 7681 | 7336 | 0 | 0 | 0.00% | 0.00% | 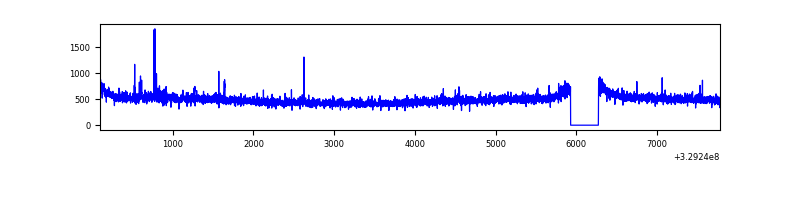 |
| C | 7681 | 7337 | 0 | 0 | 0.00% | 0.00% | 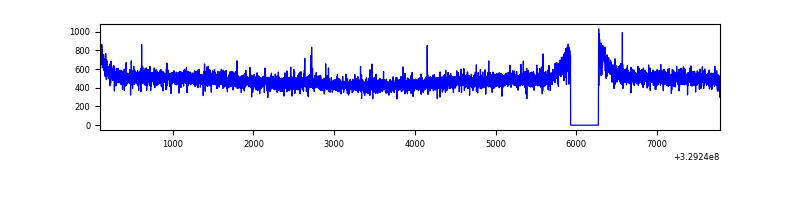 |
| D | 7681 | 7337 | 1609 | 1609 | 20.95% | 21.93% | 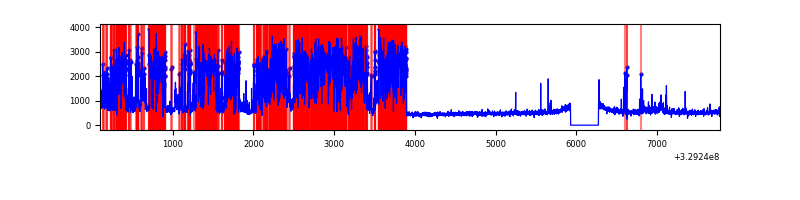 |
Top three noisy pixels from each quadrant. If the there are fewer than three noisy pixels in the level2.evt file, extra rows are filled as -1
| Pixel properties | Quadrant properties | ||||||
|---|---|---|---|---|---|---|---|
| Quadrant | DetID | PixID | Counts | Sigma | Mean | Median | Sigma |
| A | 6 | 16 | 25230 | 130.74 | 925 | 905 | 186.1 |
| A | 13 | 254 | 14181 | 71.36 | 925 | 905 | 186.1 |
| A | 3 | 137 | 8852 | 42.71 | 925 | 905 | 186.1 |
| B | 0 | 190 | 27864 | 156.66 | 910 | 887 | 172.2 |
| B | 12 | 111 | 21393 | 119.08 | 910 | 887 | 172.2 |
| B | 11 | 111 | 19639 | 108.9 | 910 | 887 | 172.2 |
| C | 14 | 238 | 141122 | 678.94 | 876 | 881 | 206.6 |
| C | 5 | 112 | 6189 | 25.7 | 876 | 881 | 206.6 |
| C | 13 | 61 | 5973 | 24.65 | 876 | 881 | 206.6 |
| D | 7 | 238 | 4891433 | 24615.78 | 816 | 790 | 198.7 |
| D | 8 | 195 | 222267 | 1114.75 | 816 | 790 | 198.7 |
| D | 1 | 52 | 93628 | 467.28 | 816 | 790 | 198.7 |
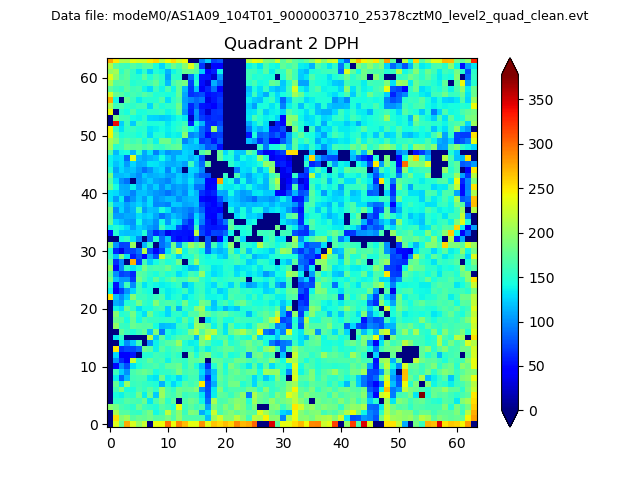
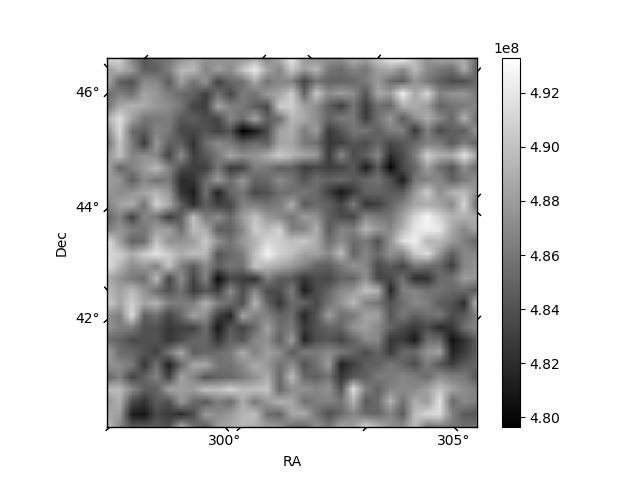
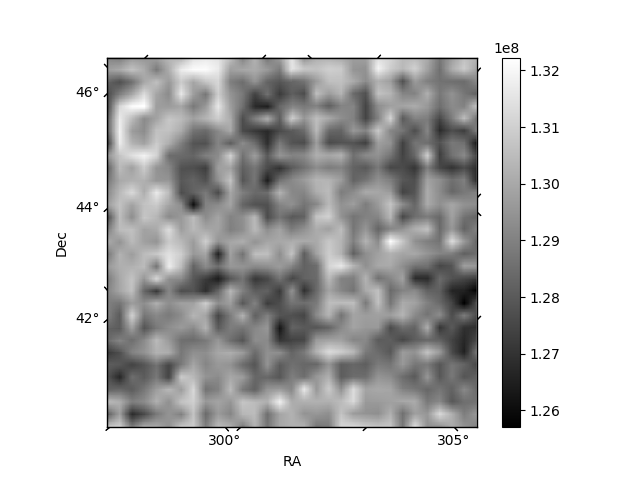
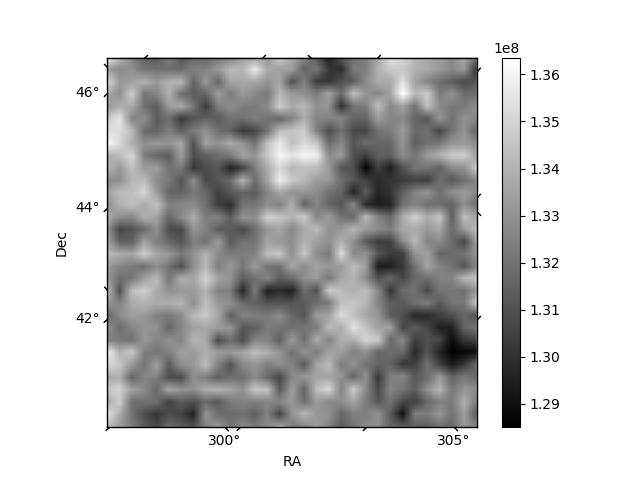
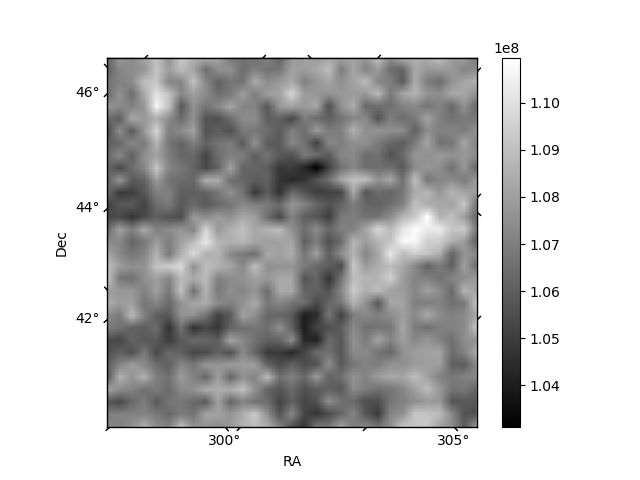
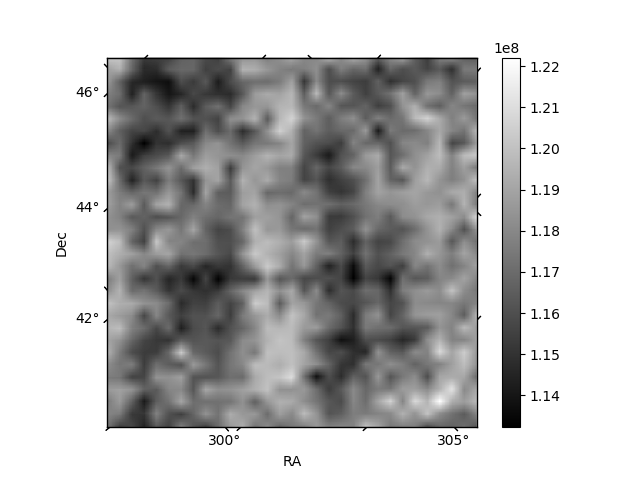
Histogram calculated using DETX and DETY for each event in the final _common_clean file
| Quadrant A | 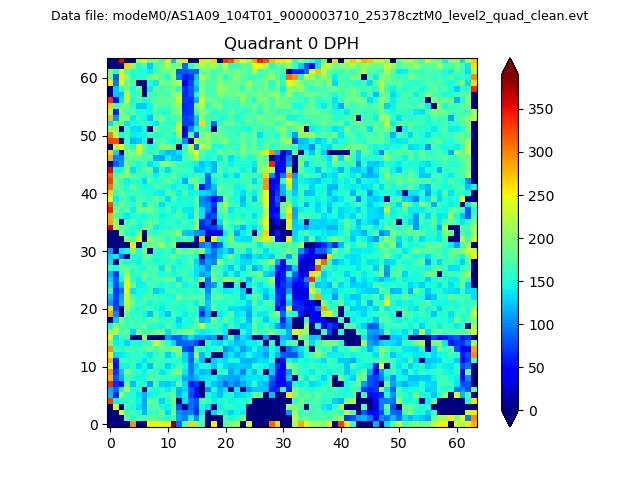 |
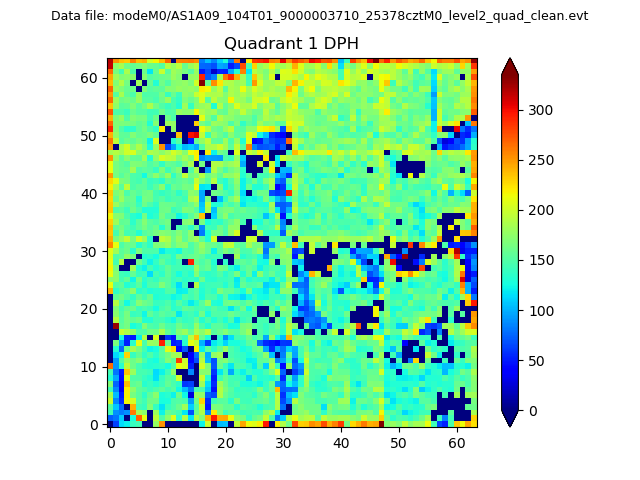 |
Quadrant B |
|---|---|---|---|
| Quadrant D | 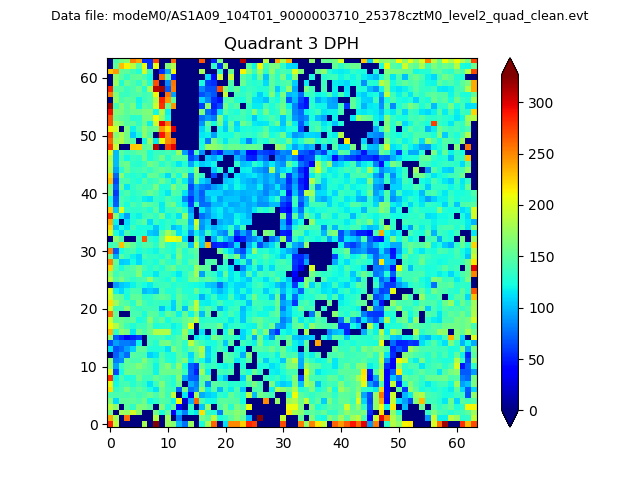 |
 |
Quadrant C |
| Plot type | Count rate plots | Images |
|---|---|---|
| Comparison with Poisson distribution Blue bars denote a histogram of data divided into 1 sec bins. Red curve is a Poisson curve with rate = median count rate of data. |
 |
 |
| Quadrant-wise count rates Data is divided into 100 sec bins |
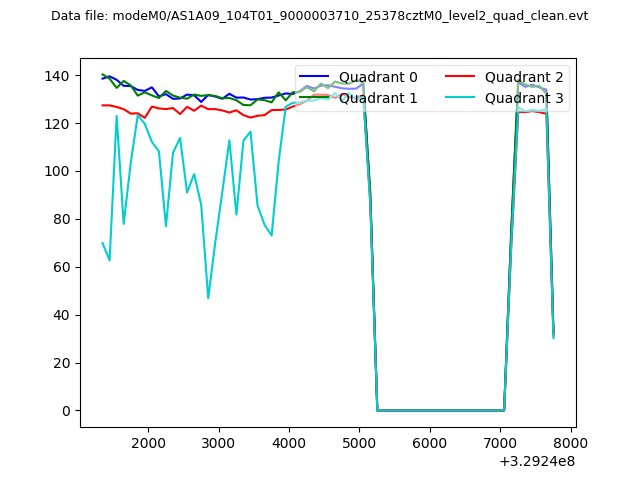 |
|
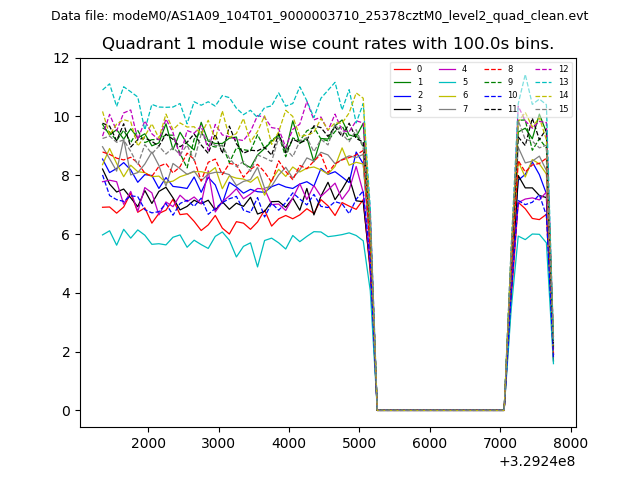
| Module-wise count rates for Quadrant A Data is divided into 100 sec bins |
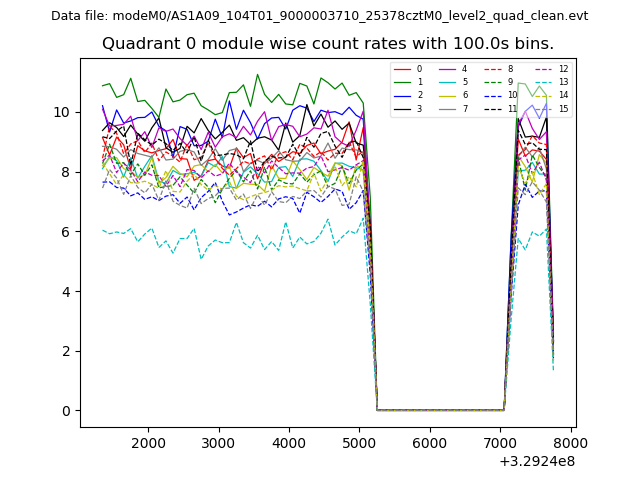 |
 |
| Module-wise count rates for Quadrant B Data is divided into 100 sec bins |
 |
 |
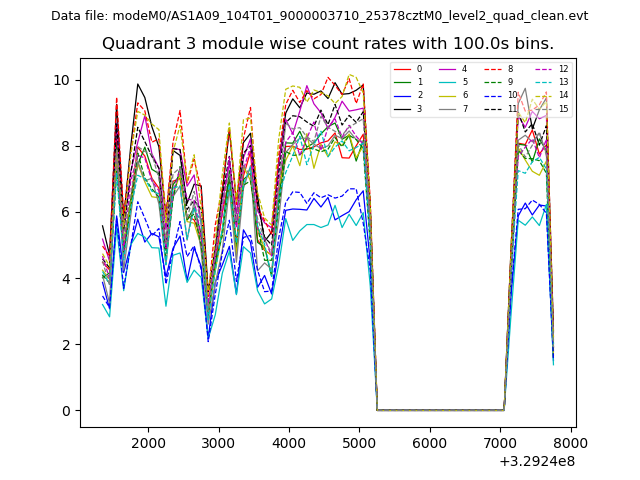
| Module-wise count rates for Quadrant C Data is divided into 100 sec bins |
 |
 |
| Module-wise count rates for Quadrant D Data is divided into 100 sec bins |
 |
 |
| Parameter | Plot |
|---|---|
| CZT HV Monitor | 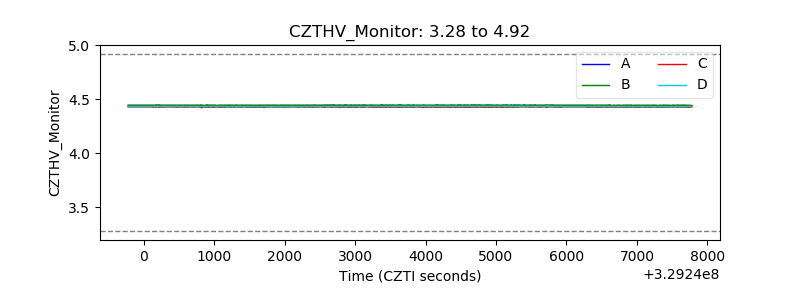 |
| D_VDD | 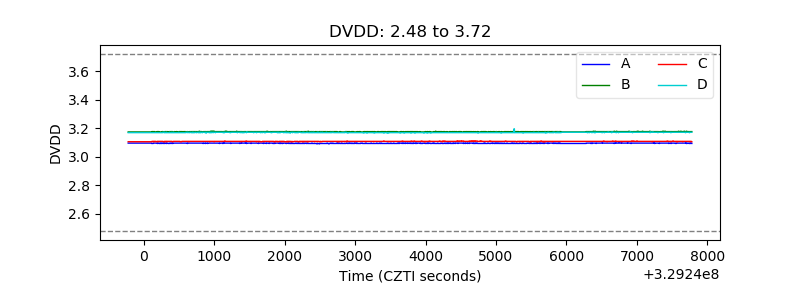 |
| Temperature 1 | 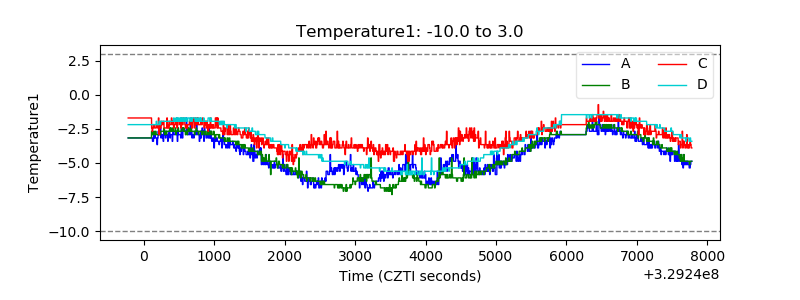 |
| Veto HV Monitor | 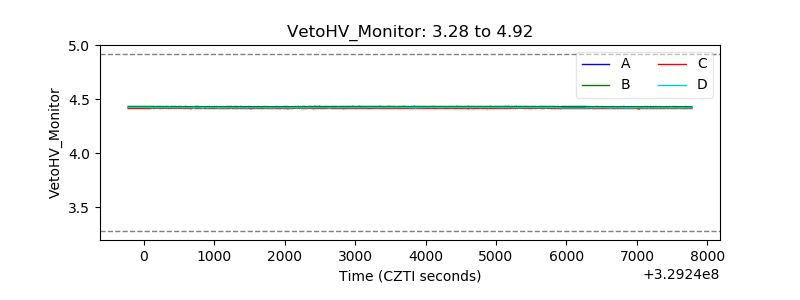 |
| Veto LLD |  |
| Alpha Counter |  |
| _CPM_Rate | 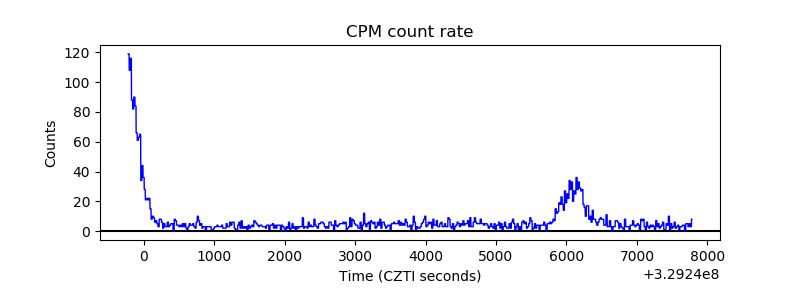 |
| CZT Counter | 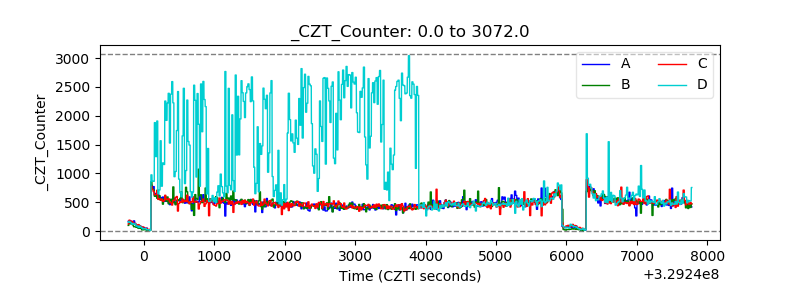 |
| +2.5 Volts monitor |  |
| +5 Volts monitor |  |
| _ROLL_ROT |  |
| _Roll_DEC |  |
| _Roll_RA | 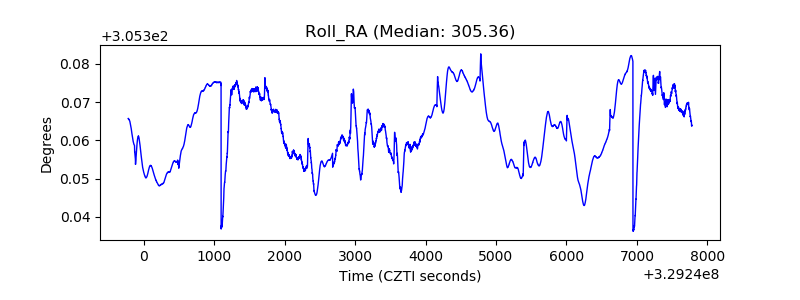 |
| Veto Counter | 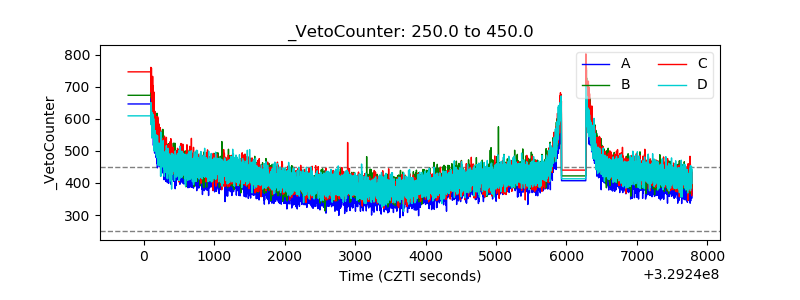 |