| Param | Original file | Final file |
|---|---|---|
| Filename | modeM0/AS1A09_104T01_9000003710_25379cztM0_level2.evt | modeM0/AS1A09_104T01_9000003710_25379cztM0_level2_quad_clean.evt |
| Size (bytes) | 567,786,240 | 100,912,320 |
| Size | 541.5 MB | 96.2 MB |
| Events in quadrant A | 4,075,781 | 635,991 |
| Events in quadrant B | 4,069,982 | 637,511 |
| Events in quadrant C | 4,032,405 | 605,534 |
| Events in quadrant D | 4,456,893 | 603,484 |
| Mode M9 | |||
|---|---|---|---|
| Quadrant | BADHDUFLAG | Total packets | Discarded packets |
| A | 0 | 6 | 0 |
| B | 0 | 6 | 0 |
| C | 0 | 6 | 0 |
| D | 0 | 6 | 0 |
| Mode M0 | |||
|---|---|---|---|
| Quadrant | BADHDUFLAG | Total packets | Discarded packets |
| A | 0 | 17313 | 0 |
| B | 0 | 17283 | 0 |
| C | 0 | 17201 | 0 |
| D | 0 | 18580 | 0 |
| Quadrant | Total seconds | Saturated seconds | Saturation percentage |
|---|---|---|---|
| A | 8257 | 130 | 1.574422% |
| B | 8258 | 194 | 2.349237% |
| C | 8258 | 238 | 2.882054% |
| D | 8258 | 144 | 1.743764% |
Noise dominated data is calculated using 1-second bins in cleaned event files. If a bin has >2000 counts, and if more than 50% of those come from <1% of pixels, then it is considered to be noise-dominated and hence unusable.
| Quadrant | # 1 sec bins | Bins with >0 counts | Bins with >2000 counts | High rate bins dominated by noise | Noise dominated (total time) | Noise dominated (detector-on time) | Marked lightcurve |
|---|---|---|---|---|---|---|---|
| A | 8852 | 8259 | 0 | 0 | 0.00% | 0.00% | 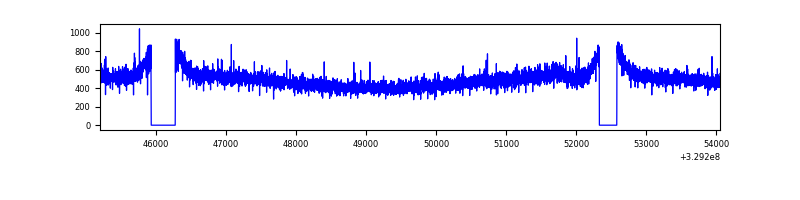 |
| B | 8853 | 8259 | 0 | 0 | 0.00% | 0.00% | 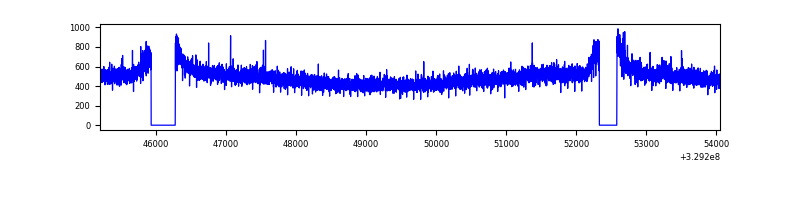 |
| C | 8853 | 8260 | 0 | 0 | 0.00% | 0.00% | 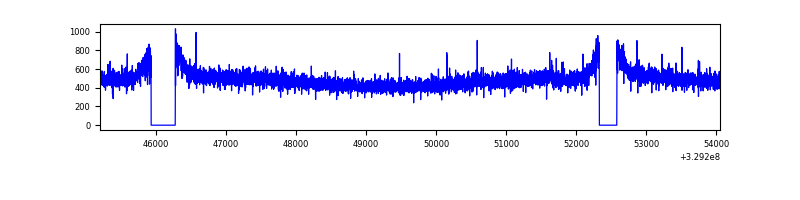 |
| D | 8853 | 8260 | 19 | 19 | 0.21% | 0.23% | 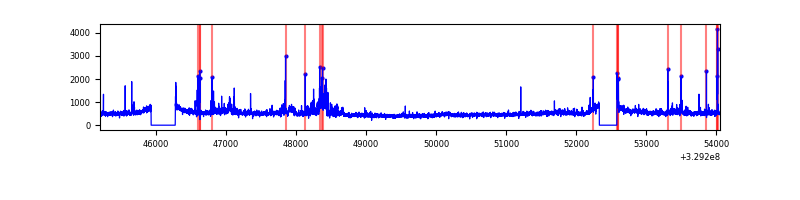 |
Top three noisy pixels from each quadrant. If the there are fewer than three noisy pixels in the level2.evt file, extra rows are filled as -1
| Pixel properties | Quadrant properties | ||||||
|---|---|---|---|---|---|---|---|
| Quadrant | DetID | PixID | Counts | Sigma | Mean | Median | Sigma |
| A | 6 | 16 | 47788 | 224.16 | 1042 | 1020 | 208.6 |
| A | 13 | 254 | 14323 | 63.76 | 1042 | 1020 | 208.6 |
| A | 3 | 137 | 9966 | 42.88 | 1042 | 1020 | 208.6 |
| B | 12 | 111 | 24411 | 120.01 | 1029 | 1002 | 195.1 |
| B | 11 | 111 | 22422 | 109.82 | 1029 | 1002 | 195.1 |
| B | 0 | 229 | 19852 | 96.64 | 1029 | 1002 | 195.1 |
| C | 14 | 238 | 159306 | 684.47 | 989 | 993 | 231.3 |
| C | 0 | 207 | 8924 | 34.29 | 989 | 993 | 231.3 |
| C | 13 | 61 | 6794 | 25.08 | 989 | 993 | 231.3 |
| D | 8 | 195 | 185141 | 753.2 | 1010 | 979 | 244.5 |
| D | 7 | 238 | 182972 | 744.33 | 1010 | 979 | 244.5 |
| D | 7 | 96 | 88121 | 356.4 | 1010 | 979 | 244.5 |
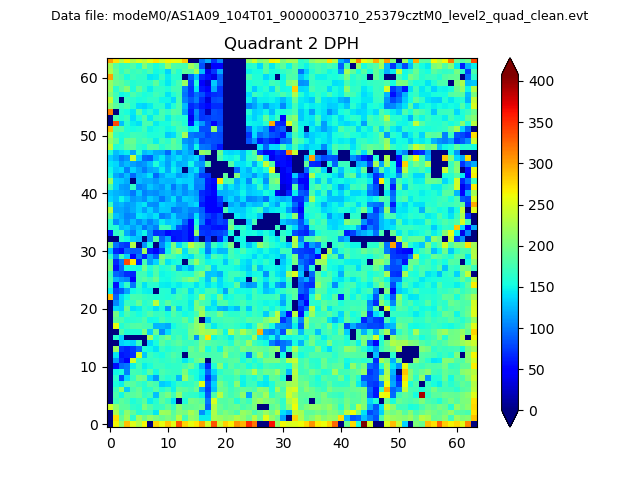
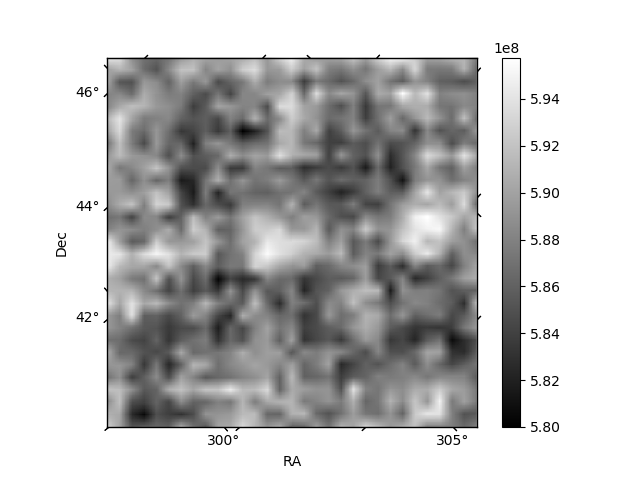
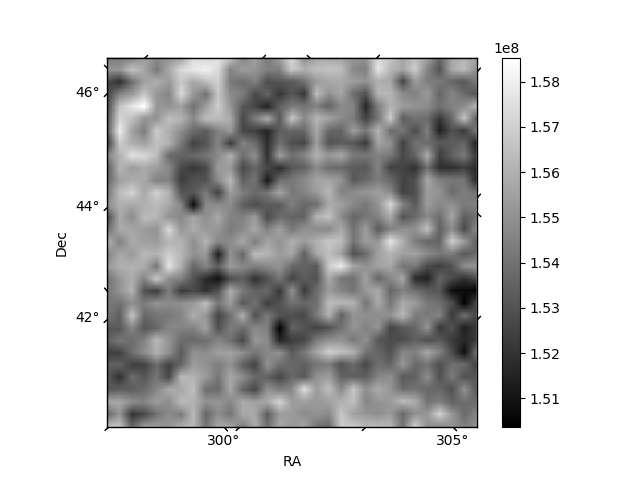
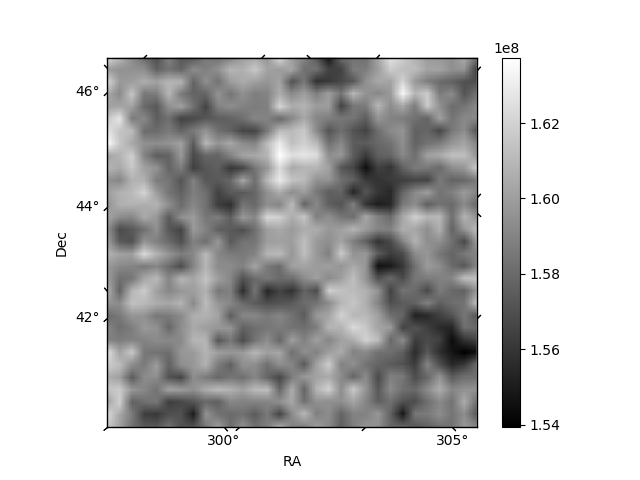
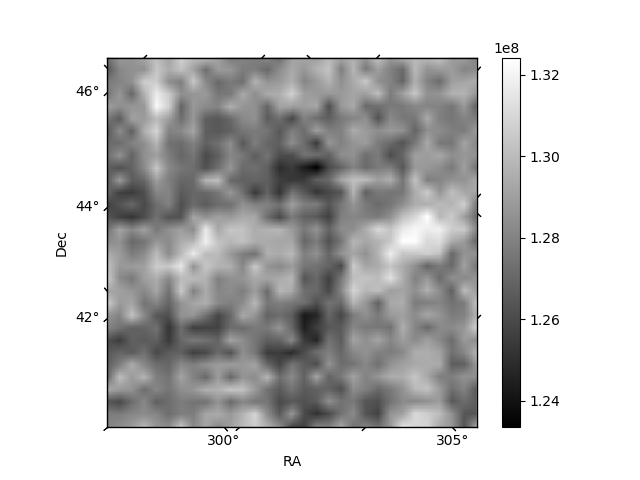
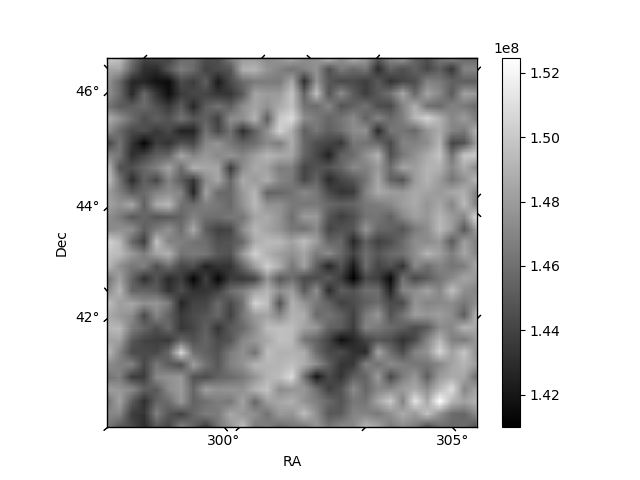
Histogram calculated using DETX and DETY for each event in the final _common_clean file
| Quadrant A | 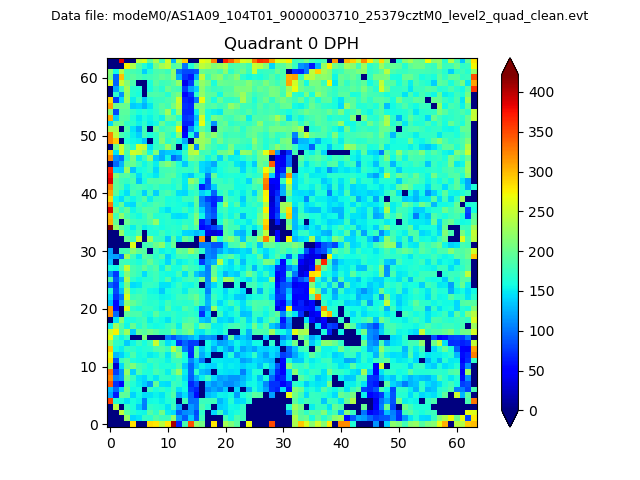 |
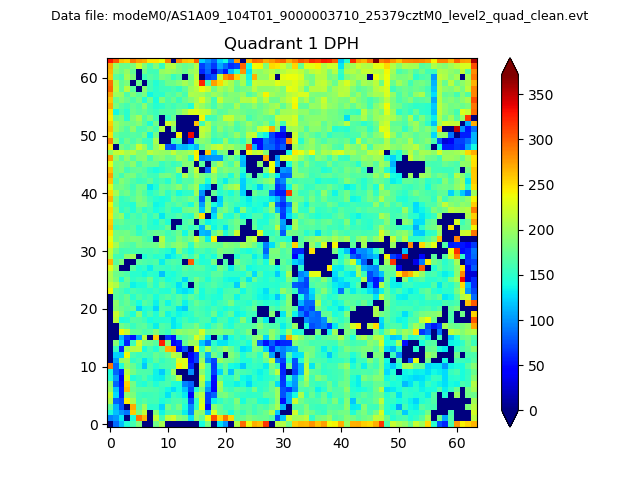 |
Quadrant B |
|---|---|---|---|
| Quadrant D | 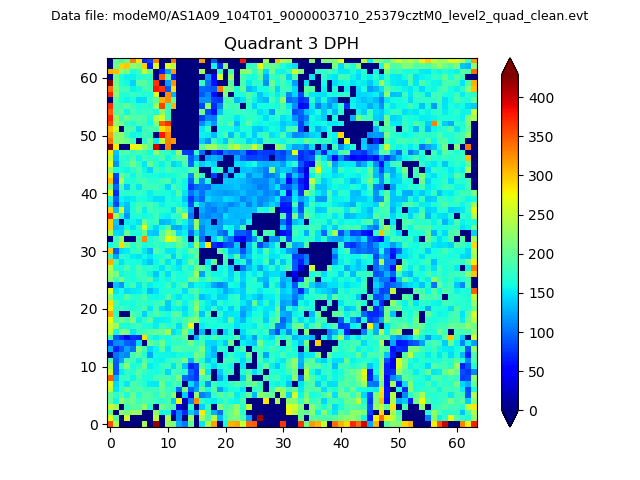 |
 |
Quadrant C |
| Plot type | Count rate plots | Images |
|---|---|---|
| Comparison with Poisson distribution Blue bars denote a histogram of data divided into 1 sec bins. Red curve is a Poisson curve with rate = median count rate of data. |
 |
 |
| Quadrant-wise count rates Data is divided into 100 sec bins |
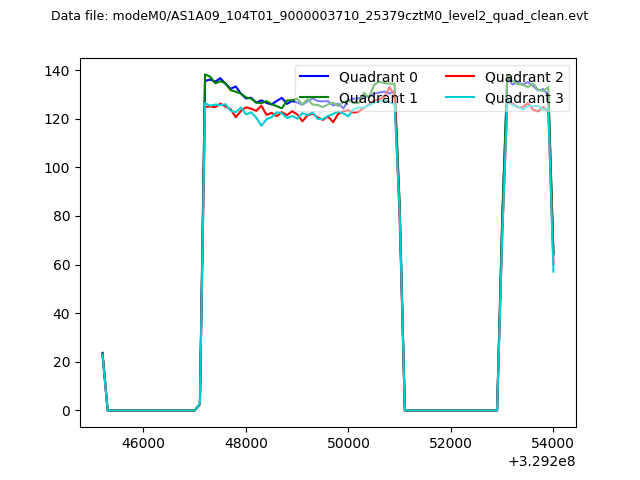 |
|
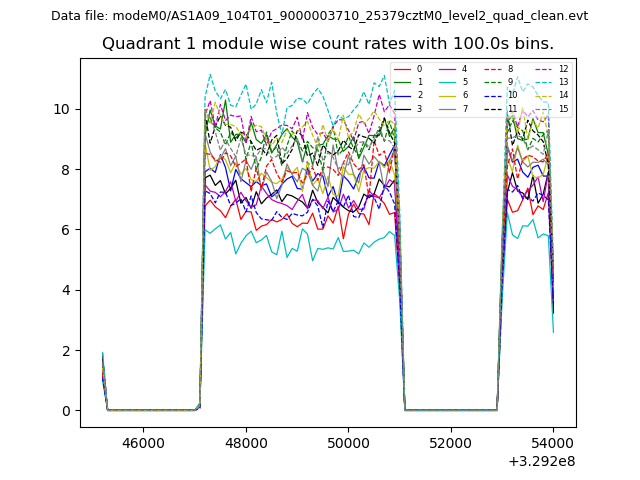
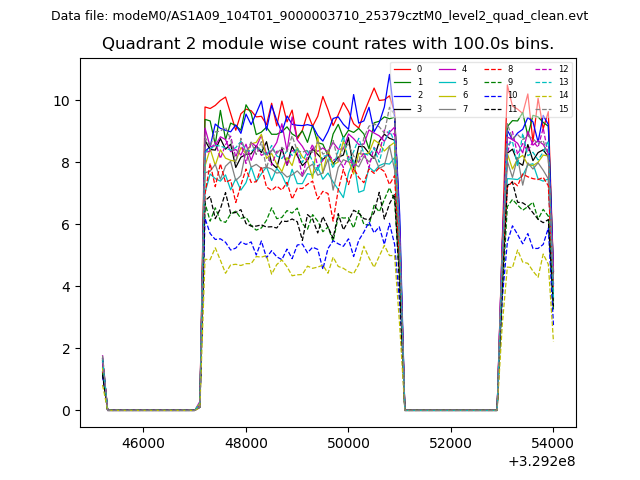
| Module-wise count rates for Quadrant A Data is divided into 100 sec bins |
 |
 |
| Module-wise count rates for Quadrant B Data is divided into 100 sec bins |
 |
 |
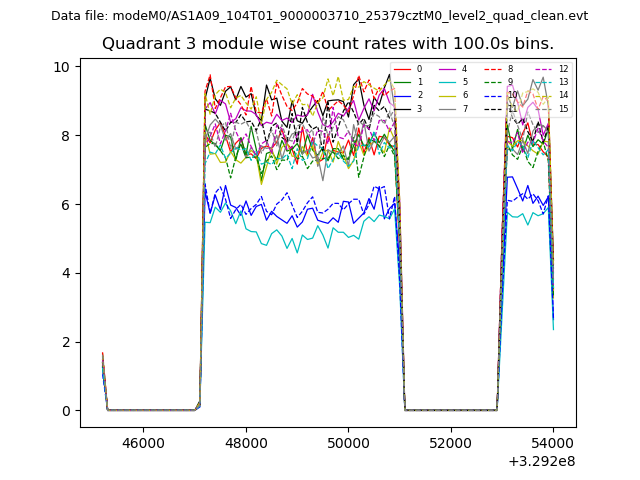
| Module-wise count rates for Quadrant C Data is divided into 100 sec bins |
 |
 |
| Module-wise count rates for Quadrant D Data is divided into 100 sec bins |
 |
 |
| Parameter | Plot |
|---|---|
| CZT HV Monitor | 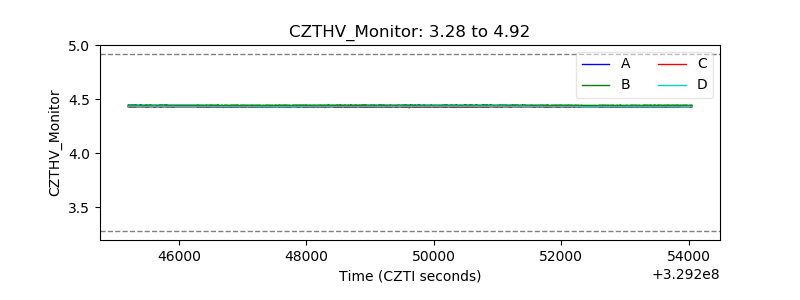 |
| D_VDD | 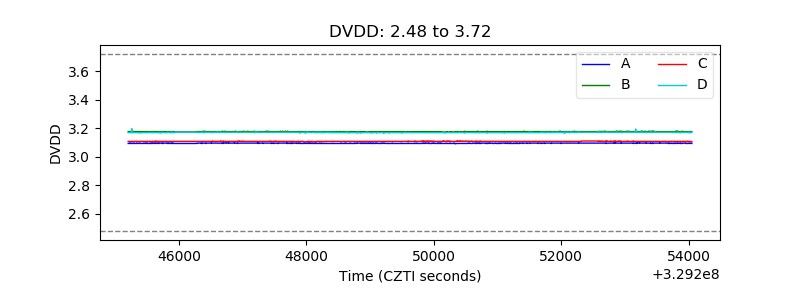 |
| Temperature 1 | 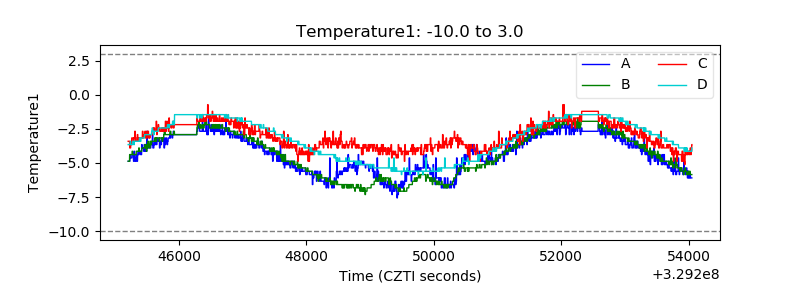 |
| Veto HV Monitor | 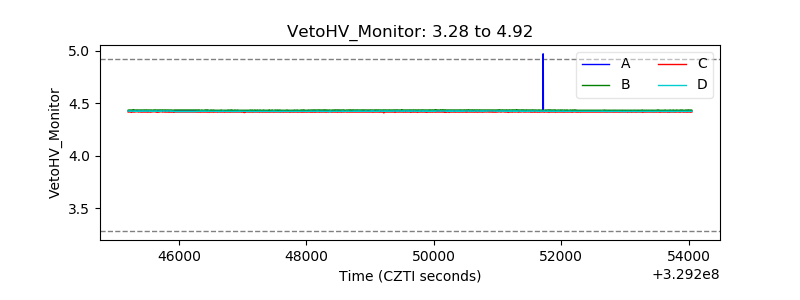 |
| Veto LLD | 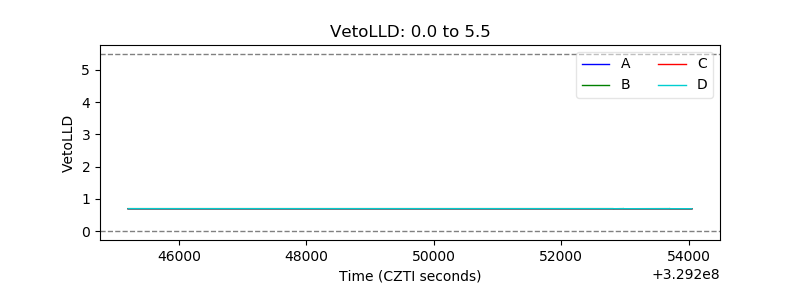 |
| Alpha Counter | 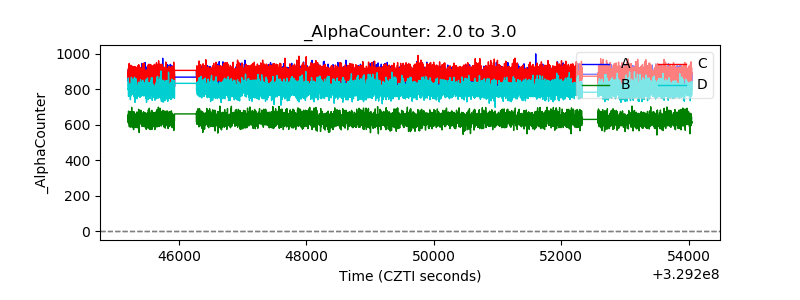 |
| _CPM_Rate | 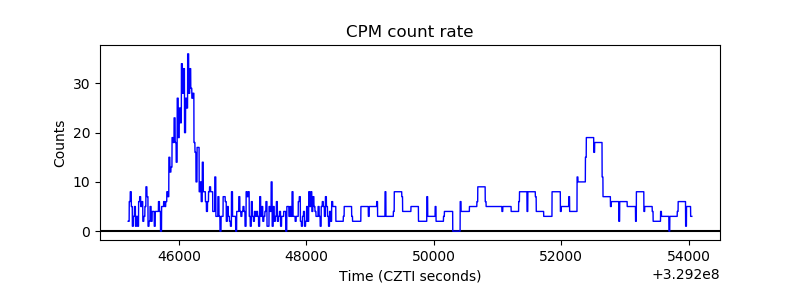 |
| CZT Counter | 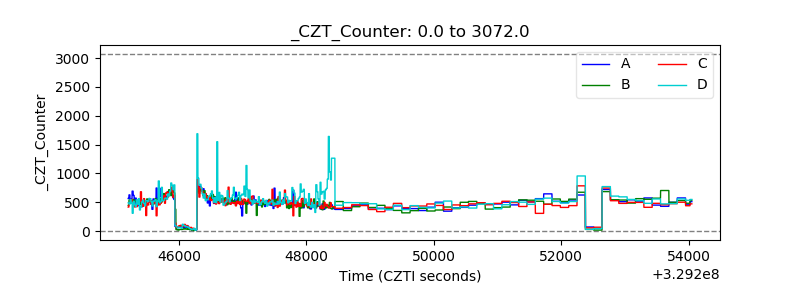 |
| +2.5 Volts monitor |  |
| +5 Volts monitor | 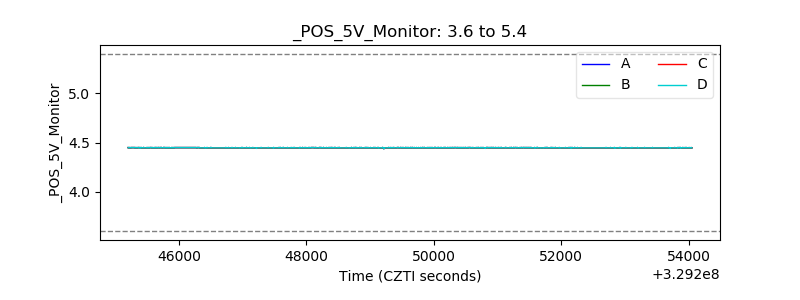 |
| _ROLL_ROT |  |
| _Roll_DEC | 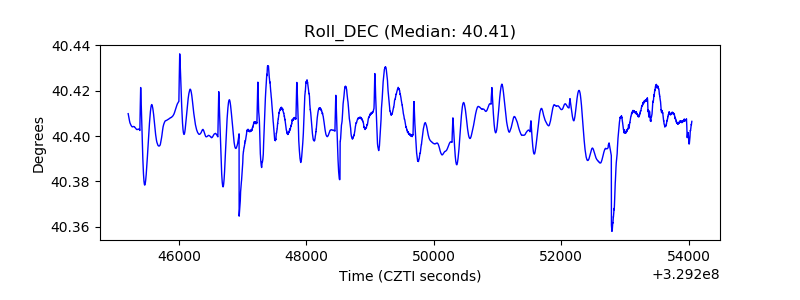 |
| _Roll_RA | 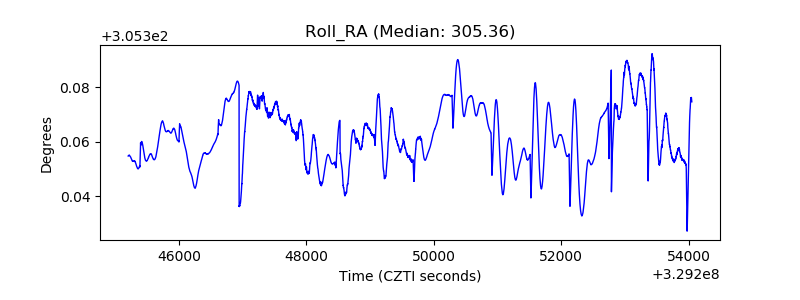 |
| Veto Counter |  |