| Param | Original file | Final file |
|---|---|---|
| Filename | modeM0/AS1A09_104T01_9000003710_25380cztM0_level2.evt | modeM0/AS1A09_104T01_9000003710_25380cztM0_level2_quad_clean.evt |
| Size (bytes) | 502,747,200 | 106,248,960 |
| Size | 479.5 MB | 101.3 MB |
| Events in quadrant A | 3,449,245 | 697,474 |
| Events in quadrant B | 3,489,442 | 698,725 |
| Events in quadrant C | 3,481,572 | 664,671 |
| Events in quadrant D | 4,311,292 | 650,495 |
| Mode M9 | |||
|---|---|---|---|
| Quadrant | BADHDUFLAG | Total packets | Discarded packets |
| A | 0 | 4 | 0 |
| B | 0 | 4 | 0 |
| C | 0 | 4 | 0 |
| D | 0 | 4 | 0 |
| Mode M0 | |||
|---|---|---|---|
| Quadrant | BADHDUFLAG | Total packets | Discarded packets |
| A | 0 | 14945 | 0 |
| B | 0 | 15040 | 0 |
| C | 0 | 14947 | 0 |
| D | 0 | 17600 | 0 |
| Quadrant | Total seconds | Saturated seconds | Saturation percentage |
|---|---|---|---|
| A | 7278 | 57 | 0.783182% |
| B | 7279 | 82 | 1.126528% |
| C | 7279 | 120 | 1.648578% |
| D | 7279 | 218 | 2.994917% |
Noise dominated data is calculated using 1-second bins in cleaned event files. If a bin has >2000 counts, and if more than 50% of those come from <1% of pixels, then it is considered to be noise-dominated and hence unusable.
| Quadrant | # 1 sec bins | Bins with >0 counts | Bins with >2000 counts | High rate bins dominated by noise | Noise dominated (total time) | Noise dominated (detector-on time) | Marked lightcurve |
|---|---|---|---|---|---|---|---|
| A | 7618 | 7279 | 0 | 0 | 0.00% | 0.00% | 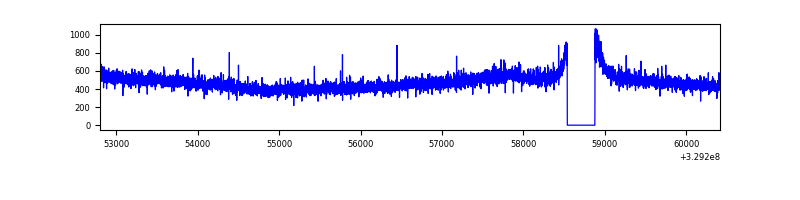 |
| B | 7619 | 7280 | 2 | 2 | 0.03% | 0.03% | 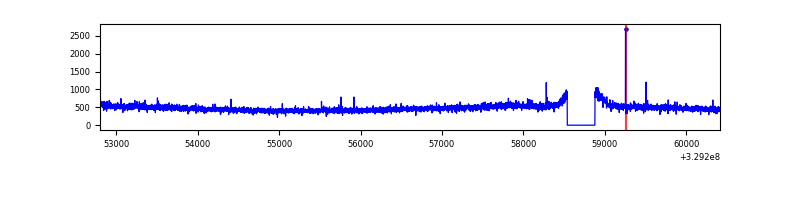 |
| C | 7619 | 7280 | 0 | 0 | 0.00% | 0.00% | 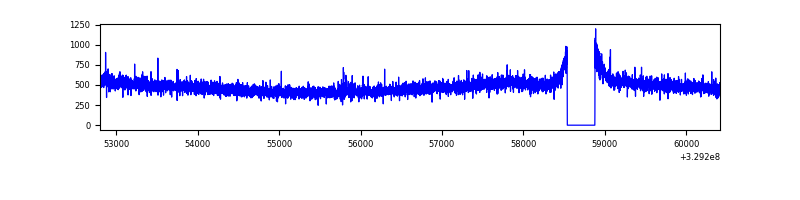 |
| D | 7619 | 7280 | 136 | 136 | 1.79% | 1.87% | 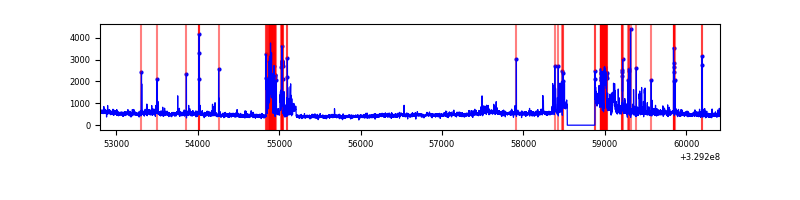 |
Top three noisy pixels from each quadrant. If the there are fewer than three noisy pixels in the level2.evt file, extra rows are filled as -1
| Pixel properties | Quadrant properties | ||||||
|---|---|---|---|---|---|---|---|
| Quadrant | DetID | PixID | Counts | Sigma | Mean | Median | Sigma |
| A | 6 | 16 | 20093 | 107.17 | 888 | 870 | 179.4 |
| A | 13 | 254 | 11238 | 57.8 | 888 | 870 | 179.4 |
| A | 3 | 137 | 8408 | 42.02 | 888 | 870 | 179.4 |
| B | 12 | 111 | 20984 | 118.57 | 882 | 857 | 169.7 |
| B | 11 | 111 | 18800 | 105.7 | 882 | 857 | 169.7 |
| B | 0 | 229 | 16924 | 94.65 | 882 | 857 | 169.7 |
| C | 14 | 238 | 138330 | 684.46 | 852 | 855 | 200.9 |
| C | 5 | 112 | 7588 | 33.52 | 852 | 855 | 200.9 |
| C | 0 | 207 | 7350 | 32.34 | 852 | 855 | 200.9 |
| D | 7 | 238 | 616022 | 2995.7 | 854 | 833 | 205.4 |
| D | 8 | 195 | 216441 | 1049.92 | 854 | 833 | 205.4 |
| D | 12 | 233 | 96134 | 464.07 | 854 | 833 | 205.4 |
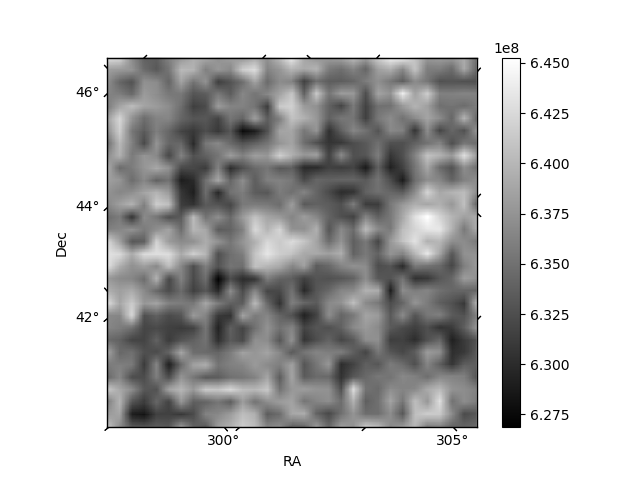
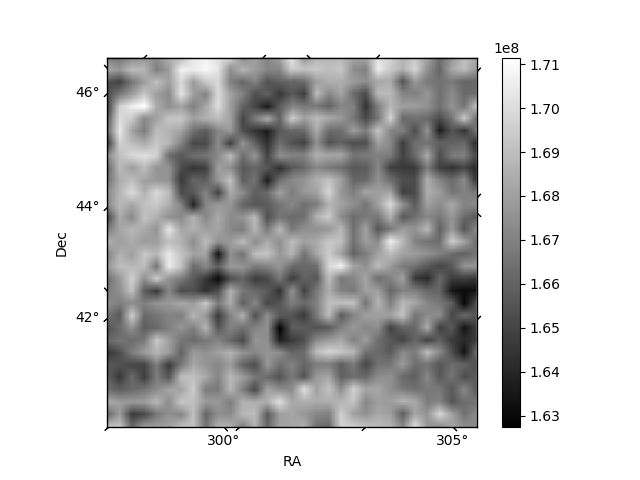
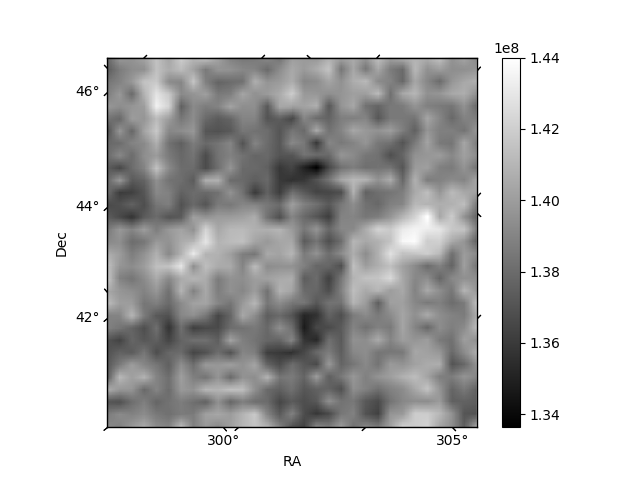
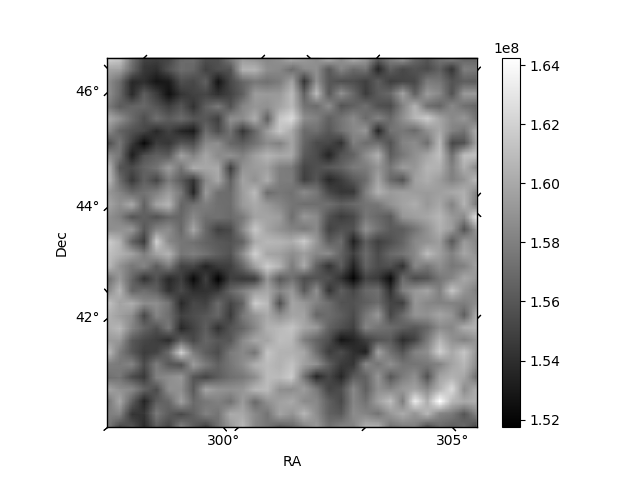
Histogram calculated using DETX and DETY for each event in the final _common_clean file
| Quadrant A | 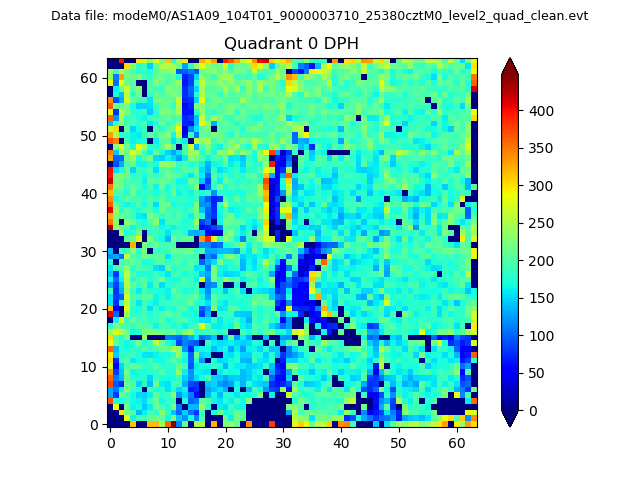 |
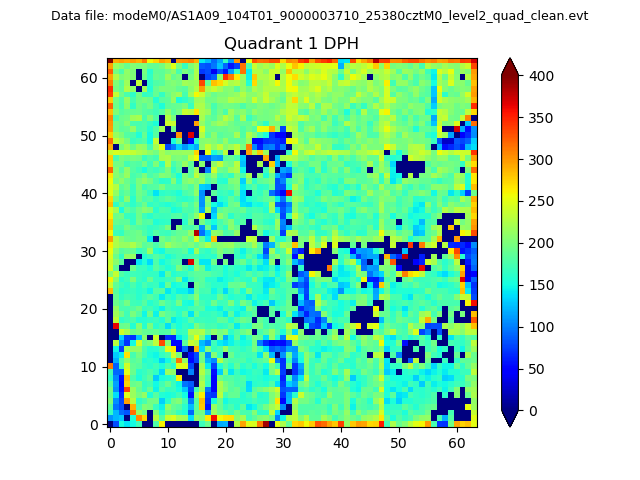 |
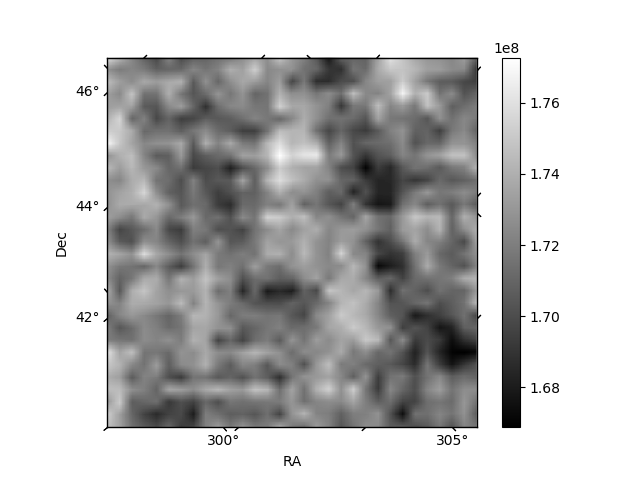
Quadrant B |
|---|---|---|---|
| Quadrant D | 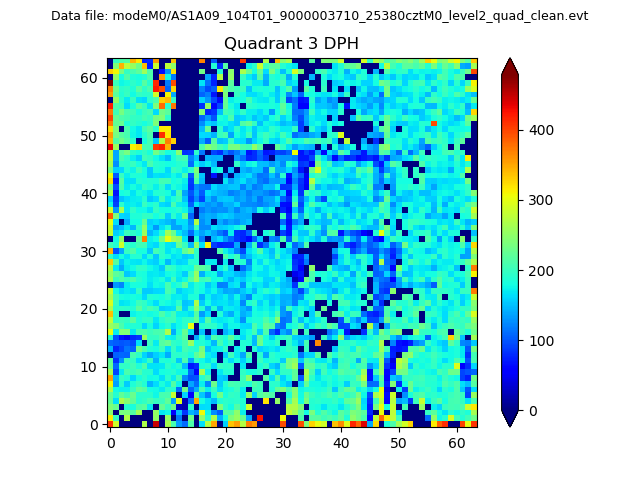 |
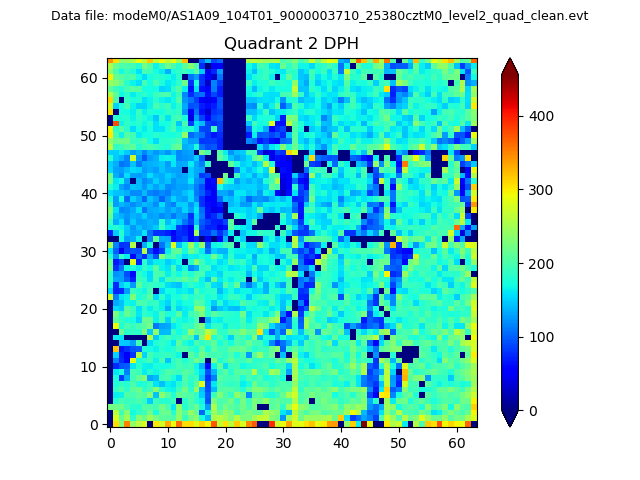 |
Quadrant C |
| Plot type | Count rate plots | Images |
|---|---|---|
| Comparison with Poisson distribution Blue bars denote a histogram of data divided into 1 sec bins. Red curve is a Poisson curve with rate = median count rate of data. |
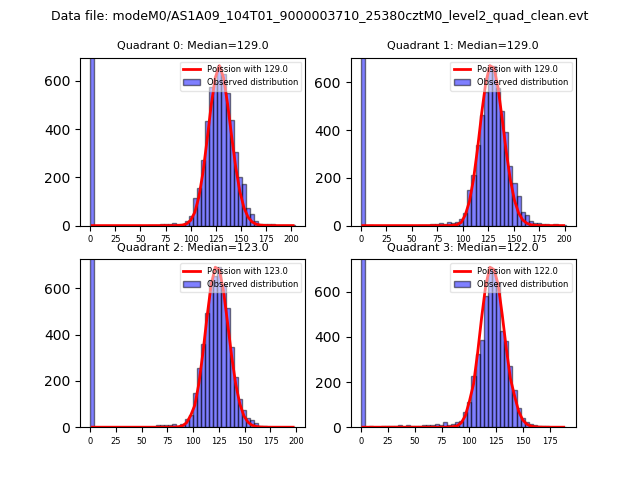 |
 |
| Quadrant-wise count rates Data is divided into 100 sec bins |
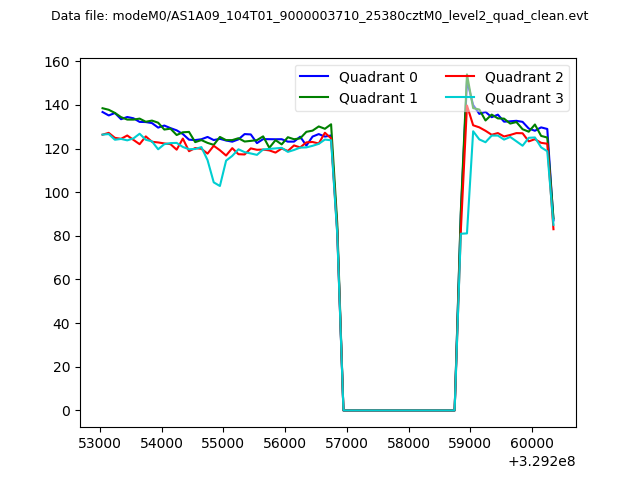 |
|
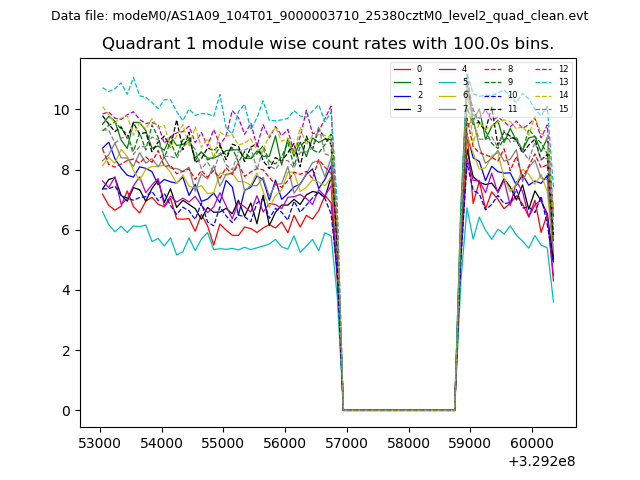
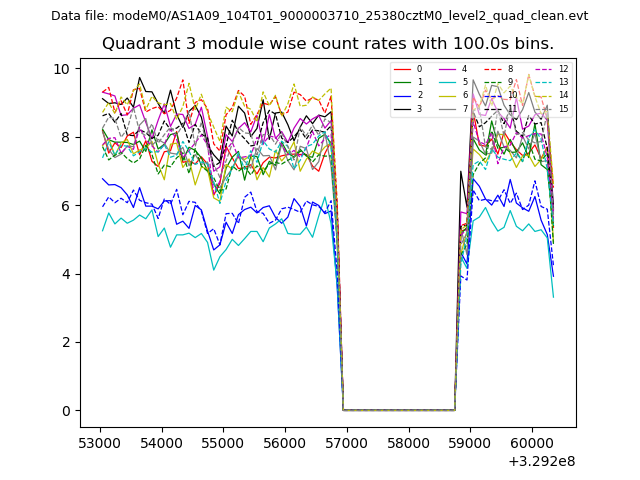
| Module-wise count rates for Quadrant A Data is divided into 100 sec bins |
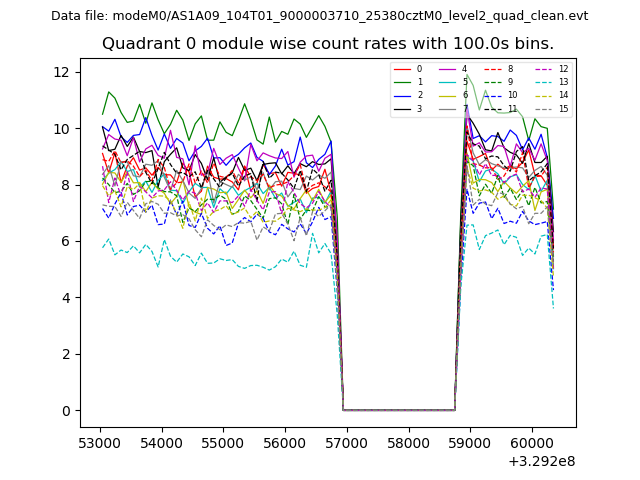 |
 |
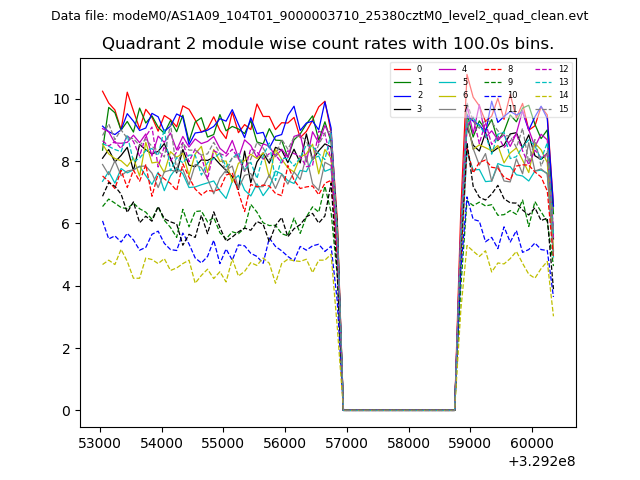
| Module-wise count rates for Quadrant B Data is divided into 100 sec bins |
 |
 |
| Module-wise count rates for Quadrant C Data is divided into 100 sec bins |
 |
 |
| Module-wise count rates for Quadrant D Data is divided into 100 sec bins |
 |
 |
| Parameter | Plot |
|---|---|
| CZT HV Monitor | 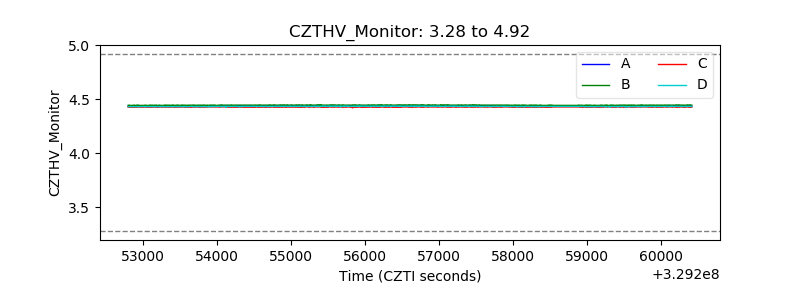 |
| D_VDD | 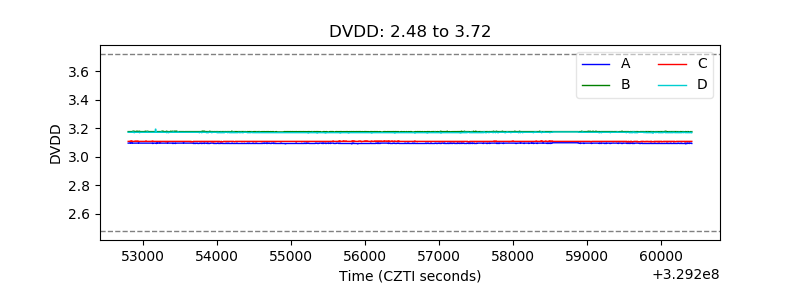 |
| Temperature 1 | 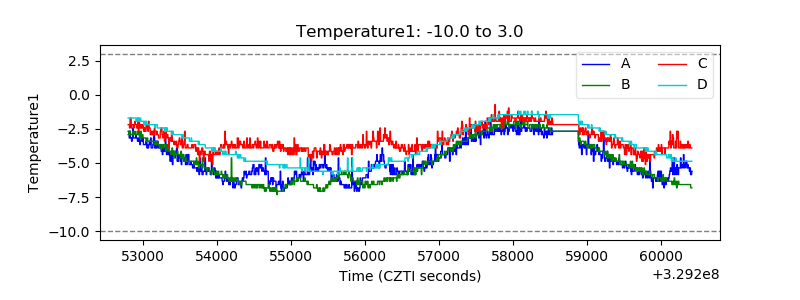 |
| Veto HV Monitor | 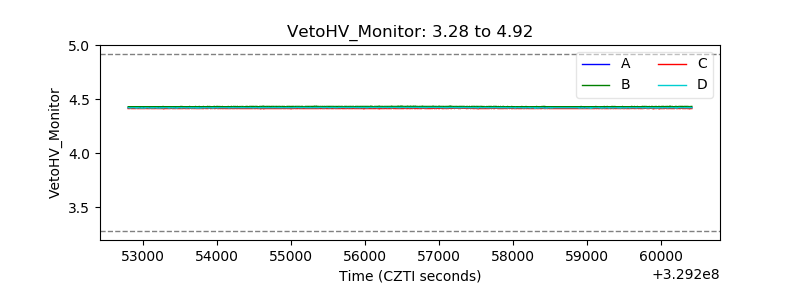 |
| Veto LLD | 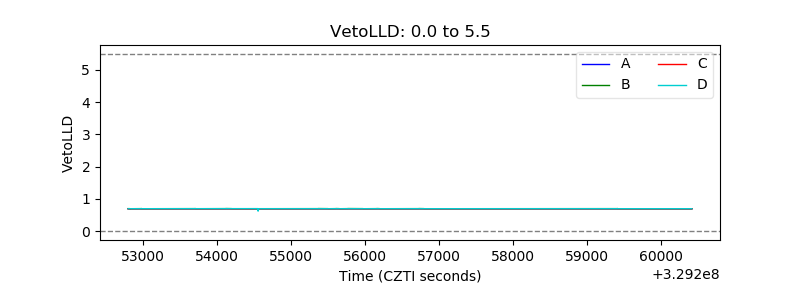 |
| Alpha Counter | 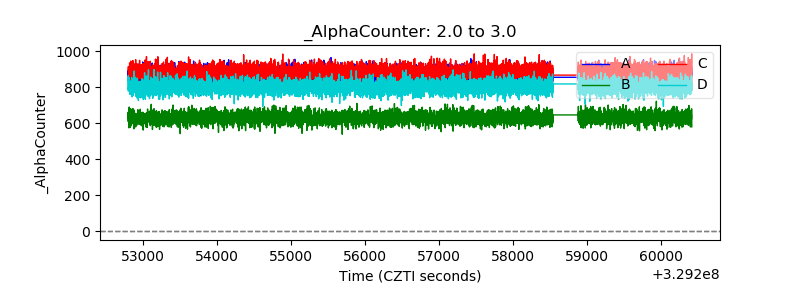 |
| _CPM_Rate | 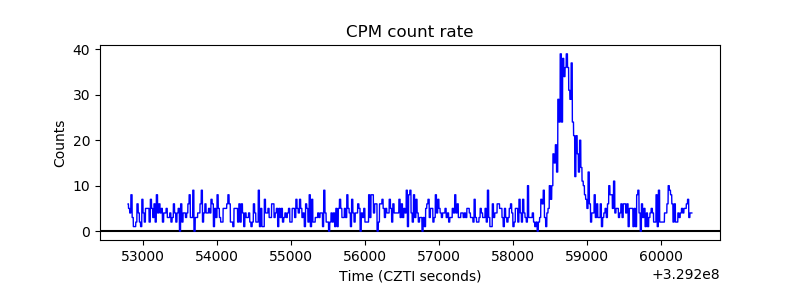 |
| CZT Counter | 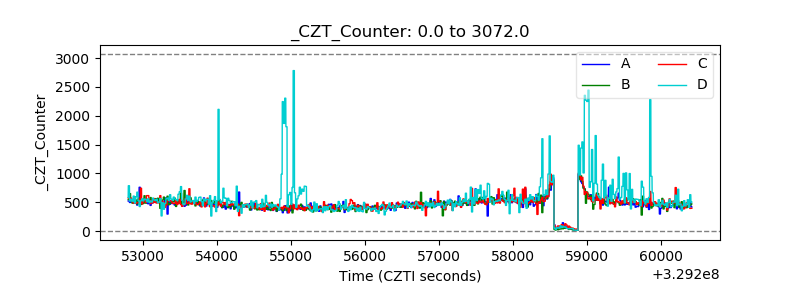 |
| +2.5 Volts monitor | 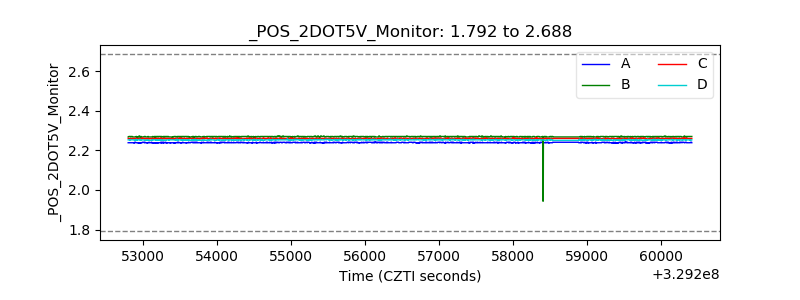 |
| +5 Volts monitor | 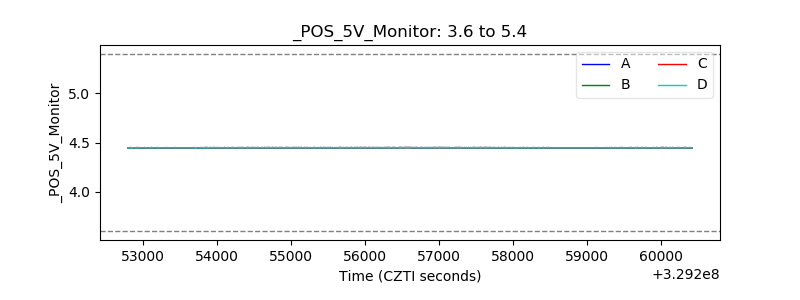 |
| _ROLL_ROT | 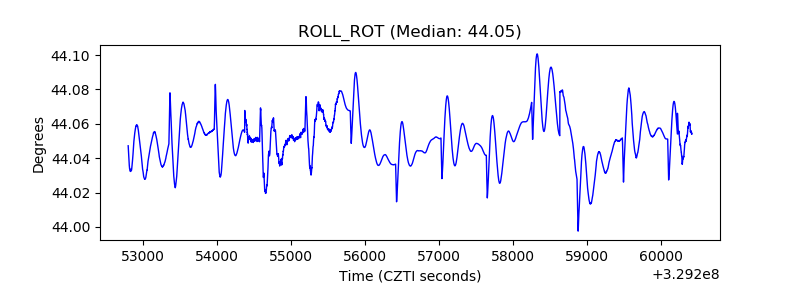 |
| _Roll_DEC | 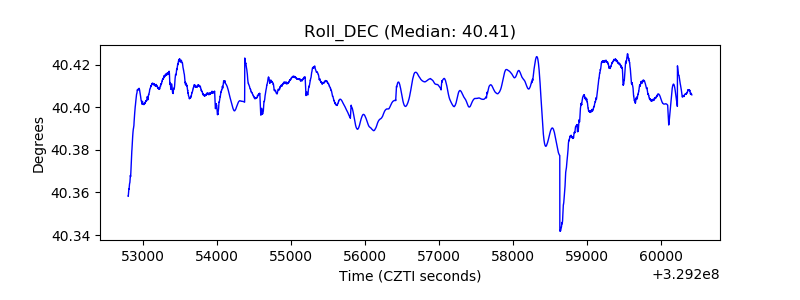 |
| _Roll_RA | 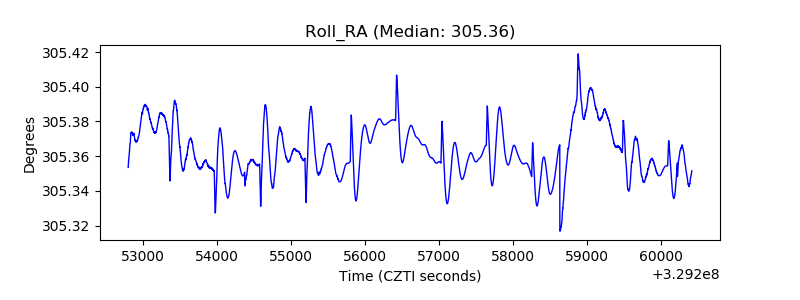 |
| Veto Counter | 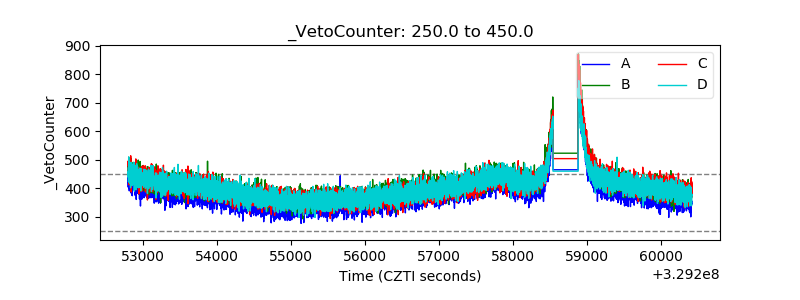 |