| Param | Original file | Final file |
|---|---|---|
| Filename | modeM0/AS1A09_104T01_9000003710_25382cztM0_level2.evt | modeM0/AS1A09_104T01_9000003710_25382cztM0_level2_quad_clean.evt |
| Size (bytes) | 222,140,160 | 62,625,600 |
| Size | 211.8 MB | 59.7 MB |
| Events in quadrant A | 1,511,999 | 426,563 |
| Events in quadrant B | 1,539,358 | 424,432 |
| Events in quadrant C | 1,549,368 | 407,523 |
| Events in quadrant D | 1,896,694 | 399,779 |
| Mode M9 | |||
|---|---|---|---|
| Quadrant | BADHDUFLAG | Total packets | Discarded packets |
| A | 0 | 4 | 0 |
| B | 0 | 4 | 0 |
| C | 0 | 4 | 0 |
| D | 0 | 4 | 0 |
| Mode M0 | |||
|---|---|---|---|
| Quadrant | BADHDUFLAG | Total packets | Discarded packets |
| A | 0 | 6926 | 0 |
| B | 0 | 6949 | 0 |
| C | 0 | 6939 | 0 |
| D | 0 | 8046 | 0 |
| Quadrant | Total seconds | Saturated seconds | Saturation percentage |
|---|---|---|---|
| A | 3360 | 51 | 1.517857% |
| B | 3360 | 61 | 1.815476% |
| C | 3360 | 69 | 2.053571% |
| D | 3361 | 139 | 4.135674% |
Noise dominated data is calculated using 1-second bins in cleaned event files. If a bin has >2000 counts, and if more than 50% of those come from <1% of pixels, then it is considered to be noise-dominated and hence unusable.
| Quadrant | # 1 sec bins | Bins with >0 counts | Bins with >2000 counts | High rate bins dominated by noise | Noise dominated (total time) | Noise dominated (detector-on time) | Marked lightcurve |
|---|---|---|---|---|---|---|---|
| A | 3700 | 3361 | 0 | 0 | 0.00% | 0.00% | 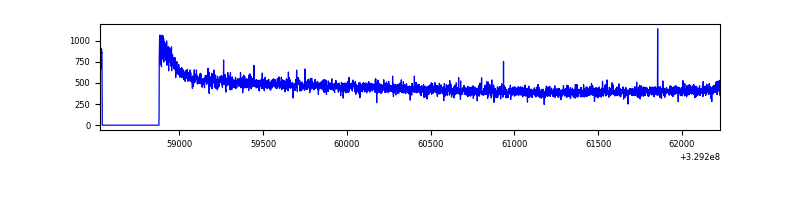 |
| B | 3700 | 3361 | 2 | 2 | 0.05% | 0.06% | 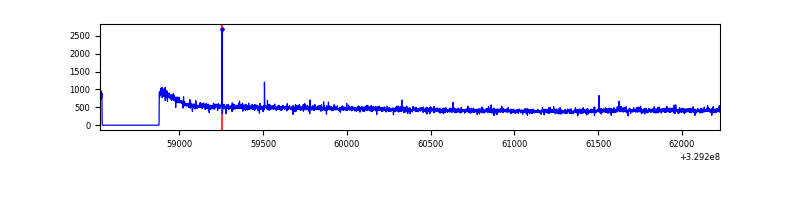 |
| C | 3700 | 3361 | 0 | 0 | 0.00% | 0.00% | 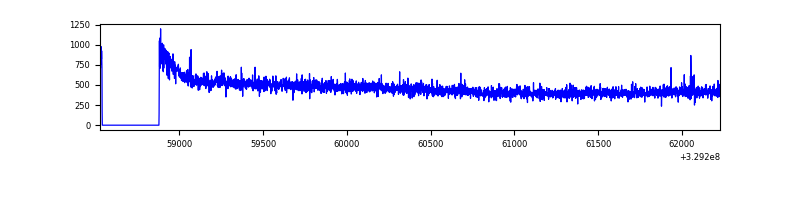 |
| D | 3701 | 3362 | 76 | 76 | 2.05% | 2.26% | 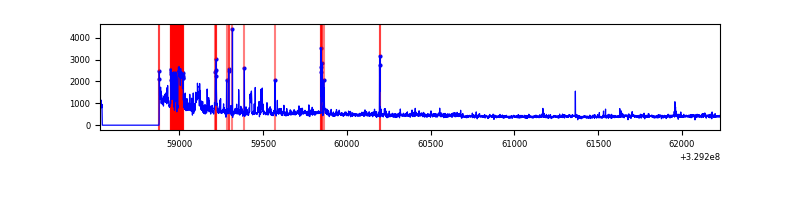 |
Top three noisy pixels from each quadrant. If the there are fewer than three noisy pixels in the level2.evt file, extra rows are filled as -1
| Pixel properties | Quadrant properties | ||||||
|---|---|---|---|---|---|---|---|
| Quadrant | DetID | PixID | Counts | Sigma | Mean | Median | Sigma |
| A | 6 | 16 | 6579 | 77.68 | 389 | 382 | 79.8 |
| A | 13 | 254 | 5163 | 59.93 | 389 | 382 | 79.8 |
| A | 3 | 137 | 3616 | 40.54 | 389 | 382 | 79.8 |
| B | 12 | 111 | 9171 | 115.0 | 388 | 378 | 76.5 |
| B | 11 | 111 | 8171 | 101.92 | 388 | 378 | 76.5 |
| B | 14 | 111 | 7413 | 92.01 | 388 | 378 | 76.5 |
| C | 14 | 238 | 60656 | 664.27 | 379 | 381 | 90.7 |
| C | 0 | 207 | 5572 | 57.21 | 379 | 381 | 90.7 |
| C | 5 | 112 | 3766 | 37.3 | 379 | 381 | 90.7 |
| D | 7 | 238 | 288370 | 3105.17 | 374 | 365 | 92.8 |
| D | 8 | 195 | 67483 | 723.64 | 374 | 365 | 92.8 |
| D | 9 | 35 | 58359 | 625.27 | 374 | 365 | 92.8 |
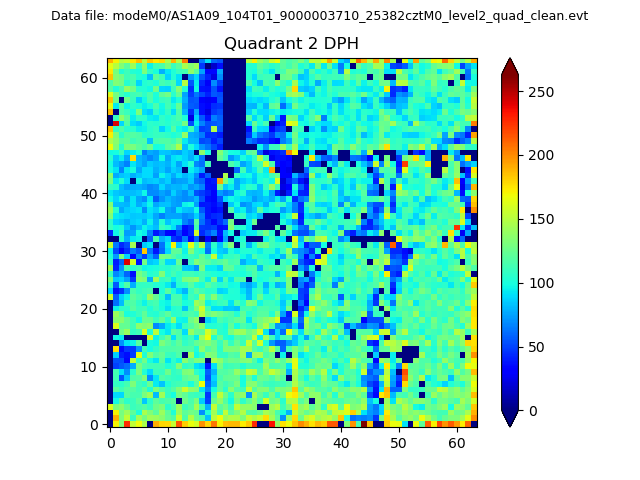
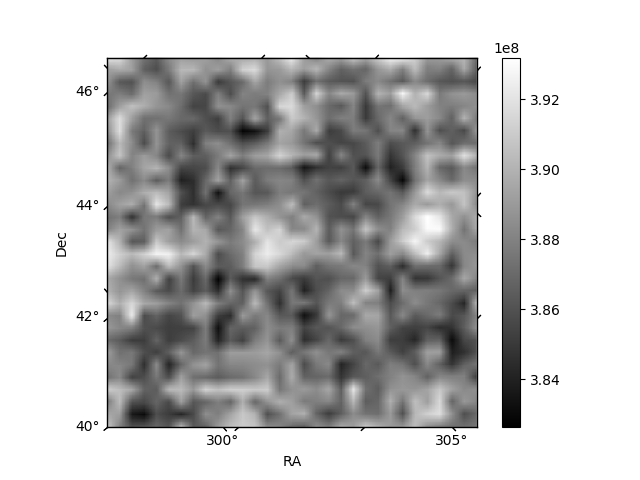
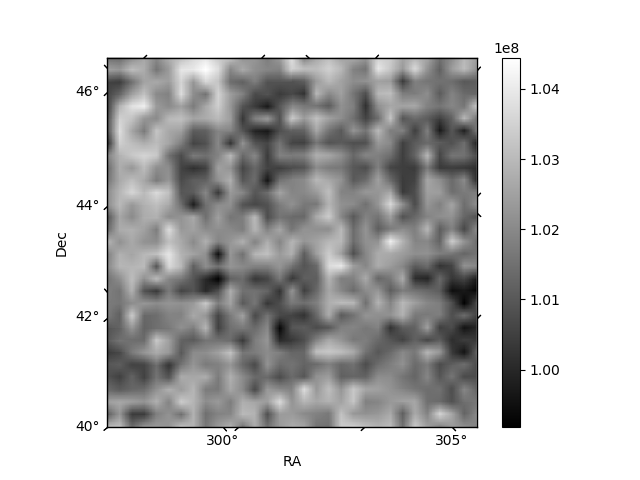
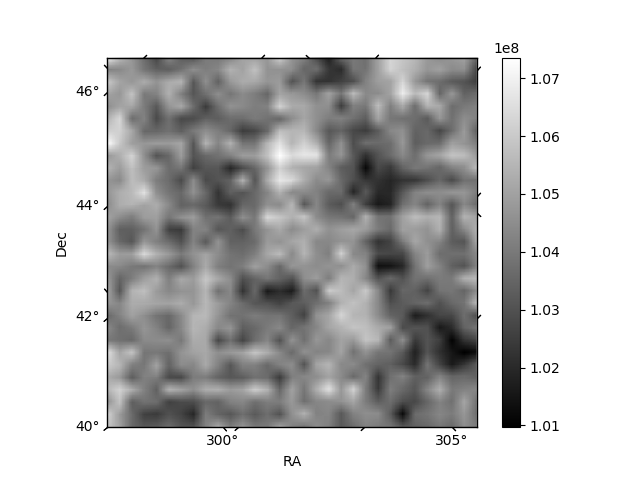
Histogram calculated using DETX and DETY for each event in the final _common_clean file
| Quadrant A | 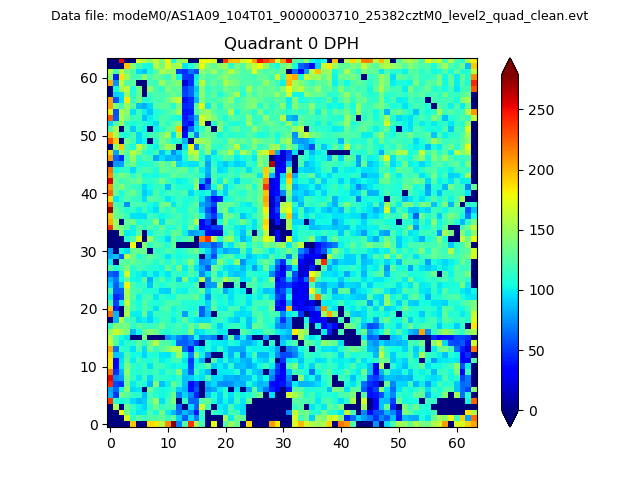 |
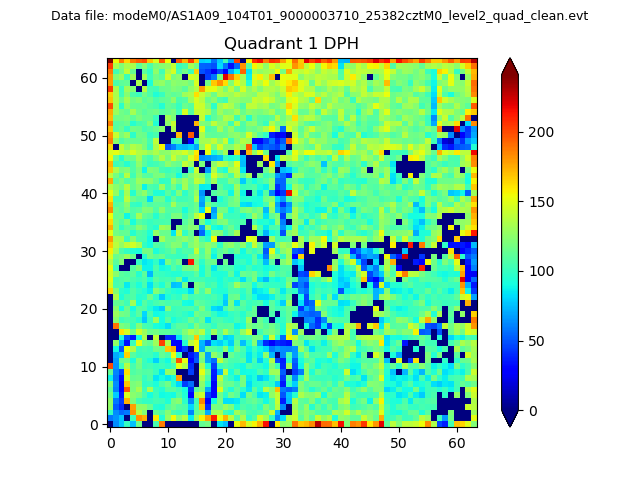 |
Quadrant B |
|---|---|---|---|
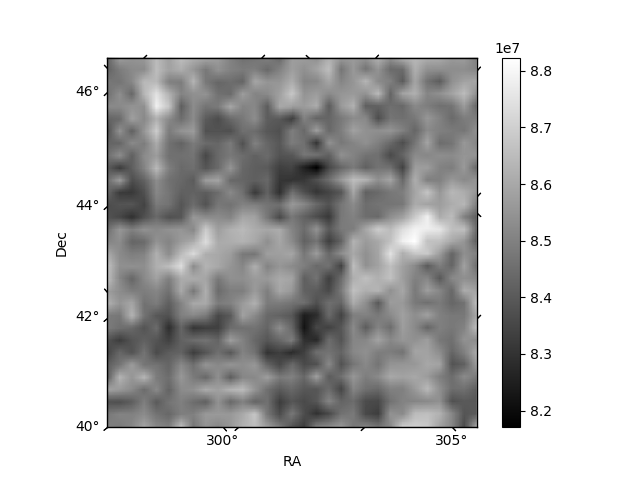
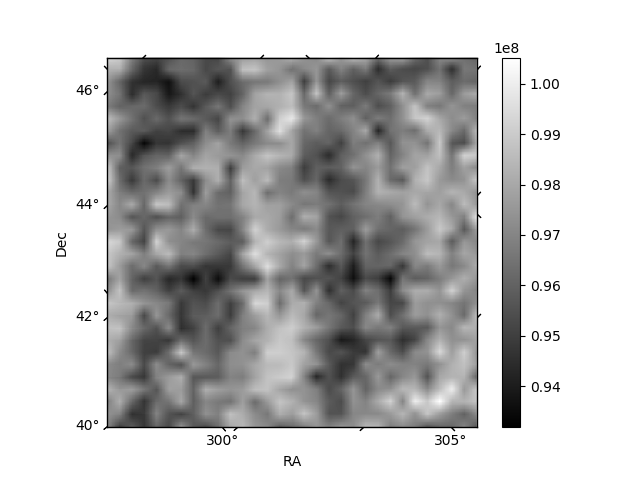
| Quadrant D | 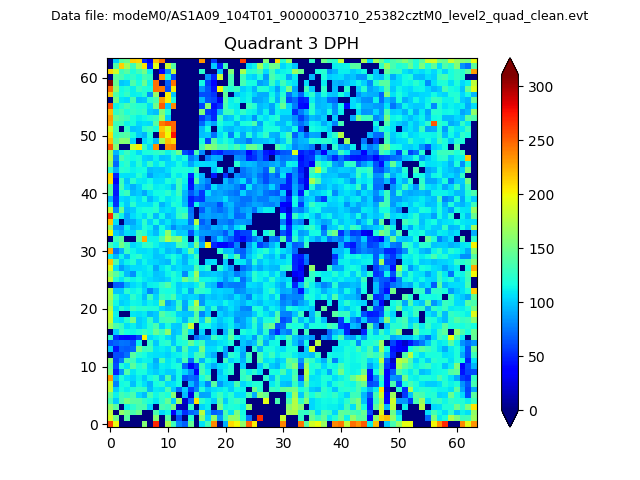 |
 |
Quadrant C |
| Plot type | Count rate plots | Images |
|---|---|---|
| Comparison with Poisson distribution Blue bars denote a histogram of data divided into 1 sec bins. Red curve is a Poisson curve with rate = median count rate of data. |
 |
 |
| Quadrant-wise count rates Data is divided into 100 sec bins |
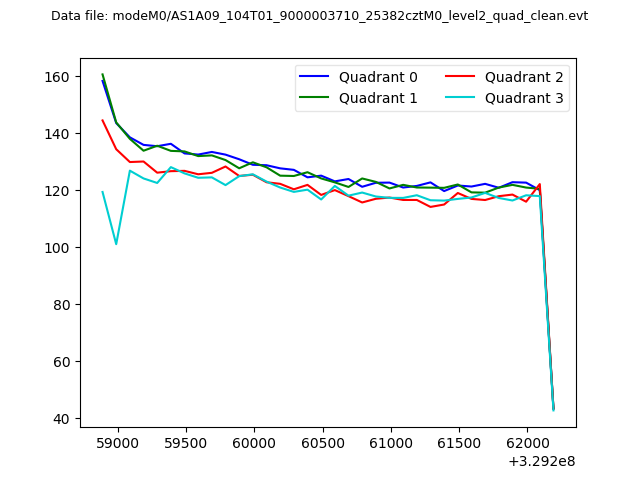 |
|
| Module-wise count rates for Quadrant A Data is divided into 100 sec bins |
 |
 |
| Module-wise count rates for Quadrant B Data is divided into 100 sec bins |
 |
 |
| Module-wise count rates for Quadrant C Data is divided into 100 sec bins |
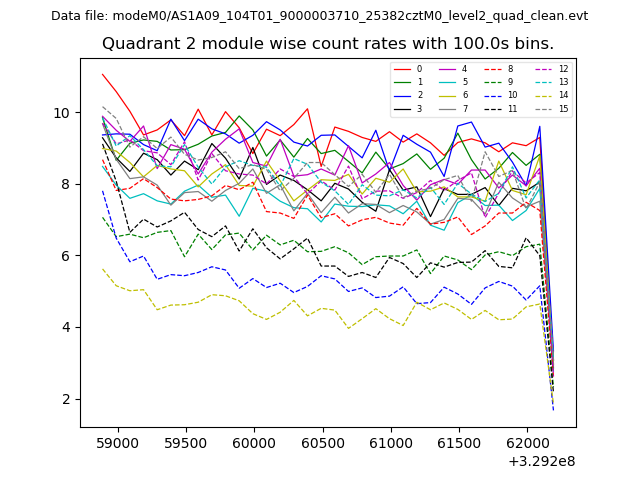 |
 |
| Module-wise count rates for Quadrant D Data is divided into 100 sec bins |
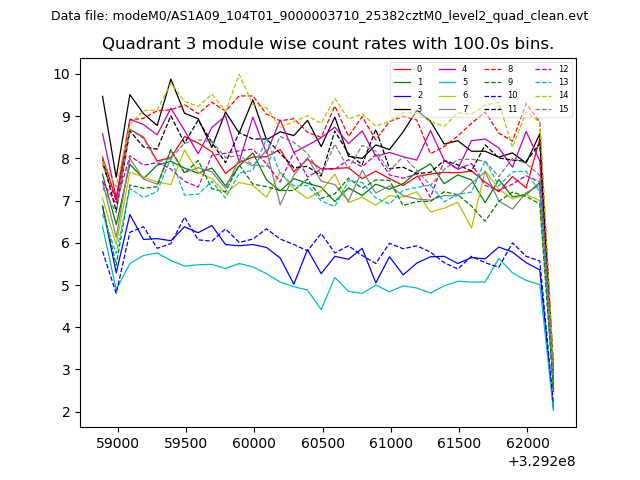 |
 |
| Parameter | Plot |
|---|---|
| CZT HV Monitor | 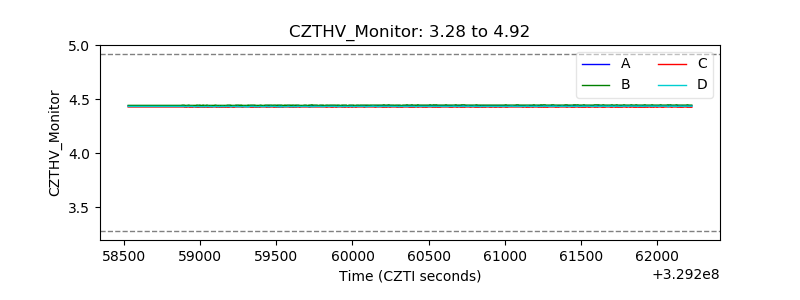 |
| D_VDD | 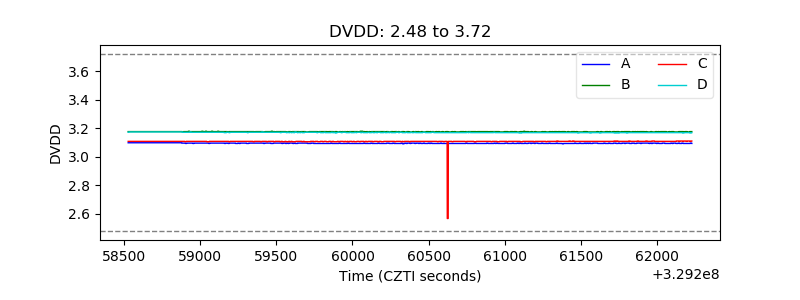 |
| Temperature 1 | 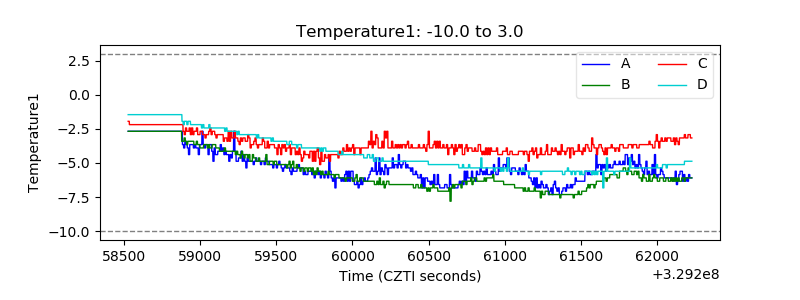 |
| Veto HV Monitor | 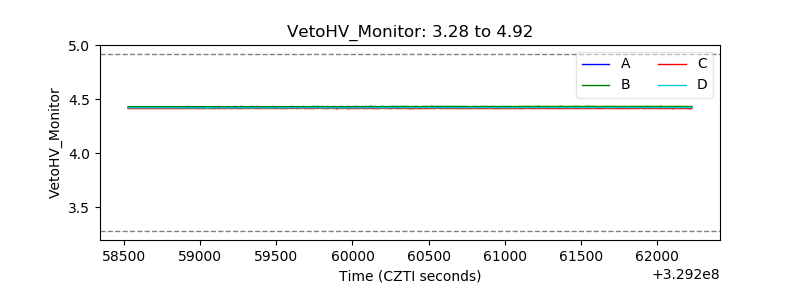 |
| Veto LLD | 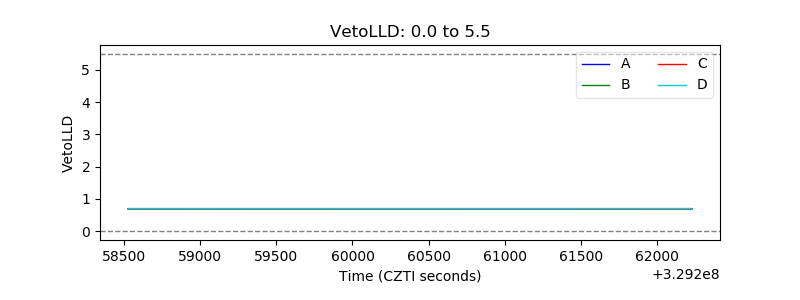 |
| Alpha Counter | 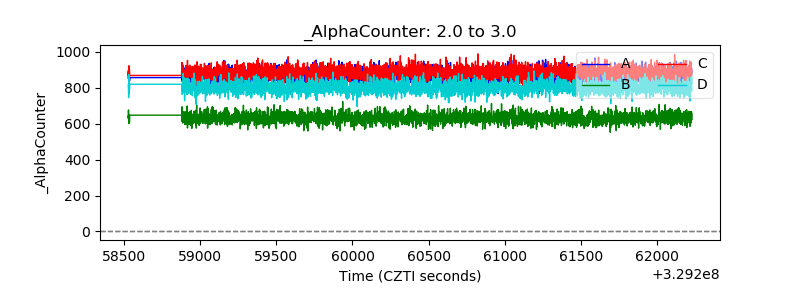 |
| _CPM_Rate | 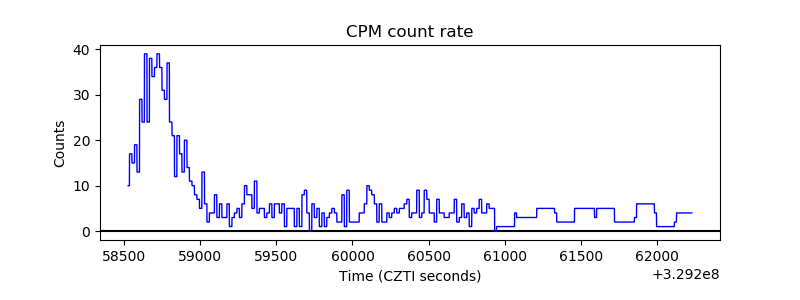 |
| CZT Counter | 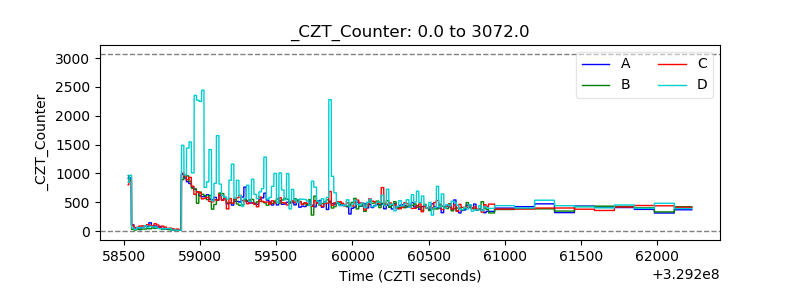 |
| +2.5 Volts monitor |  |
| +5 Volts monitor | 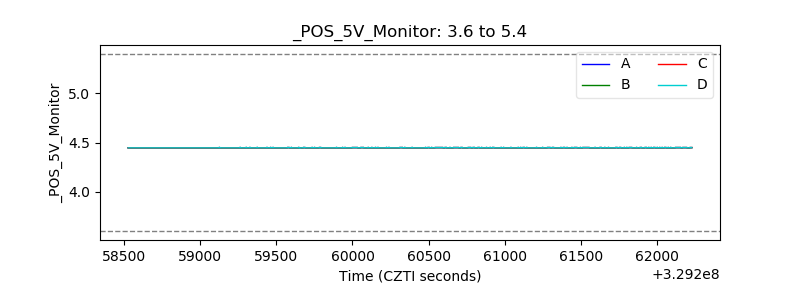 |
| _ROLL_ROT | 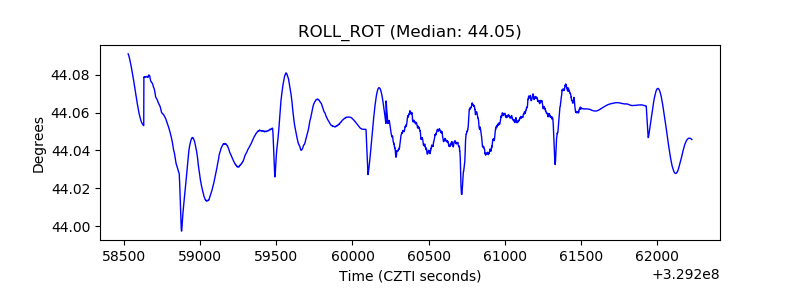 |
| _Roll_DEC | 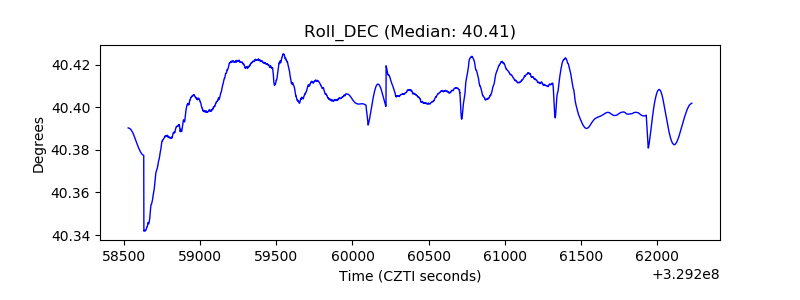 |
| _Roll_RA | 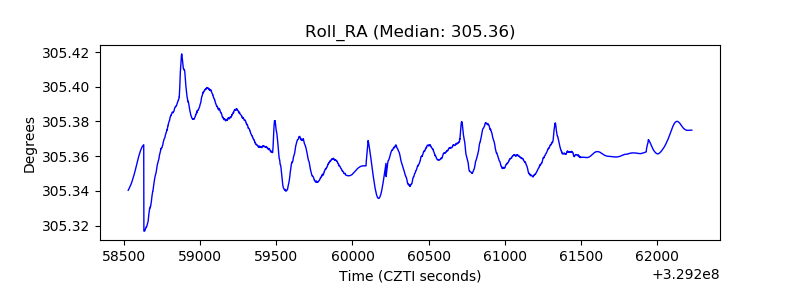 |
| Veto Counter |  |