| Param | Original file | Final file |
|---|---|---|
| Filename | modeM0/AS1A09_057T04_9000003712cztM0_level2.fits | modeM0/AS1A09_057T04_9000003712cztM0_level2_quad_clean.evt |
| Size (bytes) | 1,292,509,440 | 883,664,640 |
| Size | 1.2 GB | 842.7 MB |
| Events in quadrant A | 8,187,322 | 4,727,382 |
| Events in quadrant B | 7,787,652 | 4,777,445 |
| Events in quadrant C | 7,899,078 | 4,500,564 |
| Events in quadrant D | 6,601,522 | 4,088,990 |
| Mode M9 | |||
|---|---|---|---|
| Quadrant | BADHDUFLAG | Total packets | Discarded packets |
| A | 0 | 227 | 0 |
| B | 0 | 227 | 0 |
| C | 0 | 227 | 0 |
| D | 0 | 227 | 0 |
| Mode M0 | |||
|---|---|---|---|
| Quadrant | BADHDUFLAG | Total packets | Discarded packets |
| A | 0 | 301884 | 0 |
| B | 0 | 272168 | 0 |
| C | 0 | 268822 | 0 |
| D | 0 | 424408 | 0 |
| Mode SS | |||
|---|---|---|---|
| Quadrant | BADHDUFLAG | Total packets | Discarded packets |
| A | 0 | 2578 | 0 |
| B | 0 | 2582 | 0 |
| C | 0 | 2582 | 0 |
| D | 0 | 2580 | 0 |
| Quadrant | Total seconds | Saturated seconds | Saturation percentage |
|---|---|---|---|
| A | 126344 | 3055 | 2.418002% |
| B | 126441 | 1740 | 1.376136% |
| C | 126436 | 2065 | 1.633237% |
| D | 126424 | 12705 | 10.049516% |
Noise dominated data is calculated using 1-second bins in cleaned event files. If a bin has >2000 counts, and if more than 50% of those come from <1% of pixels, then it is considered to be noise-dominated and hence unusable.
| Quadrant | # 1 sec bins | Bins with >0 counts | Bins with >2000 counts | High rate bins dominated by noise | Noise dominated (total time) | Noise dominated (detector-on time) | Marked lightcurve |
|---|---|---|---|---|---|---|---|
| A | 149735 | 126553 | 0 | 0 | 0.00% | 0.00% |  |
| B | 149735 | 126661 | 0 | 0 | 0.00% | 0.00% |  |
| C | 149735 | 126645 | 0 | 0 | 0.00% | 0.00% |  |
| D | 149735 | 126279 | 0 | 0 | 0.00% | 0.00% |  |
Top three noisy pixels from each quadrant. If the there are fewer than three noisy pixels in the level2.evt file, extra rows are filled as -1
| Pixel properties | Quadrant properties | ||||||
|---|---|---|---|---|---|---|---|
| Quadrant | DetID | PixID | Counts | Sigma | Mean | Median | Sigma |
| A | 0 | 29 | 7877 | 11.49 | 2132 | 2009 | 510.6 |
| A | 7 | 110 | 6538 | 8.87 | 2132 | 2009 | 510.6 |
| A | 0 | 30 | 6217 | 8.24 | 2132 | 2009 | 510.6 |
| B | 2 | 9 | 6146 | 10.46 | 2060 | 1969 | 399.5 |
| B | 2 | 8 | 5205 | 8.1 | 2060 | 1969 | 399.5 |
| B | 3 | 80 | 5086 | 7.8 | 2060 | 1969 | 399.5 |
| C | 1 | 80 | 6165 | 7.98 | 2086 | 1957 | 527.1 |
| C | 1 | 81 | 6066 | 7.8 | 2086 | 1957 | 527.1 |
| C | 3 | 126 | 5419 | 6.57 | 2086 | 1957 | 527.1 |
| D | 10 | 189 | 4601 | 5.84 | 1889 | 1726 | 492.0 |
| D | 7 | 3 | 4590 | 5.82 | 1889 | 1726 | 492.0 |
| D | 6 | 231 | 4544 | 5.73 | 1889 | 1726 | 492.0 |
Histogram calculated using DETX and DETY for each event in the final _common_clean file
| Quadrant A | 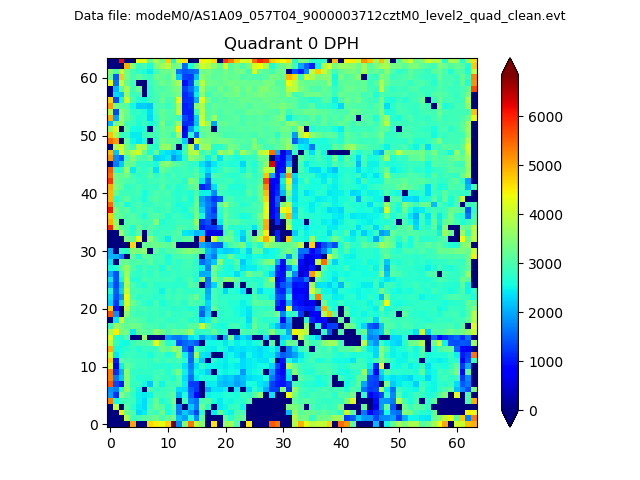 |
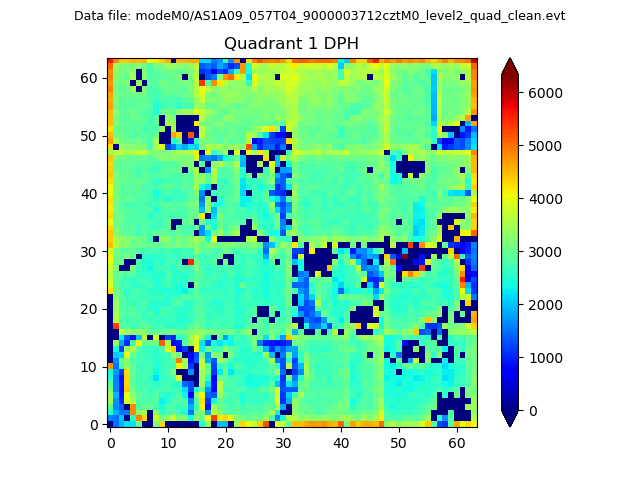 |
Quadrant B |
|---|---|---|---|
| Quadrant D |  |
 |
Quadrant C |
| Plot type | Count rate plots | Images |
|---|---|---|
| Comparison with Poisson distribution Blue bars denote a histogram of data divided into 1 sec bins. Red curve is a Poisson curve with rate = median count rate of data. |
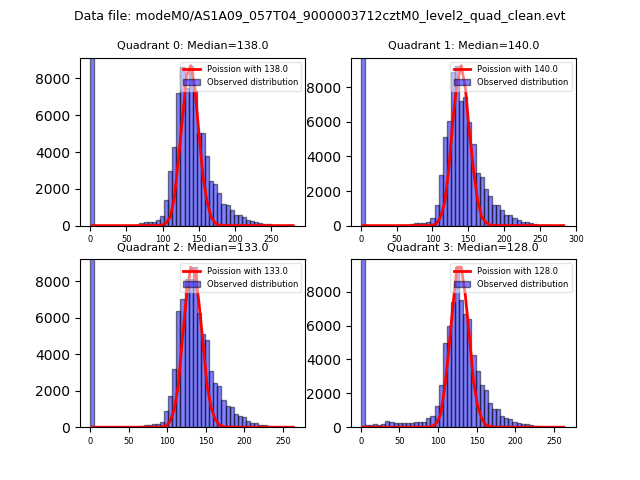 |
 |
| Quadrant-wise count rates Data is divided into 100 sec bins |
 |
|
| Module-wise count rates for Quadrant A Data is divided into 100 sec bins |
 |
 |
| Module-wise count rates for Quadrant B Data is divided into 100 sec bins |
 |
 |
| Module-wise count rates for Quadrant C Data is divided into 100 sec bins |
 |
 |
| Module-wise count rates for Quadrant D Data is divided into 100 sec bins |
 |
 |
| Parameter | Plot |
|---|---|
| CZT HV Monitor |  |
| D_VDD | 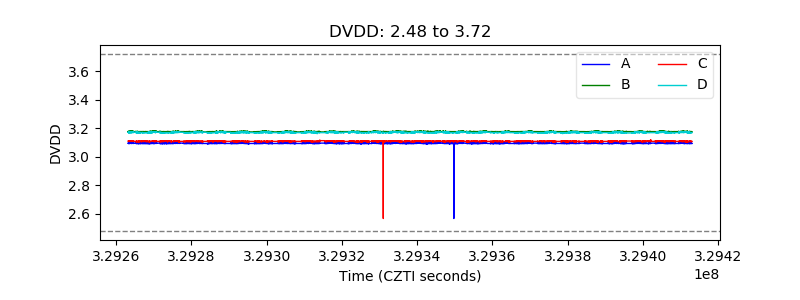 |
| Temperature 1 |  |
| Veto HV Monitor |  |
| Veto LLD | 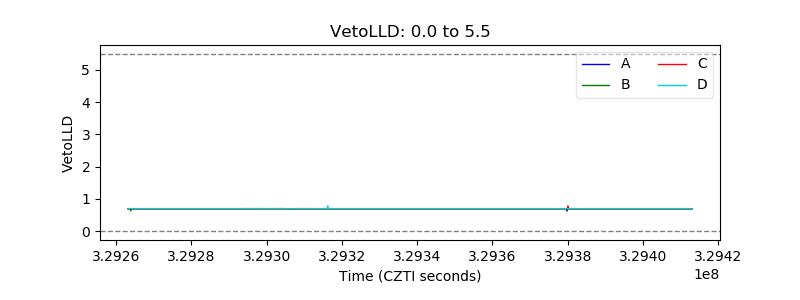 |
| Alpha Counter |  |
| _CPM_Rate |  |
| CZT Counter | 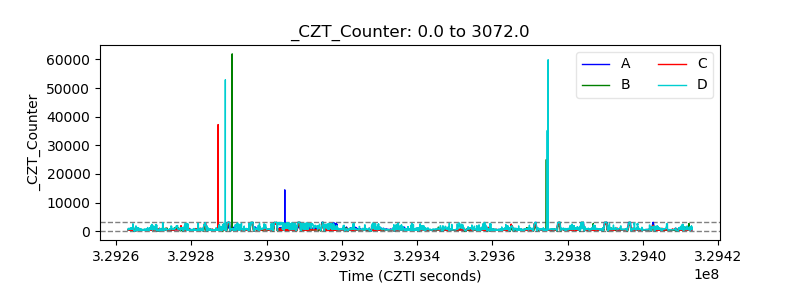 |
| +2.5 Volts monitor | 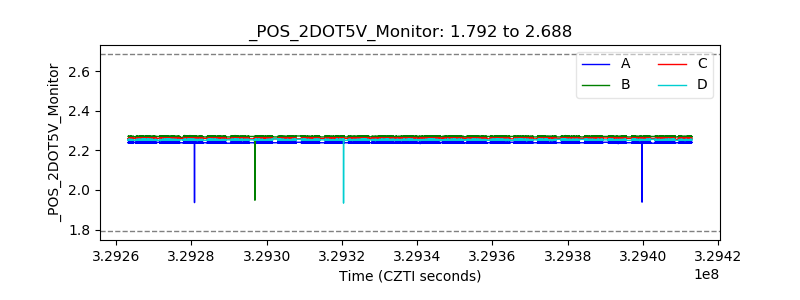 |
| +5 Volts monitor | 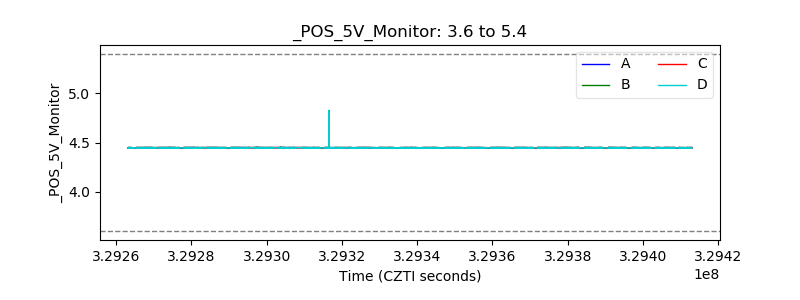 |
| _ROLL_ROT |  |
| _Roll_DEC | 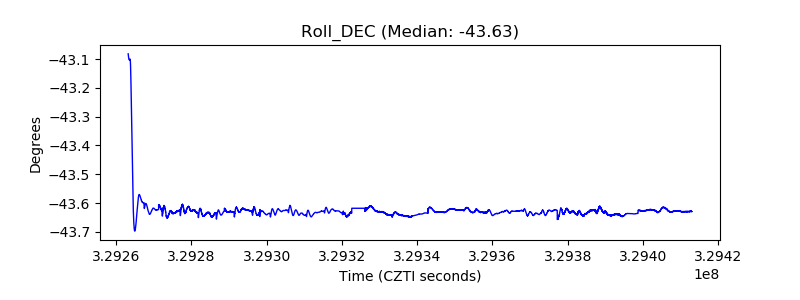 |
| _Roll_RA |  |
| Veto Counter |  |