| Param | Original file | Final file |
|---|---|---|
| Filename | modeM0/AS1A09_057T04_9000003712_25382cztM0_level2.evt | modeM0/AS1A09_057T04_9000003712_25382cztM0_level2_quad_clean.evt |
| Size (bytes) | 678,674,880 | 109,834,560 |
| Size | 647.2 MB | 104.7 MB |
| Events in quadrant A | 4,429,082 | 694,509 |
| Events in quadrant B | 4,603,562 | 698,807 |
| Events in quadrant C | 4,286,155 | 672,967 |
| Events in quadrant D | 6,647,996 | 657,987 |
| Mode M9 | |||
|---|---|---|---|
| Quadrant | BADHDUFLAG | Total packets | Discarded packets |
| A | 0 | 12 | 0 |
| B | 0 | 12 | 0 |
| C | 0 | 12 | 0 |
| D | 0 | 12 | 0 |
| Mode M0 | |||
|---|---|---|---|
| Quadrant | BADHDUFLAG | Total packets | Discarded packets |
| A | 0 | 18613 | 0 |
| B | 0 | 19189 | 0 |
| C | 0 | 17932 | 0 |
| D | 0 | 25561 | 0 |
| Quadrant | Total seconds | Saturated seconds | Saturation percentage |
|---|---|---|---|
| A | 8668 | 42 | 0.484541% |
| B | 8668 | 89 | 1.026765% |
| C | 8668 | 131 | 1.511306% |
| D | 8668 | 480 | 5.537610% |
Noise dominated data is calculated using 1-second bins in cleaned event files. If a bin has >2000 counts, and if more than 50% of those come from <1% of pixels, then it is considered to be noise-dominated and hence unusable.
| Quadrant | # 1 sec bins | Bins with >0 counts | Bins with >2000 counts | High rate bins dominated by noise | Noise dominated (total time) | Noise dominated (detector-on time) | Marked lightcurve |
|---|---|---|---|---|---|---|---|
| A | 9913 | 8669 | 0 | 0 | 0.00% | 0.00% | 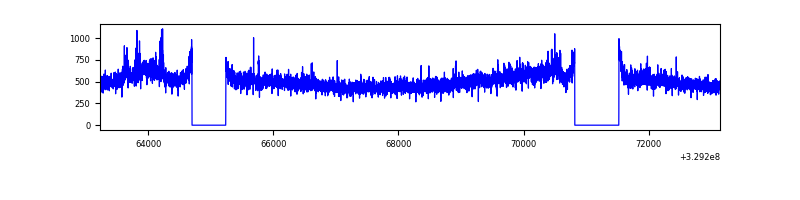 |
| B | 9913 | 8670 | 7 | 7 | 0.07% | 0.08% | 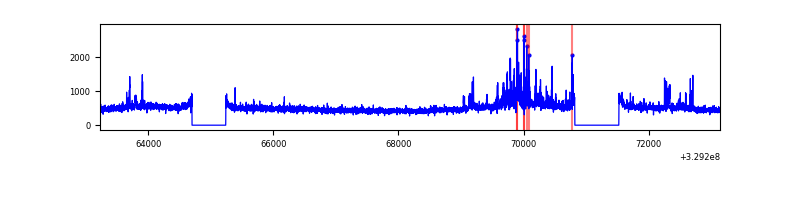 |
| C | 9913 | 8669 | 6 | 6 | 0.06% | 0.07% | 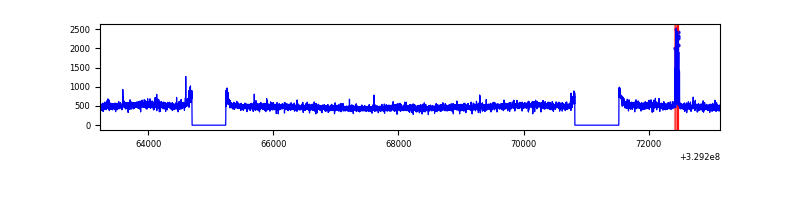 |
| D | 9913 | 8668 | 330 | 330 | 3.33% | 3.81% | 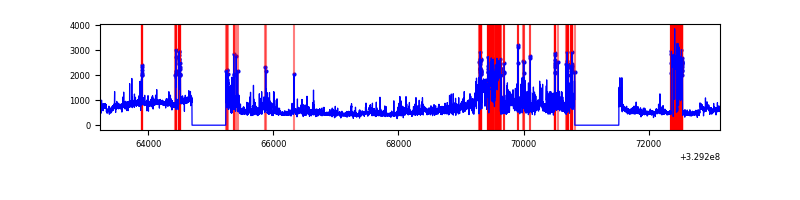 |
Top three noisy pixels from each quadrant. If the there are fewer than three noisy pixels in the level2.evt file, extra rows are filled as -1
| Pixel properties | Quadrant properties | ||||||
|---|---|---|---|---|---|---|---|
| Quadrant | DetID | PixID | Counts | Sigma | Mean | Median | Sigma |
| A | 6 | 16 | 238627 | 1098.48 | 1076 | 1052 | 216.3 |
| A | 15 | 173 | 38894 | 174.97 | 1076 | 1052 | 216.3 |
| A | 13 | 254 | 11808 | 49.73 | 1076 | 1052 | 216.3 |
| B | 3 | 112 | 255896 | 1248.05 | 1063 | 1034 | 204.2 |
| B | 4 | 80 | 69366 | 334.62 | 1063 | 1034 | 204.2 |
| B | 0 | 190 | 58041 | 279.16 | 1063 | 1034 | 204.2 |
| C | 14 | 238 | 163428 | 668.58 | 1032 | 1039 | 242.9 |
| C | 10 | 91 | 82762 | 336.46 | 1032 | 1039 | 242.9 |
| C | 3 | 233 | 16197 | 62.41 | 1032 | 1039 | 242.9 |
| D | 9 | 35 | 1577448 | 6268.02 | 1034 | 1004 | 251.5 |
| D | 7 | 238 | 513334 | 2037.05 | 1034 | 1004 | 251.5 |
| D | 1 | 52 | 388547 | 1540.89 | 1034 | 1004 | 251.5 |
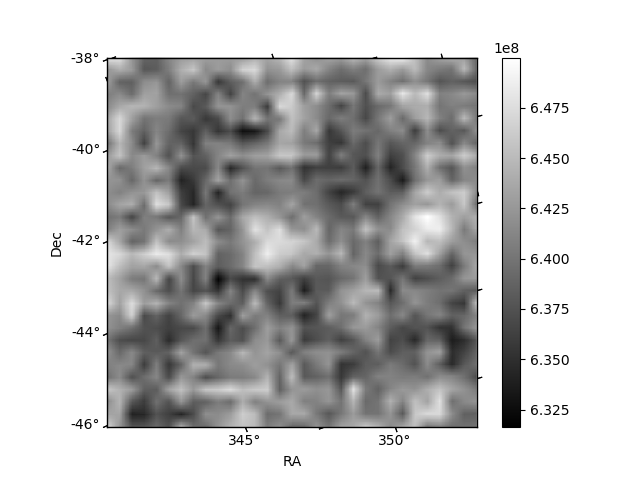
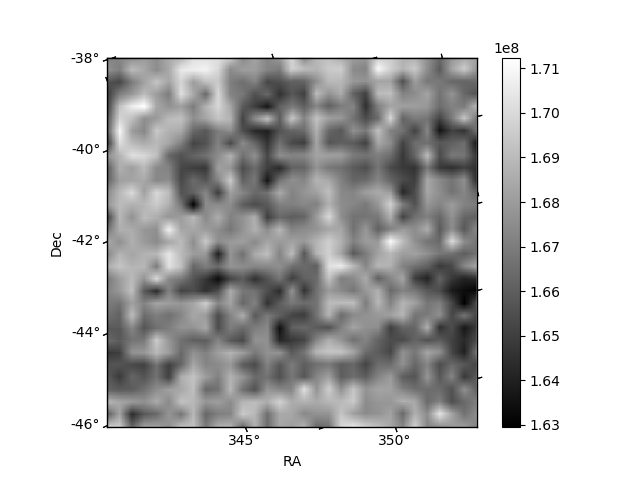
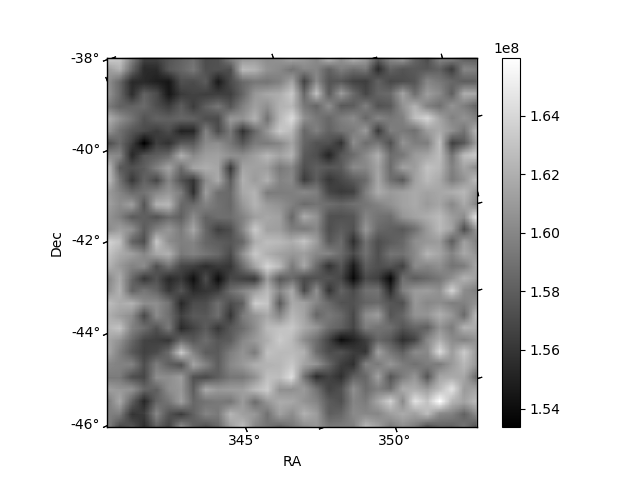
Histogram calculated using DETX and DETY for each event in the final _common_clean file
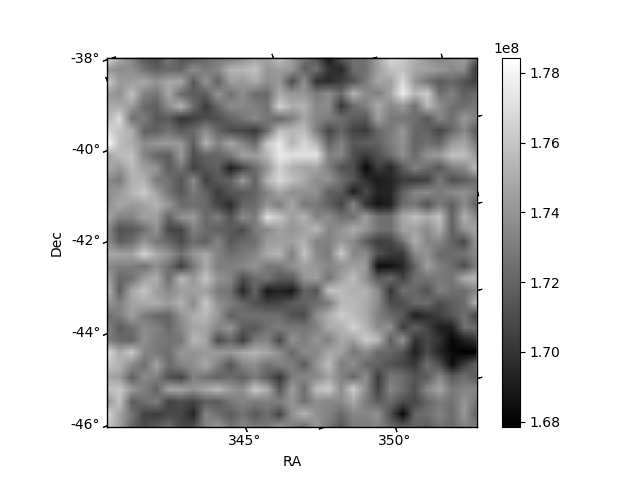
| Quadrant A | 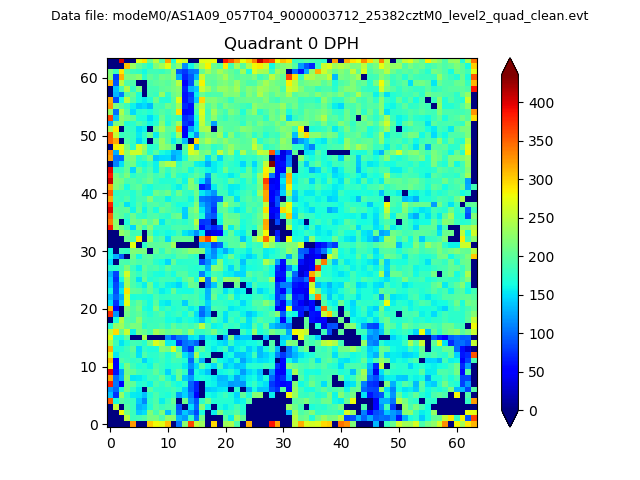 |
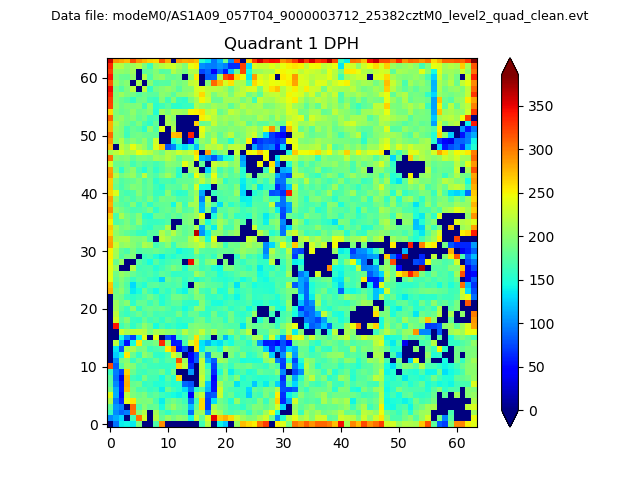 |
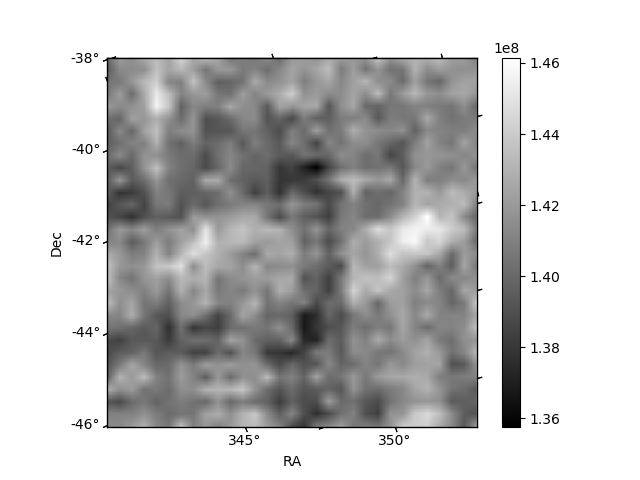
Quadrant B |
|---|---|---|---|
| Quadrant D |  |
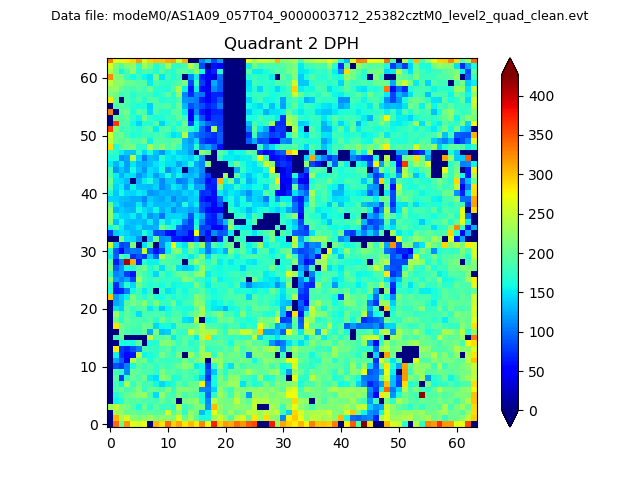 |
Quadrant C |
| Plot type | Count rate plots | Images |
|---|---|---|
| Comparison with Poisson distribution Blue bars denote a histogram of data divided into 1 sec bins. Red curve is a Poisson curve with rate = median count rate of data. |
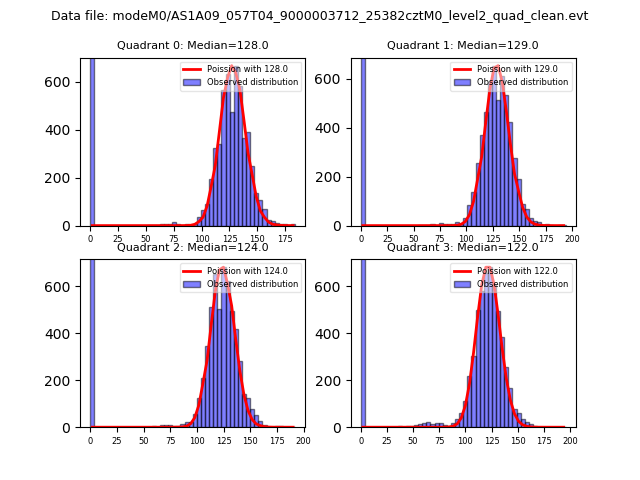 |
 |
| Quadrant-wise count rates Data is divided into 100 sec bins |
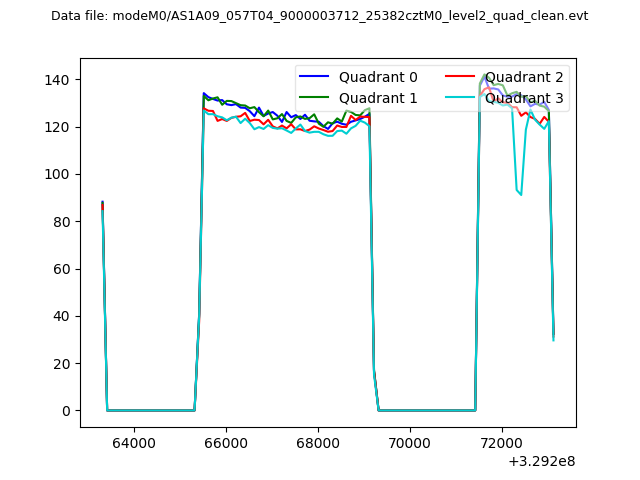 |
|
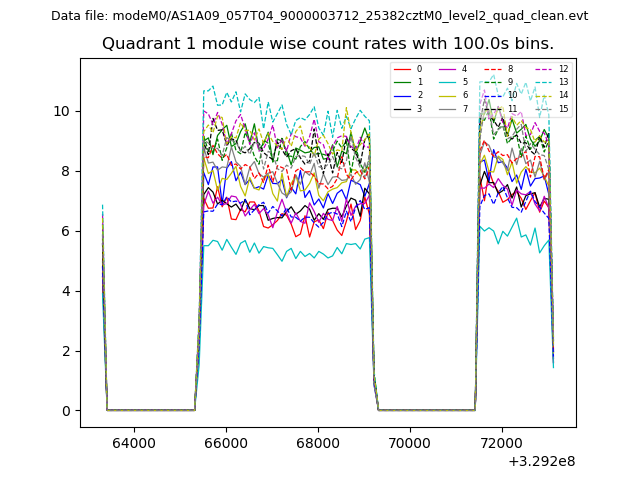
| Module-wise count rates for Quadrant A Data is divided into 100 sec bins |
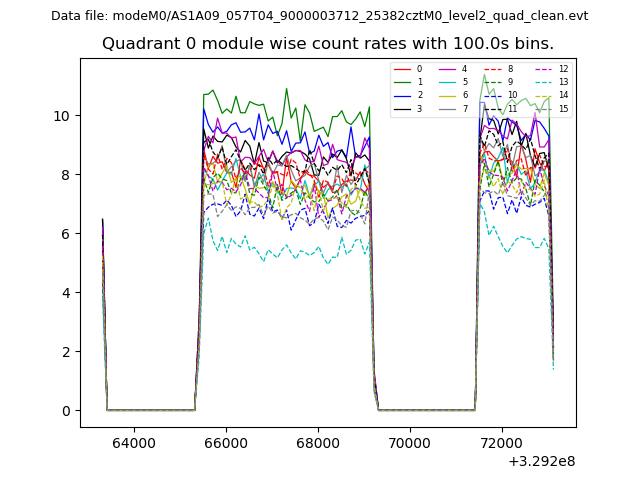 |
 |
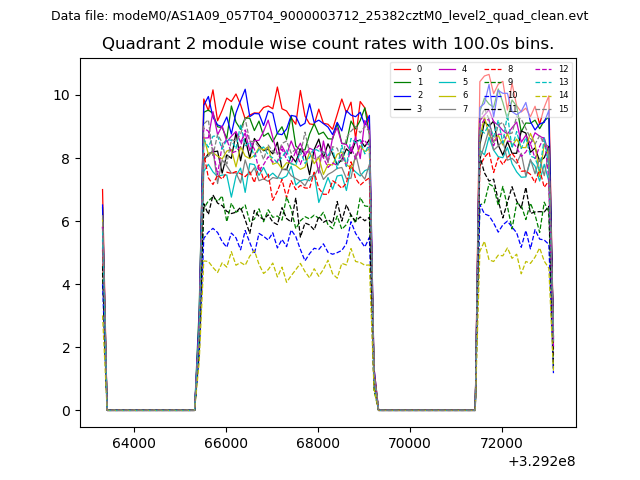
| Module-wise count rates for Quadrant B Data is divided into 100 sec bins |
 |
 |
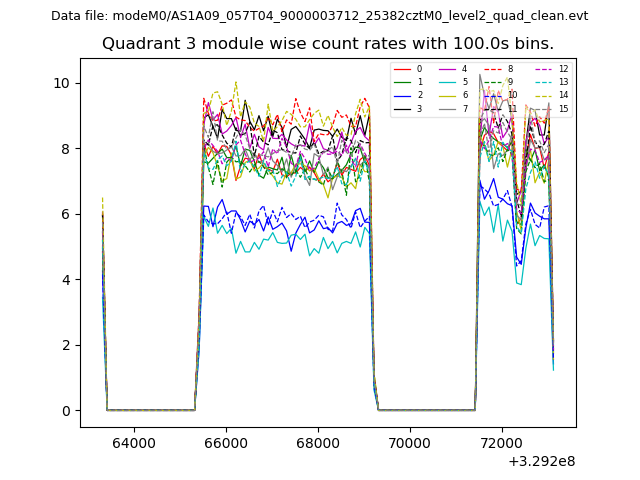
| Module-wise count rates for Quadrant C Data is divided into 100 sec bins |
 |
 |
| Module-wise count rates for Quadrant D Data is divided into 100 sec bins |
 |
 |
| Parameter | Plot |
|---|---|
| CZT HV Monitor | 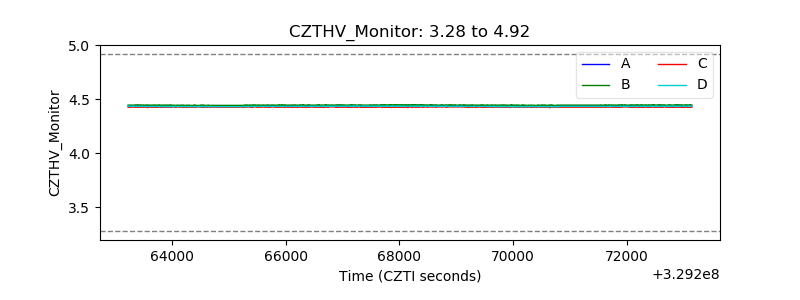 |
| D_VDD | 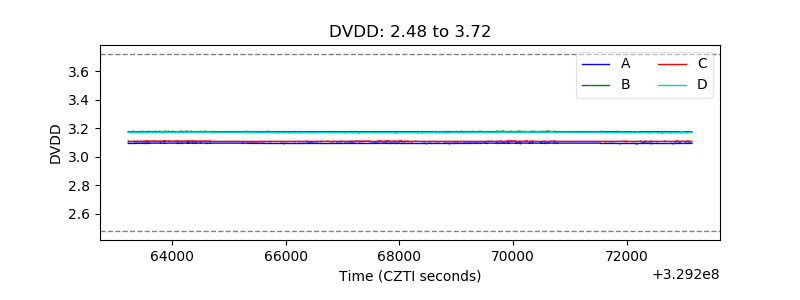 |
| Temperature 1 | 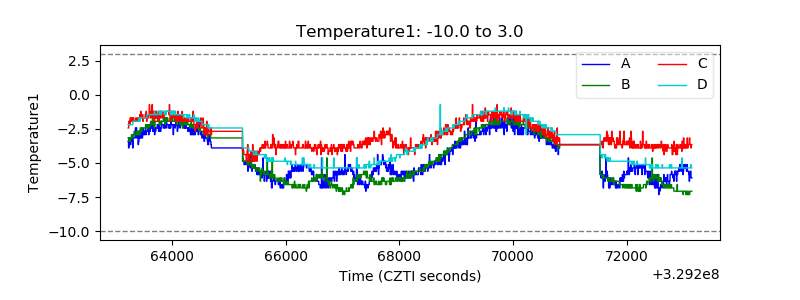 |
| Veto HV Monitor | 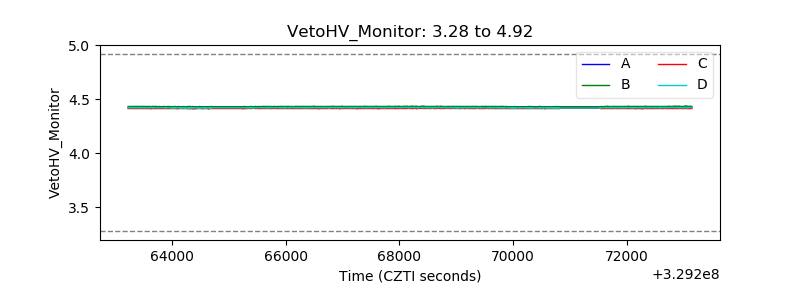 |
| Veto LLD | 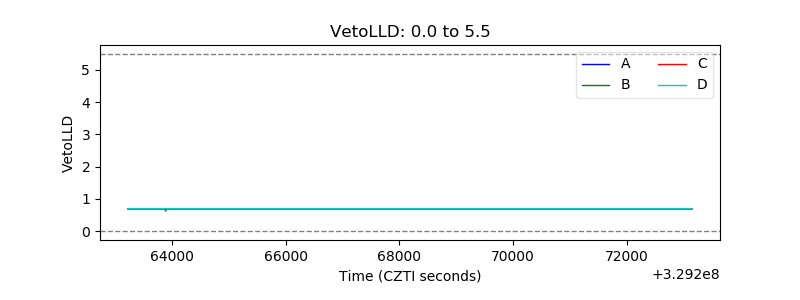 |
| Alpha Counter | 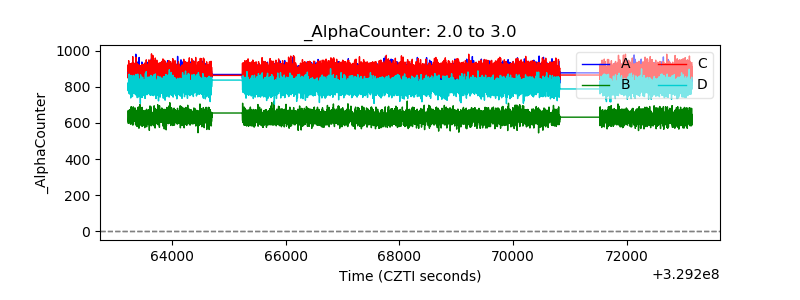 |
| _CPM_Rate |  |
| CZT Counter | 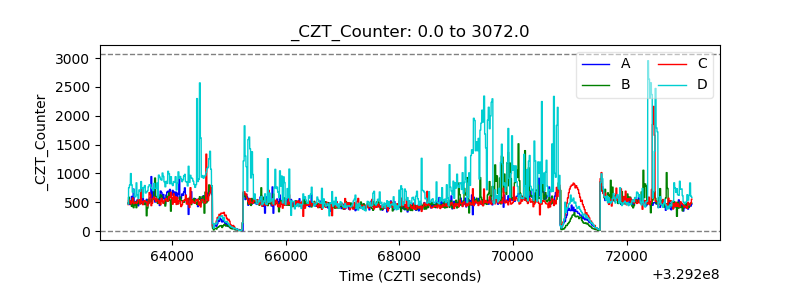 |
| +2.5 Volts monitor |  |
| +5 Volts monitor |  |
| _ROLL_ROT | 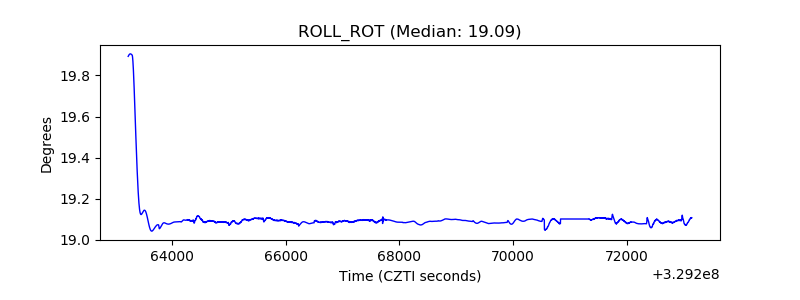 |
| _Roll_DEC | 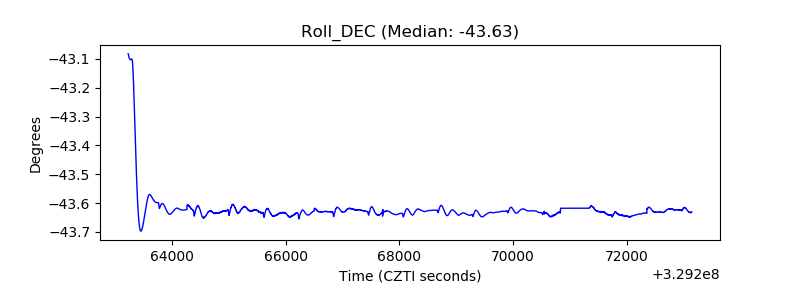 |
| _Roll_RA | 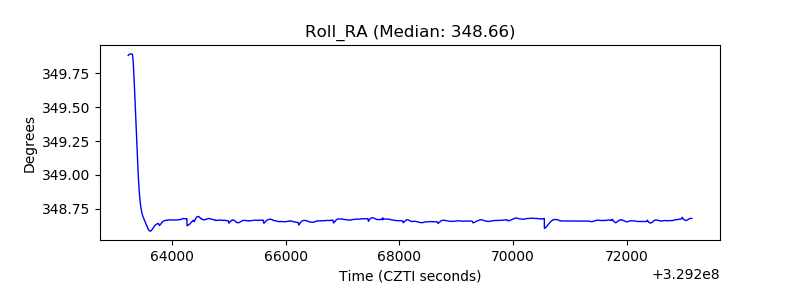 |
| Veto Counter | 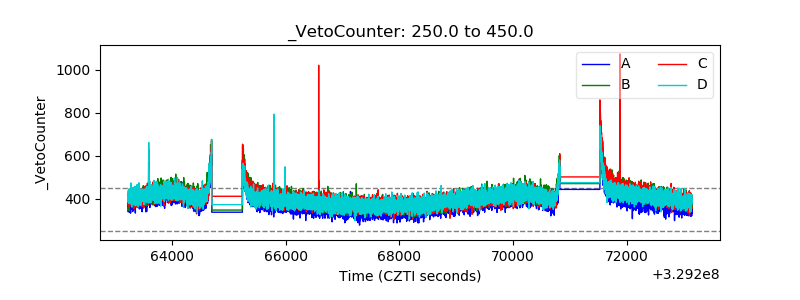 |