| Param | Original file | Final file |
|---|---|---|
| Filename | modeM0/AS1A09_057T04_9000003712_25383cztM0_level2.evt | modeM0/AS1A09_057T04_9000003712_25383cztM0_level2_quad_clean.evt |
| Size (bytes) | 589,224,960 | 100,546,560 |
| Size | 561.9 MB | 95.9 MB |
| Events in quadrant A | 3,481,468 | 655,570 |
| Events in quadrant B | 4,216,297 | 663,577 |
| Events in quadrant C | 3,698,818 | 635,547 |
| Events in quadrant D | 5,981,365 | 609,921 |
| Mode M9 | |||
|---|---|---|---|
| Quadrant | BADHDUFLAG | Total packets | Discarded packets |
| A | 0 | 11 | 0 |
| B | 0 | 12 | 0 |
| C | 0 | 12 | 0 |
| D | 0 | 12 | 0 |
| Mode M0 | |||
|---|---|---|---|
| Quadrant | BADHDUFLAG | Total packets | Discarded packets |
| A | 0 | 14413 | 0 |
| B | 0 | 16969 | 0 |
| C | 0 | 15215 | 0 |
| D | 0 | 22505 | 0 |
| Quadrant | Total seconds | Saturated seconds | Saturation percentage |
|---|---|---|---|
| A | 6892 | 21 | 0.304701% |
| B | 6892 | 153 | 2.219965% |
| C | 6892 | 190 | 2.756820% |
| D | 6892 | 479 | 6.950087% |
Noise dominated data is calculated using 1-second bins in cleaned event files. If a bin has >2000 counts, and if more than 50% of those come from <1% of pixels, then it is considered to be noise-dominated and hence unusable.
| Quadrant | # 1 sec bins | Bins with >0 counts | Bins with >2000 counts | High rate bins dominated by noise | Noise dominated (total time) | Noise dominated (detector-on time) | Marked lightcurve |
|---|---|---|---|---|---|---|---|
| A | 7807 | 6893 | 0 | 0 | 0.00% | 0.00% | 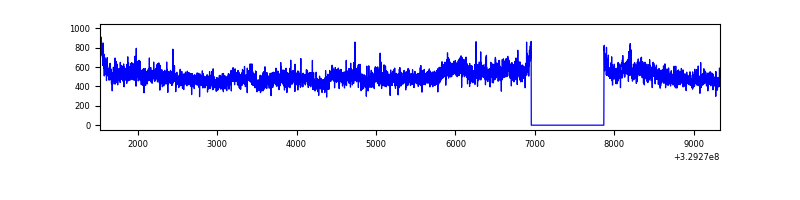 |
| B | 7807 | 6893 | 36 | 36 | 0.46% | 0.52% | 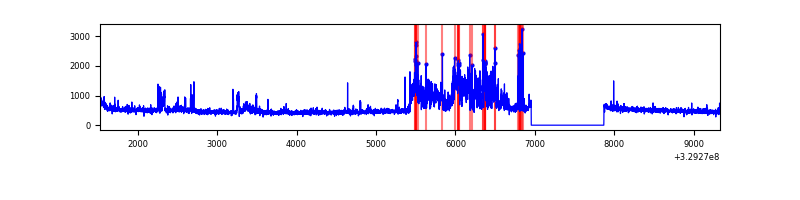 |
| C | 7807 | 6893 | 60 | 60 | 0.77% | 0.87% | 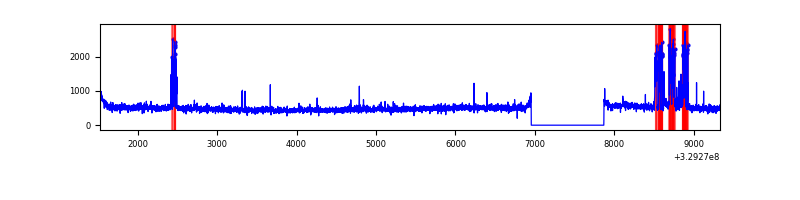 |
| D | 7807 | 6893 | 416 | 416 | 5.33% | 6.04% | 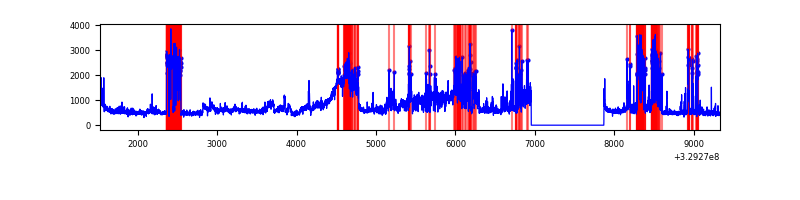 |
Top three noisy pixels from each quadrant. If the there are fewer than three noisy pixels in the level2.evt file, extra rows are filled as -1
| Pixel properties | Quadrant properties | ||||||
|---|---|---|---|---|---|---|---|
| Quadrant | DetID | PixID | Counts | Sigma | Mean | Median | Sigma |
| A | 6 | 16 | 197745 | 1160.75 | 843 | 825 | 169.6 |
| A | 15 | 173 | 23999 | 136.6 | 843 | 825 | 169.6 |
| A | 13 | 254 | 10580 | 57.5 | 843 | 825 | 169.6 |
| B | 3 | 112 | 813227 | 5099.48 | 836 | 813 | 159.3 |
| B | 4 | 80 | 47446 | 292.71 | 836 | 813 | 159.3 |
| B | 12 | 111 | 19894 | 119.77 | 836 | 813 | 159.3 |
| C | 9 | 54 | 283605 | 1456.09 | 817 | 822 | 194.2 |
| C | 14 | 238 | 129149 | 660.78 | 817 | 822 | 194.2 |
| C | 10 | 91 | 77333 | 393.97 | 817 | 822 | 194.2 |
| D | 7 | 238 | 1600892 | 8158.35 | 810 | 786 | 196.1 |
| D | 9 | 35 | 720499 | 3669.55 | 810 | 786 | 196.1 |
| D | 1 | 52 | 226686 | 1151.78 | 810 | 786 | 196.1 |
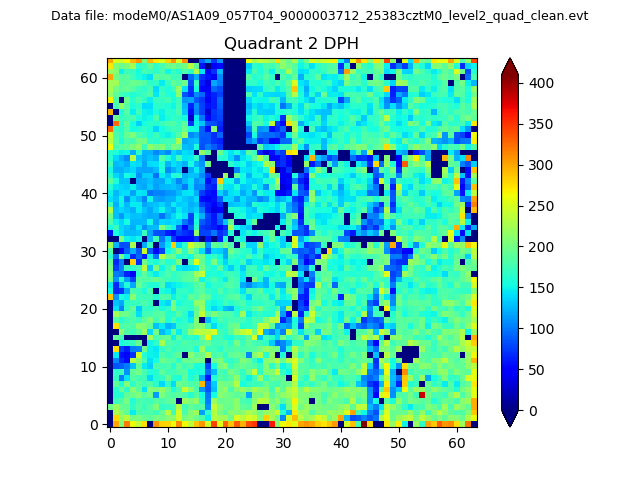
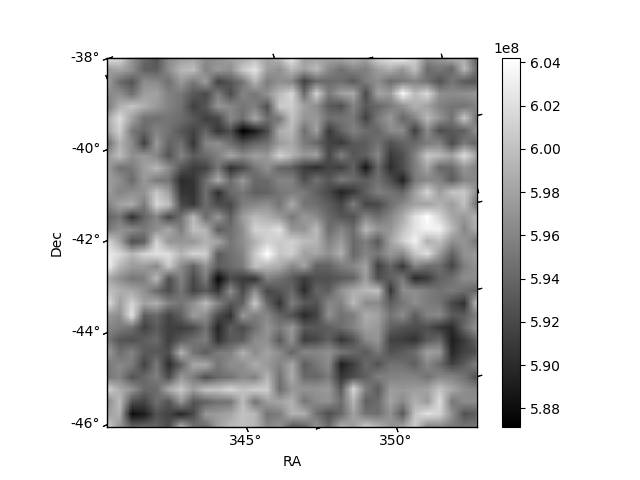
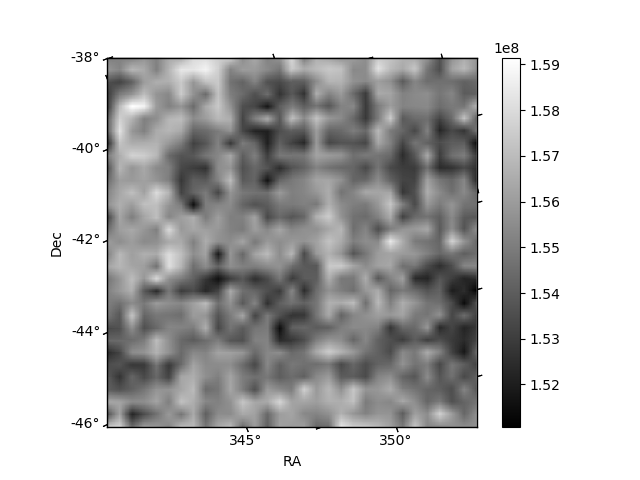
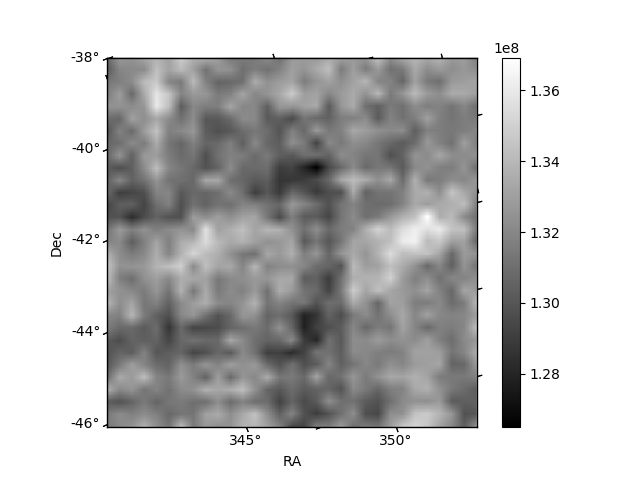
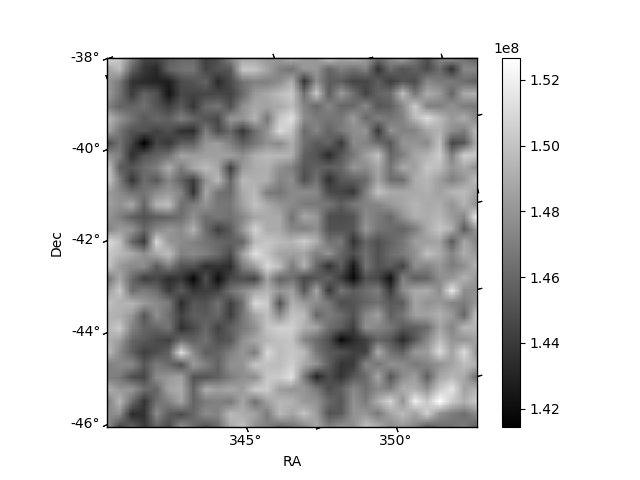
Histogram calculated using DETX and DETY for each event in the final _common_clean file
| Quadrant A | 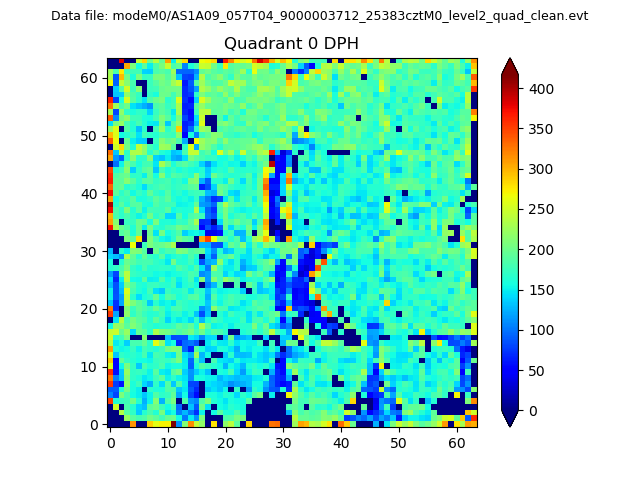 |
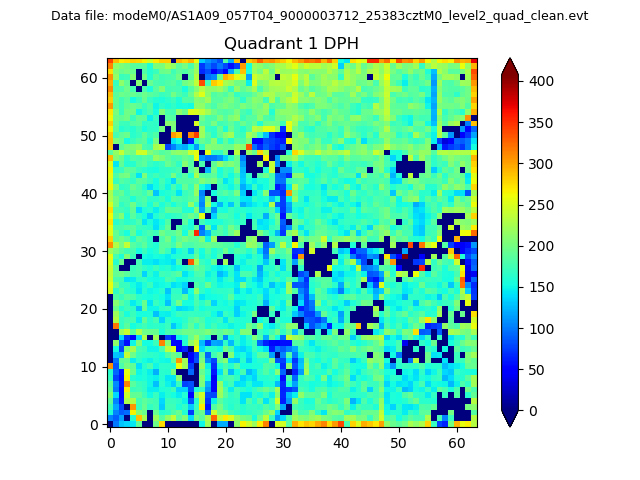 |
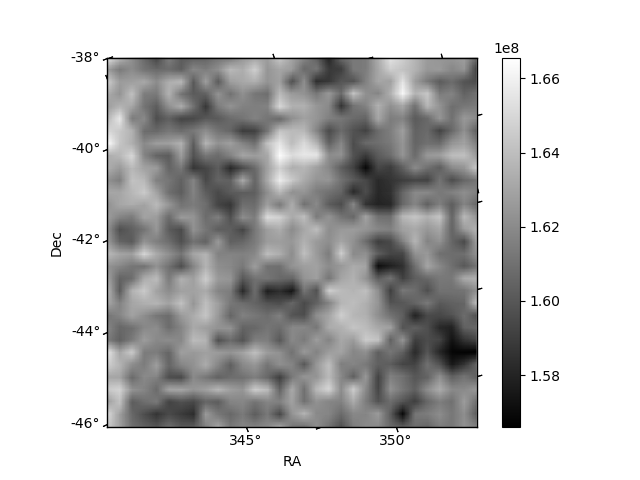
Quadrant B |
|---|---|---|---|
| Quadrant D | 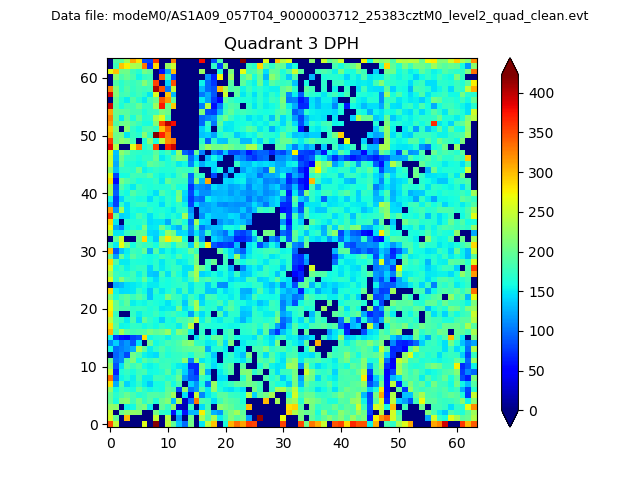 |
 |
Quadrant C |
| Plot type | Count rate plots | Images |
|---|---|---|
| Comparison with Poisson distribution Blue bars denote a histogram of data divided into 1 sec bins. Red curve is a Poisson curve with rate = median count rate of data. |
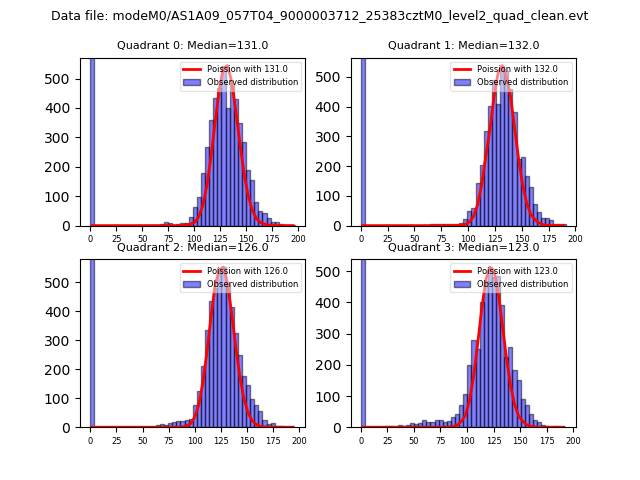 |
 |
| Quadrant-wise count rates Data is divided into 100 sec bins |
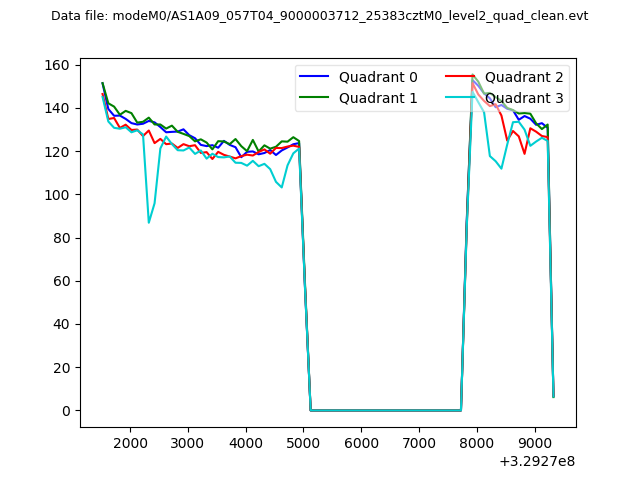 |
|
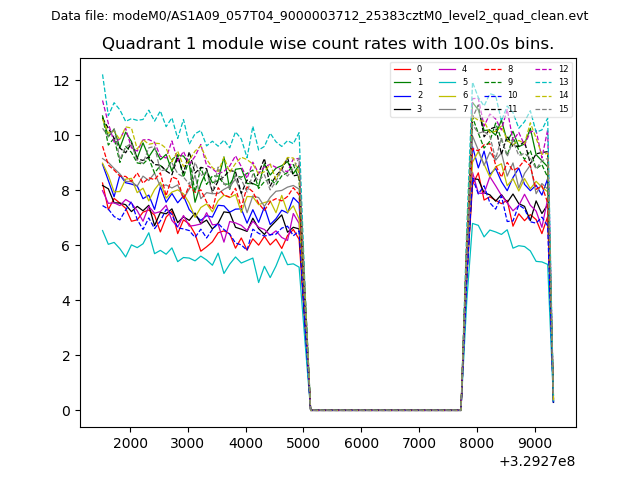
| Module-wise count rates for Quadrant A Data is divided into 100 sec bins |
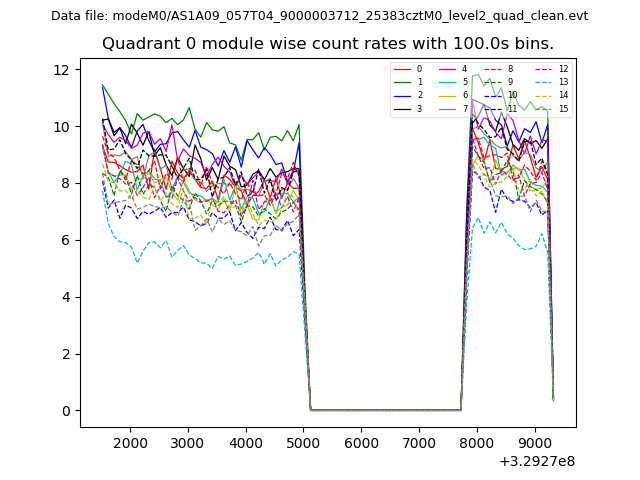 |
 |
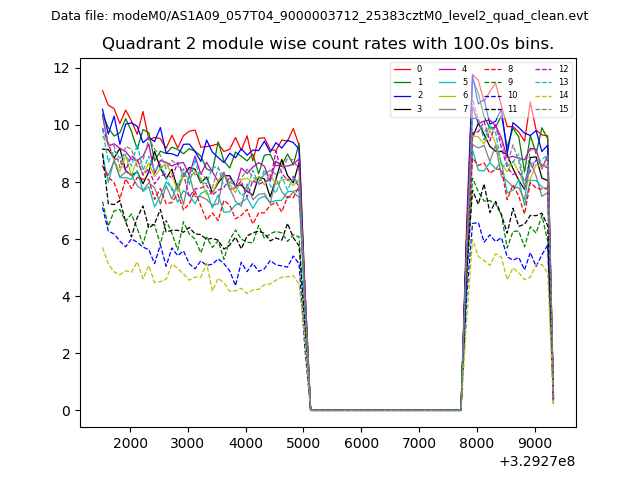
| Module-wise count rates for Quadrant B Data is divided into 100 sec bins |
 |
 |
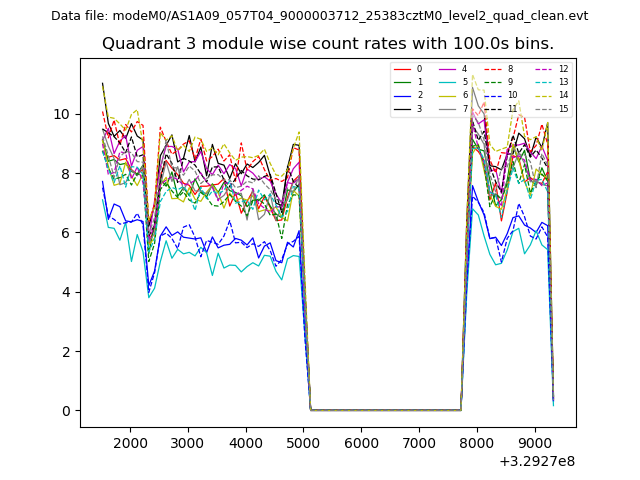
| Module-wise count rates for Quadrant C Data is divided into 100 sec bins |
 |
 |
| Module-wise count rates for Quadrant D Data is divided into 100 sec bins |
 |
 |
| Parameter | Plot |
|---|---|
| CZT HV Monitor | 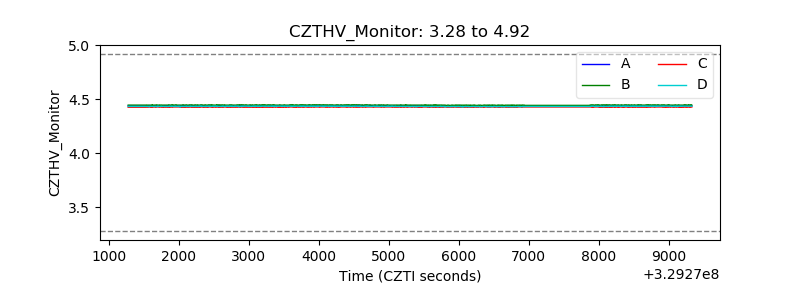 |
| D_VDD | 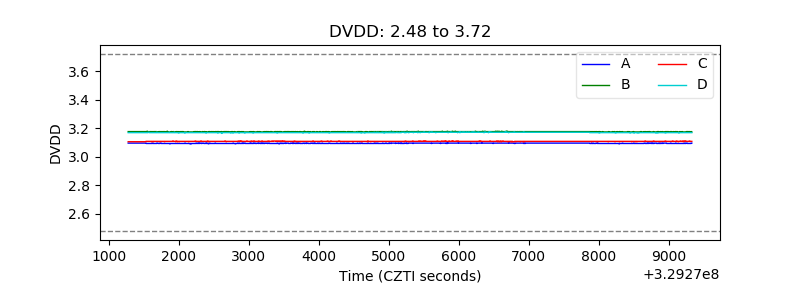 |
| Temperature 1 | 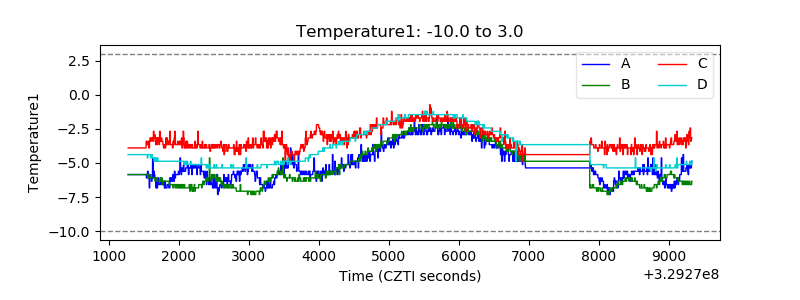 |
| Veto HV Monitor | 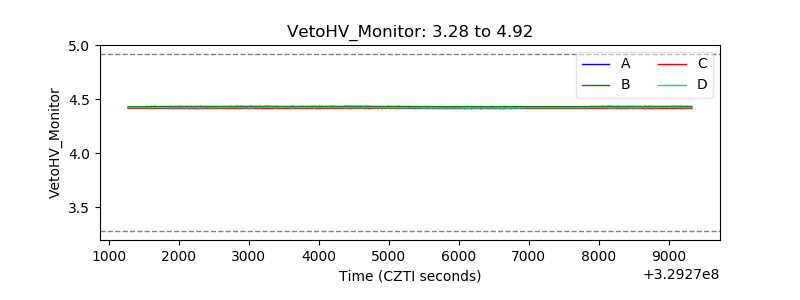 |
| Veto LLD | 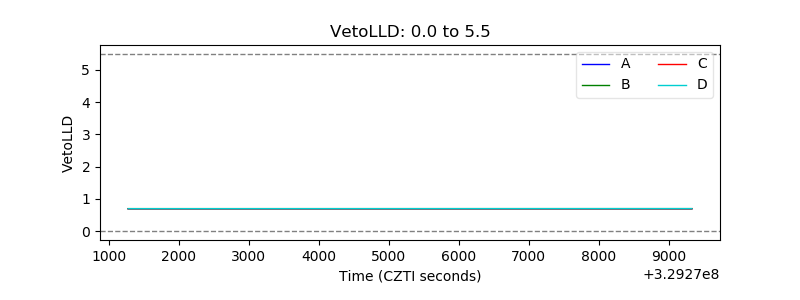 |
| Alpha Counter | 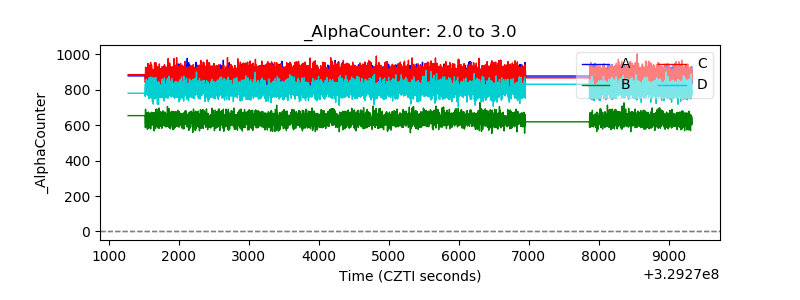 |
| _CPM_Rate | 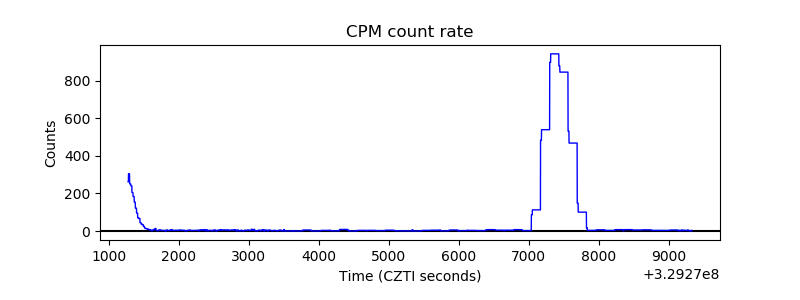 |
| CZT Counter | 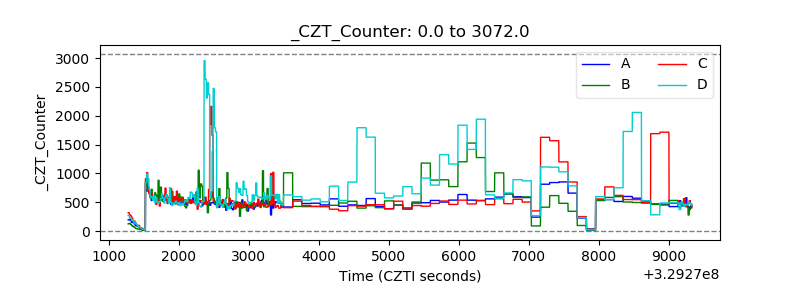 |
| +2.5 Volts monitor |  |
| +5 Volts monitor |  |
| _ROLL_ROT | 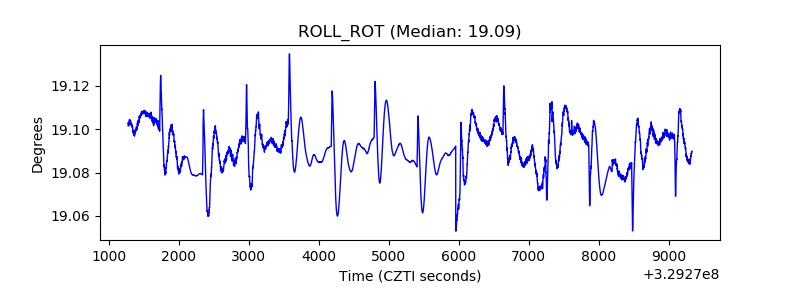 |
| _Roll_DEC | 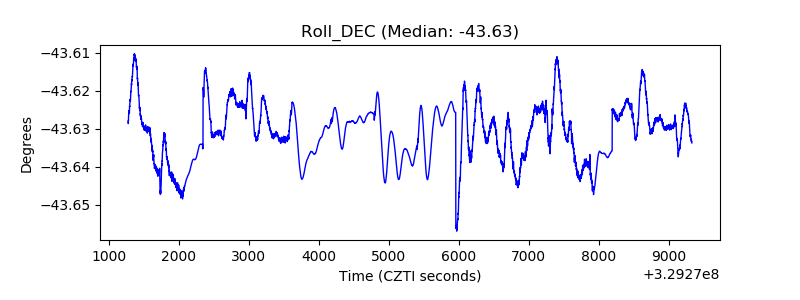 |
| _Roll_RA | 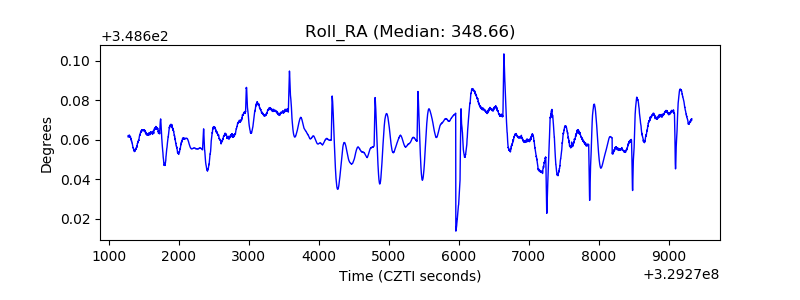 |
| Veto Counter | 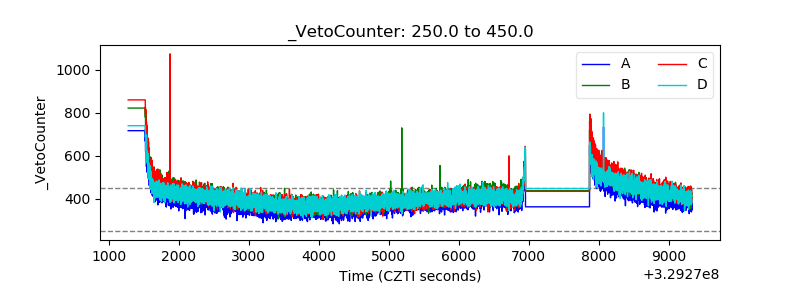 |