| Param | Original file | Final file |
|---|---|---|
| Filename | modeM0/AS1A09_057T04_9000003712_25384cztM0_level2.evt | modeM0/AS1A09_057T04_9000003712_25384cztM0_level2_quad_clean.evt |
| Size (bytes) | 480,588,480 | 95,362,560 |
| Size | 458.3 MB | 90.9 MB |
| Events in quadrant A | 3,280,813 | 617,645 |
| Events in quadrant B | 3,239,312 | 625,564 |
| Events in quadrant C | 3,584,696 | 601,908 |
| Events in quadrant D | 4,004,890 | 585,864 |
| Mode M9 | |||
|---|---|---|---|
| Quadrant | BADHDUFLAG | Total packets | Discarded packets |
| A | 0 | 11 | 0 |
| B | 0 | 12 | 0 |
| C | 0 | 12 | 0 |
| D | 0 | 12 | 0 |
| Mode M0 | |||
|---|---|---|---|
| Quadrant | BADHDUFLAG | Total packets | Discarded packets |
| A | 0 | 13811 | 0 |
| B | 0 | 13640 | 0 |
| C | 0 | 14727 | 0 |
| D | 0 | 16107 | 0 |
| Quadrant | Total seconds | Saturated seconds | Saturation percentage |
|---|---|---|---|
| A | 6548 | 14 | 0.213806% |
| B | 6548 | 29 | 0.442883% |
| C | 6548 | 163 | 2.489310% |
| D | 6548 | 229 | 3.497251% |
Noise dominated data is calculated using 1-second bins in cleaned event files. If a bin has >2000 counts, and if more than 50% of those come from <1% of pixels, then it is considered to be noise-dominated and hence unusable.
| Quadrant | # 1 sec bins | Bins with >0 counts | Bins with >2000 counts | High rate bins dominated by noise | Noise dominated (total time) | Noise dominated (detector-on time) | Marked lightcurve |
|---|---|---|---|---|---|---|---|
| A | 7608 | 6549 | 0 | 0 | 0.00% | 0.00% | 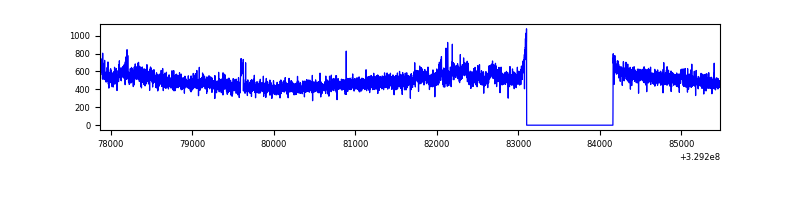 |
| B | 7608 | 6548 | 0 | 0 | 0.00% | 0.00% |  |
| C | 7608 | 6549 | 55 | 55 | 0.72% | 0.84% | 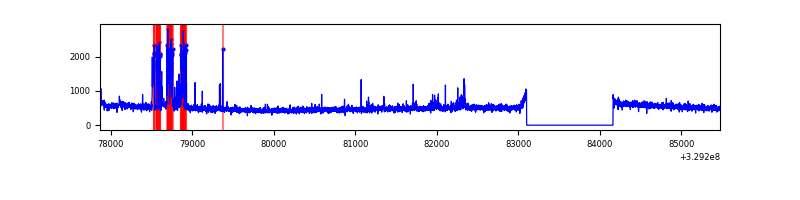 |
| D | 7608 | 6549 | 185 | 185 | 2.43% | 2.82% | 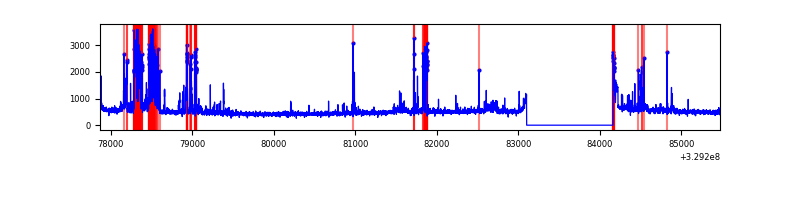 |
Top three noisy pixels from each quadrant. If the there are fewer than three noisy pixels in the level2.evt file, extra rows are filled as -1
| Pixel properties | Quadrant properties | ||||||
|---|---|---|---|---|---|---|---|
| Quadrant | DetID | PixID | Counts | Sigma | Mean | Median | Sigma |
| A | 6 | 16 | 91430 | 553.57 | 819 | 802 | 163.7 |
| A | 15 | 173 | 25688 | 152.01 | 819 | 802 | 163.7 |
| A | 13 | 254 | 9211 | 51.36 | 819 | 802 | 163.7 |
| B | 12 | 111 | 19411 | 120.82 | 812 | 792 | 154.1 |
| B | 0 | 190 | 18075 | 112.15 | 812 | 792 | 154.1 |
| B | 11 | 111 | 17163 | 106.23 | 812 | 792 | 154.1 |
| C | 9 | 54 | 295914 | 1577.86 | 796 | 803 | 187.0 |
| C | 14 | 238 | 126495 | 672.03 | 796 | 803 | 187.0 |
| C | 3 | 233 | 53307 | 280.72 | 796 | 803 | 187.0 |
| D | 7 | 238 | 554375 | 2858.11 | 802 | 779 | 193.7 |
| D | 1 | 52 | 251052 | 1292.11 | 802 | 779 | 193.7 |
| D | 8 | 195 | 115940 | 594.55 | 802 | 779 | 193.7 |
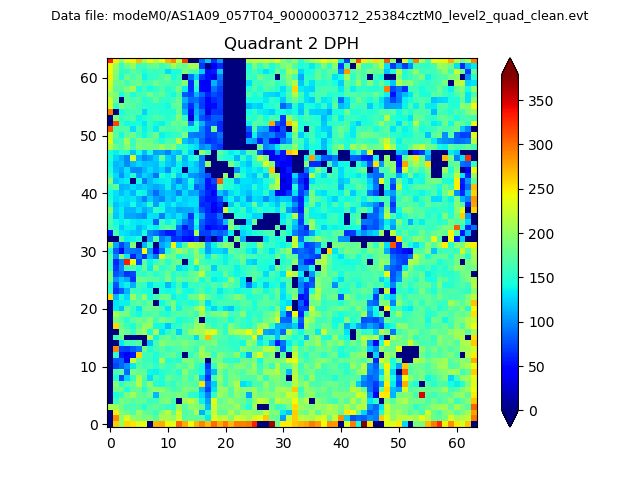
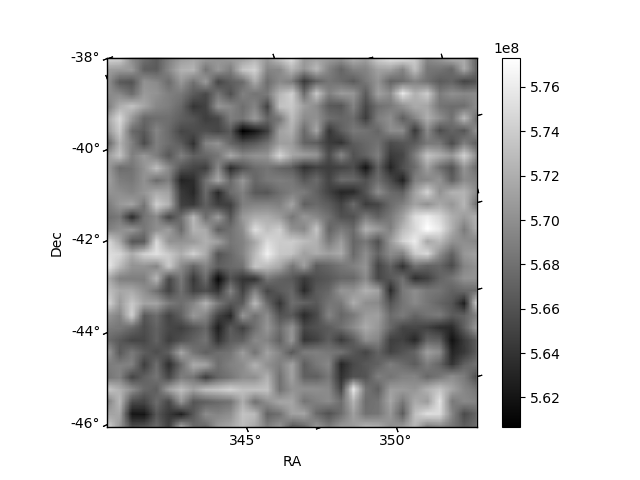
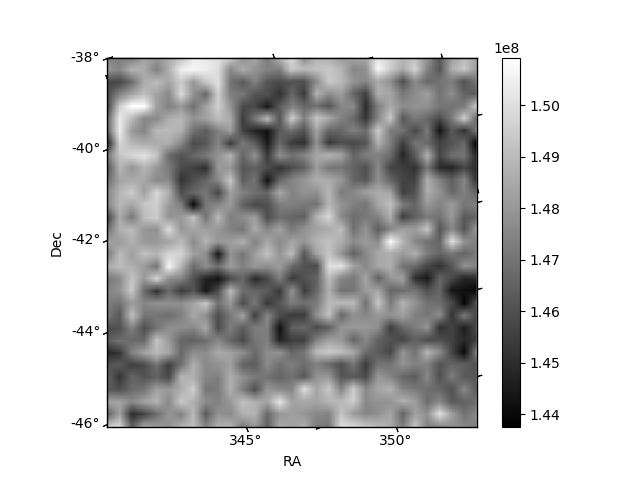
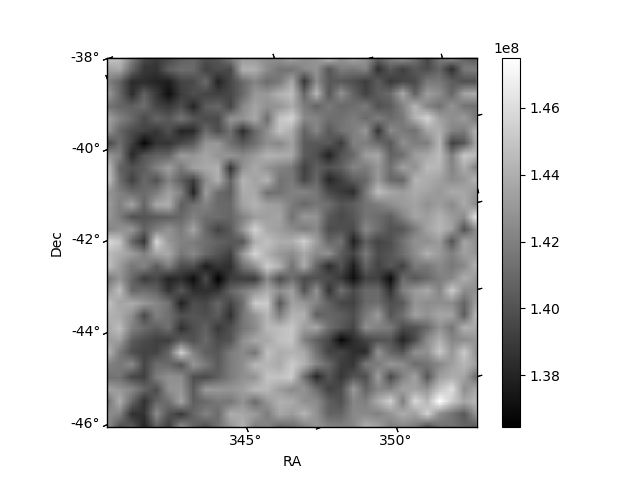
Histogram calculated using DETX and DETY for each event in the final _common_clean file
| Quadrant A | 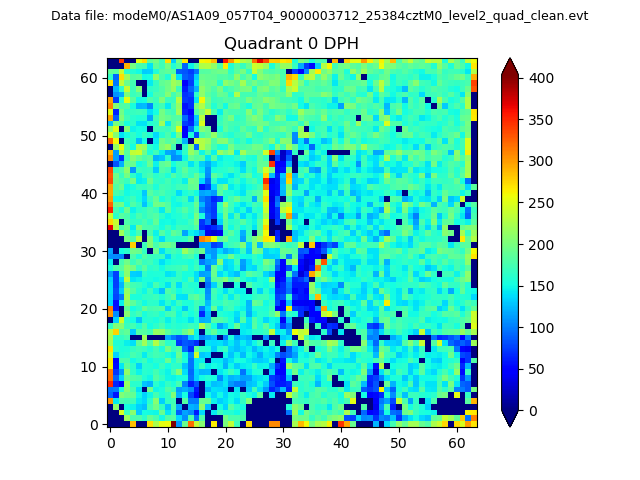 |
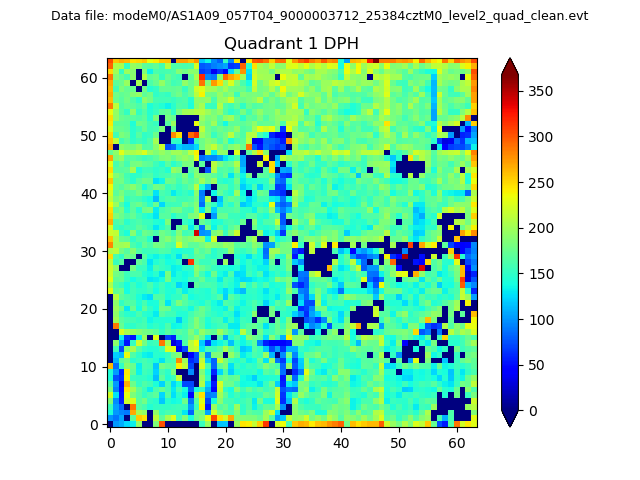 |
Quadrant B |
|---|---|---|---|
| Quadrant D | 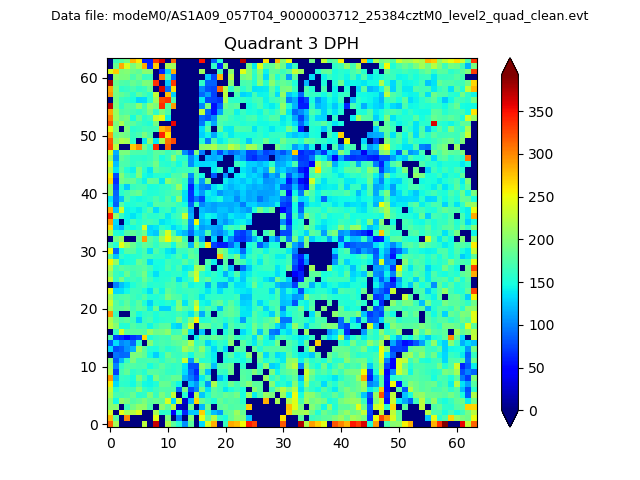 |
 |
Quadrant C |
| Plot type | Count rate plots | Images |
|---|---|---|
| Comparison with Poisson distribution Blue bars denote a histogram of data divided into 1 sec bins. Red curve is a Poisson curve with rate = median count rate of data. |
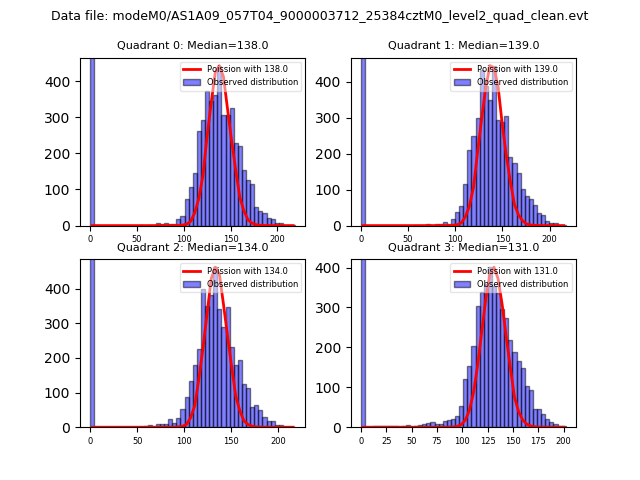 |
 |
| Quadrant-wise count rates Data is divided into 100 sec bins |
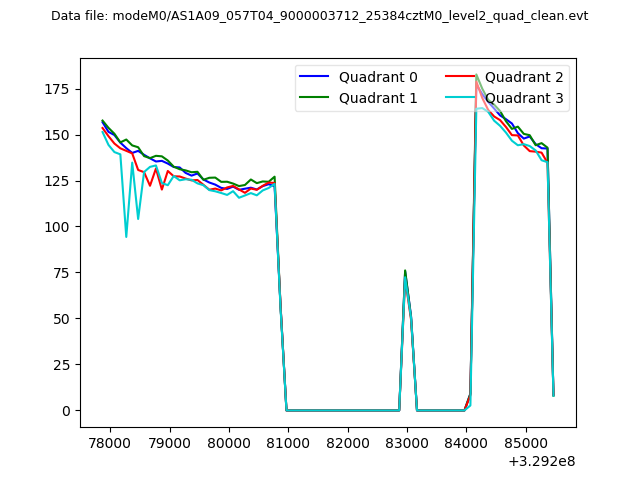 |
|
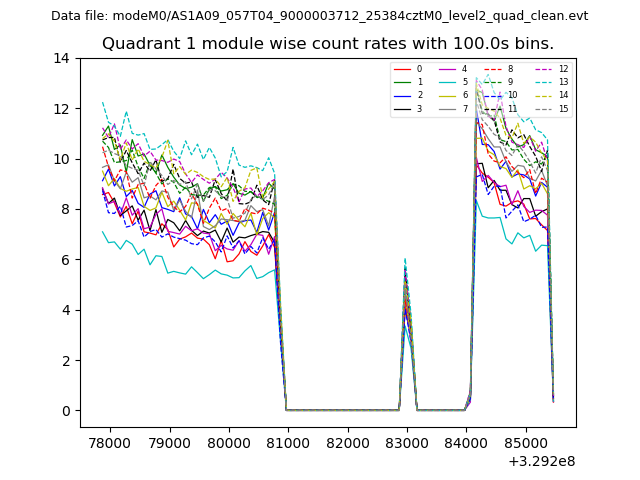
| Module-wise count rates for Quadrant A Data is divided into 100 sec bins |
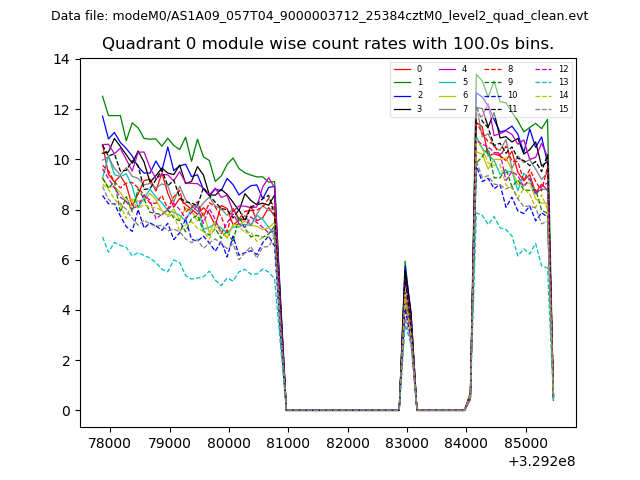 |
 |
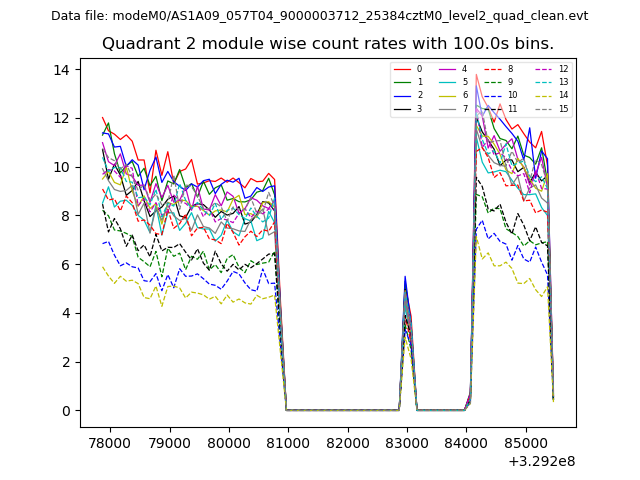
| Module-wise count rates for Quadrant B Data is divided into 100 sec bins |
 |
 |
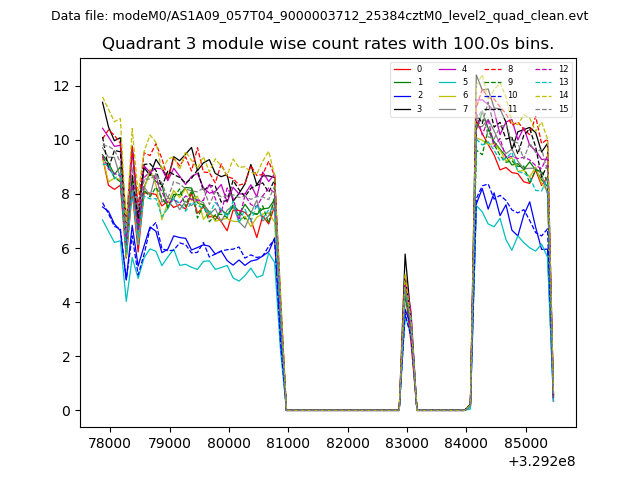
| Module-wise count rates for Quadrant C Data is divided into 100 sec bins |
 |
 |
| Module-wise count rates for Quadrant D Data is divided into 100 sec bins |
 |
 |
| Parameter | Plot |
|---|---|
| CZT HV Monitor | 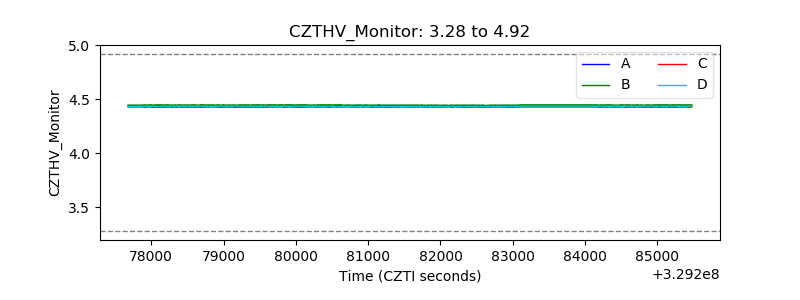 |
| D_VDD | 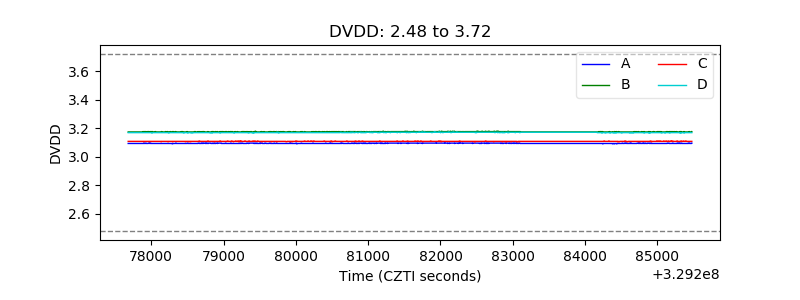 |
| Temperature 1 | 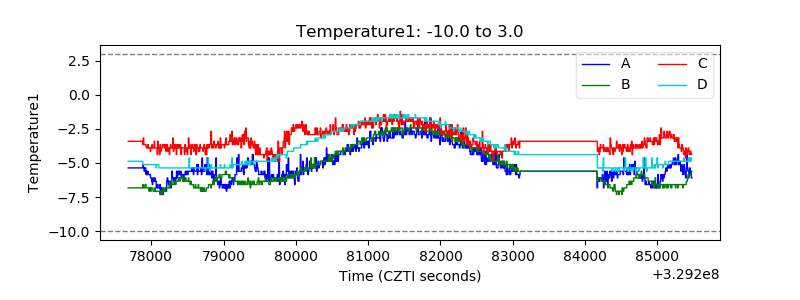 |
| Veto HV Monitor | 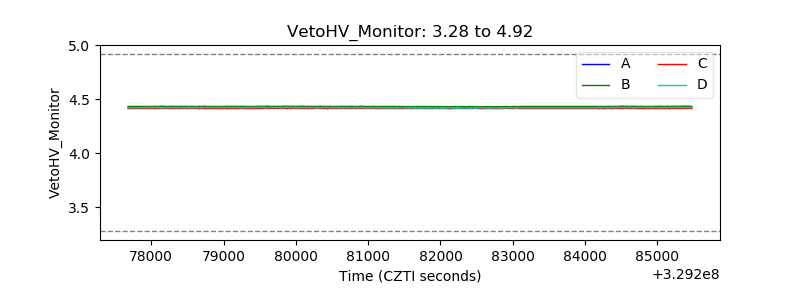 |
| Veto LLD | 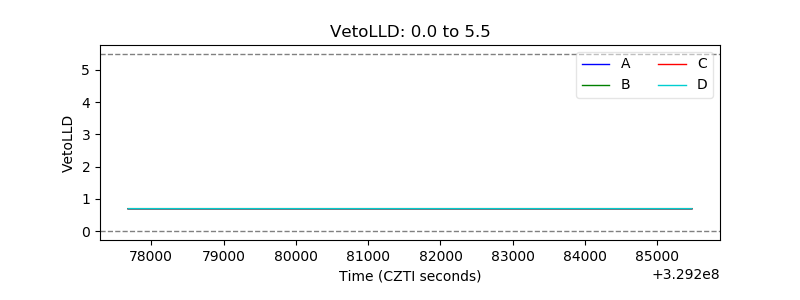 |
| Alpha Counter | 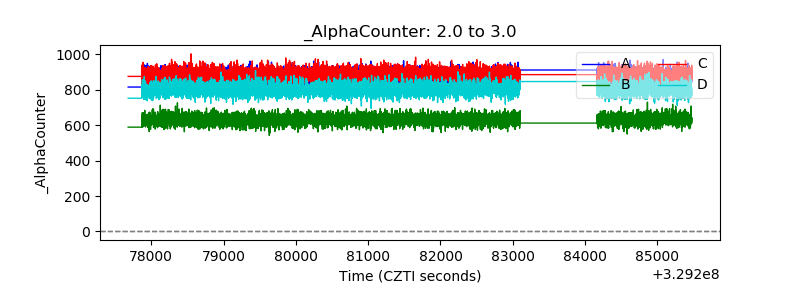 |
| _CPM_Rate | 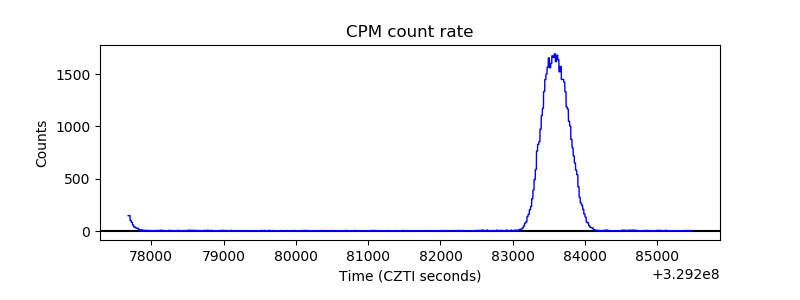 |
| CZT Counter | 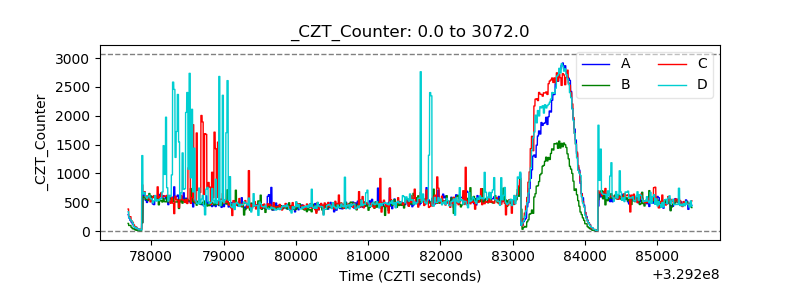 |
| +2.5 Volts monitor |  |
| +5 Volts monitor |  |
| _ROLL_ROT | 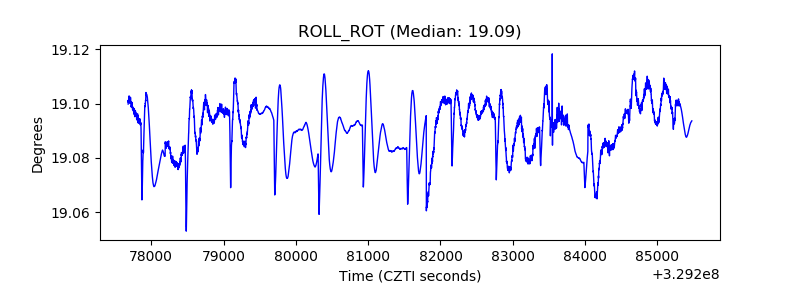 |
| _Roll_DEC | 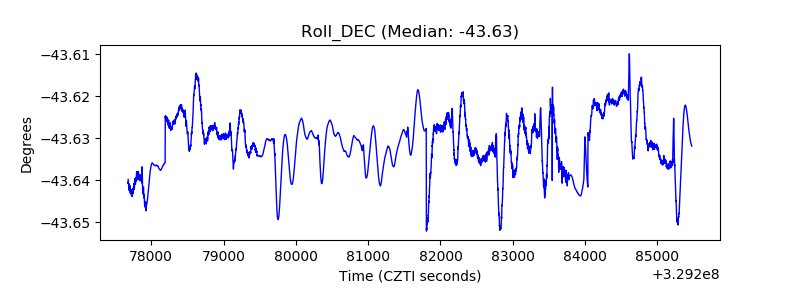 |
| _Roll_RA | 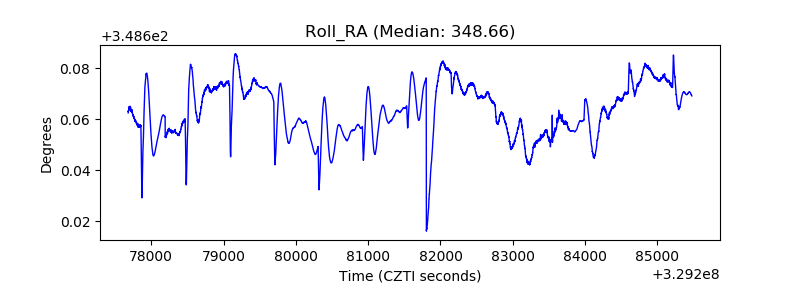 |
| Veto Counter | 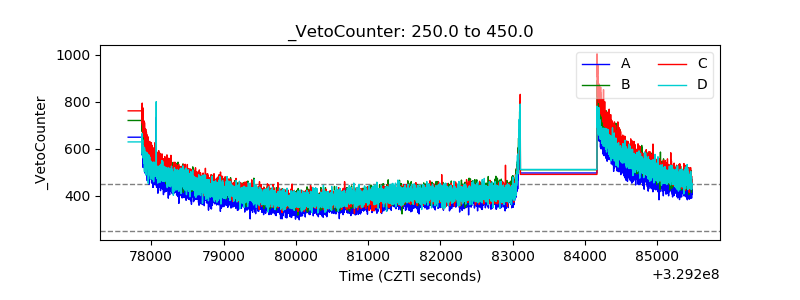 |