| Param | Original file | Final file |
|---|---|---|
| Filename | modeM0/AS1A09_057T04_9000003712_25387cztM0_level2.evt | modeM0/AS1A09_057T04_9000003712_25387cztM0_level2_quad_clean.evt |
| Size (bytes) | 862,583,040 | 155,410,560 |
| Size | 822.6 MB | 148.2 MB |
| Events in quadrant A | 6,565,491 | 1,010,672 |
| Events in quadrant B | 5,572,396 | 1,023,628 |
| Events in quadrant C | 5,550,318 | 980,835 |
| Events in quadrant D | 7,714,937 | 953,788 |
| Mode M9 | |||
|---|---|---|---|
| Quadrant | BADHDUFLAG | Total packets | Discarded packets |
| A | 0 | 25 | 0 |
| B | 0 | 25 | 0 |
| C | 0 | 25 | 0 |
| D | 0 | 25 | 0 |
| Mode M0 | |||
|---|---|---|---|
| Quadrant | BADHDUFLAG | Total packets | Discarded packets |
| A | 0 | 26479 | 0 |
| B | 0 | 23054 | 0 |
| C | 0 | 22984 | 0 |
| D | 0 | 30346 | 0 |
| Quadrant | Total seconds | Saturated seconds | Saturation percentage |
|---|---|---|---|
| A | 10662 | 73 | 0.684675% |
| B | 10663 | 79 | 0.740880% |
| C | 10663 | 133 | 1.247304% |
| D | 10663 | 493 | 4.623464% |
Noise dominated data is calculated using 1-second bins in cleaned event files. If a bin has >2000 counts, and if more than 50% of those come from <1% of pixels, then it is considered to be noise-dominated and hence unusable.
| Quadrant | # 1 sec bins | Bins with >0 counts | Bins with >2000 counts | High rate bins dominated by noise | Noise dominated (total time) | Noise dominated (detector-on time) | Marked lightcurve |
|---|---|---|---|---|---|---|---|
| A | 13117 | 10664 | 0 | 0 | 0.00% | 0.00% | 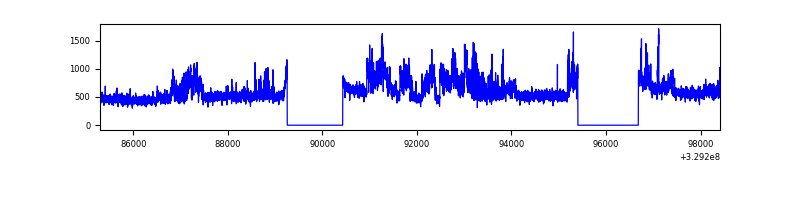 |
| B | 13118 | 10664 | 0 | 0 | 0.00% | 0.00% | 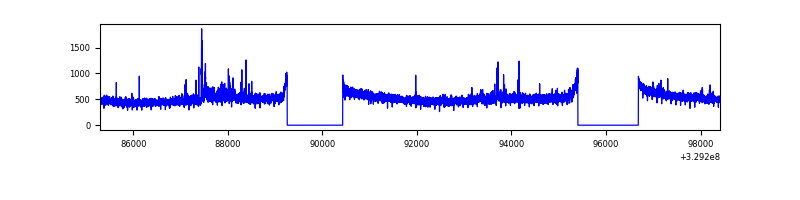 |
| C | 13118 | 10664 | 0 | 0 | 0.00% | 0.00% | 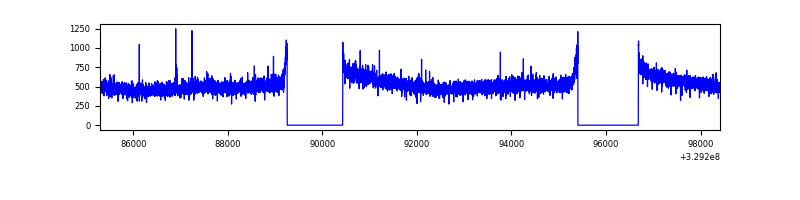 |
| D | 13118 | 10663 | 428 | 428 | 3.26% | 4.01% | 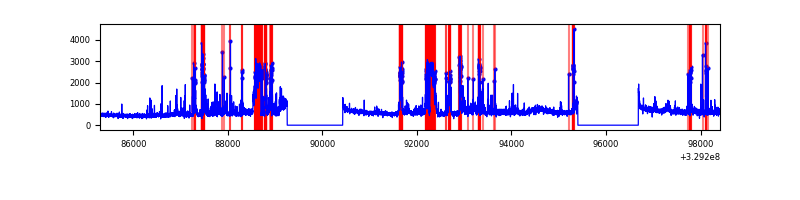 |
Top three noisy pixels from each quadrant. If the there are fewer than three noisy pixels in the level2.evt file, extra rows are filled as -1
| Pixel properties | Quadrant properties | ||||||
|---|---|---|---|---|---|---|---|
| Quadrant | DetID | PixID | Counts | Sigma | Mean | Median | Sigma |
| A | 6 | 16 | 1078995 | 3848.03 | 1412 | 1383 | 280.0 |
| A | 15 | 173 | 34865 | 119.56 | 1412 | 1383 | 280.0 |
| A | 13 | 254 | 14918 | 48.33 | 1412 | 1383 | 280.0 |
| B | 0 | 190 | 76930 | 295.81 | 1381 | 1350 | 255.5 |
| B | 0 | 229 | 35032 | 131.83 | 1381 | 1350 | 255.5 |
| B | 12 | 111 | 30927 | 115.76 | 1381 | 1350 | 255.5 |
| C | 14 | 238 | 216780 | 687.04 | 1352 | 1366 | 313.5 |
| C | 7 | 87 | 30282 | 92.22 | 1352 | 1366 | 313.5 |
| C | 3 | 233 | 22075 | 66.05 | 1352 | 1366 | 313.5 |
| D | 7 | 238 | 1179346 | 3655.63 | 1364 | 1333 | 322.2 |
| D | 1 | 52 | 905719 | 2806.51 | 1364 | 1333 | 322.2 |
| D | 8 | 195 | 289821 | 895.24 | 1364 | 1333 | 322.2 |
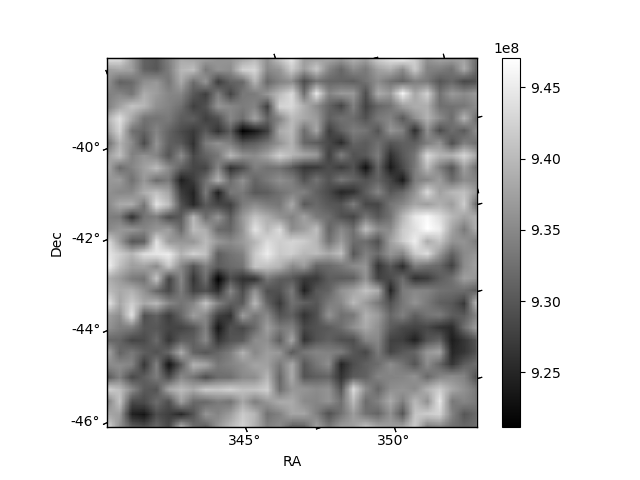
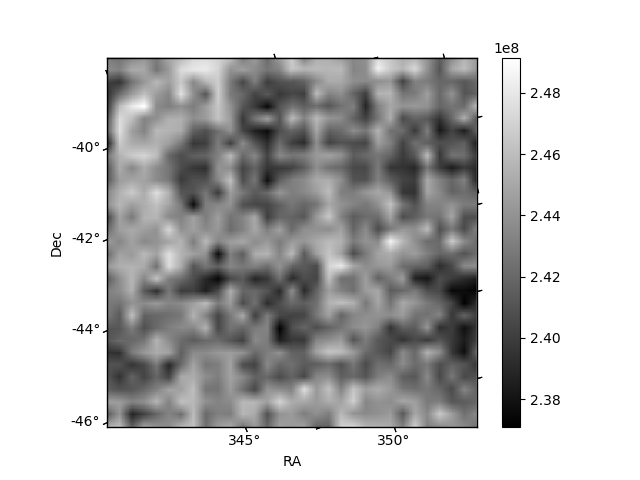
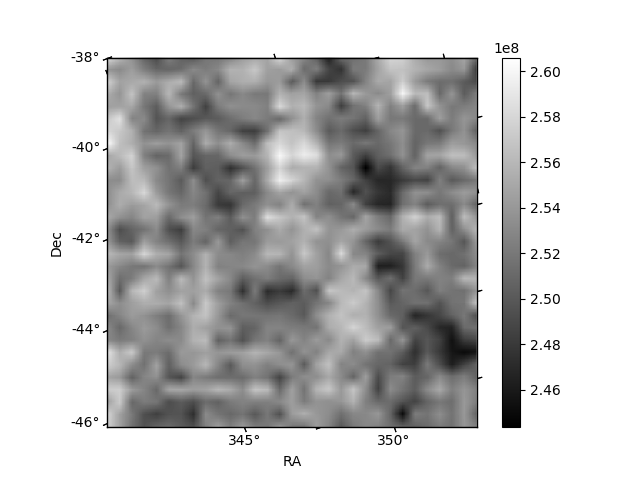
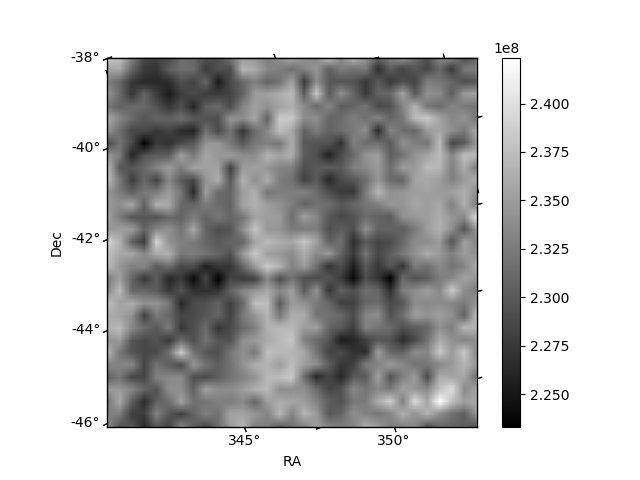
Histogram calculated using DETX and DETY for each event in the final _common_clean file
| Quadrant A | 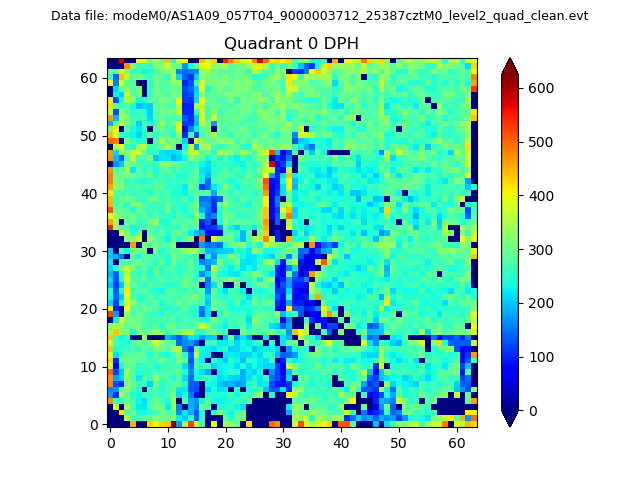 |
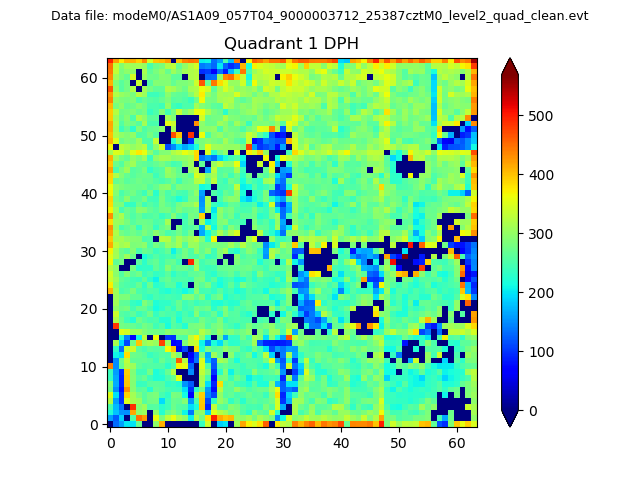 |
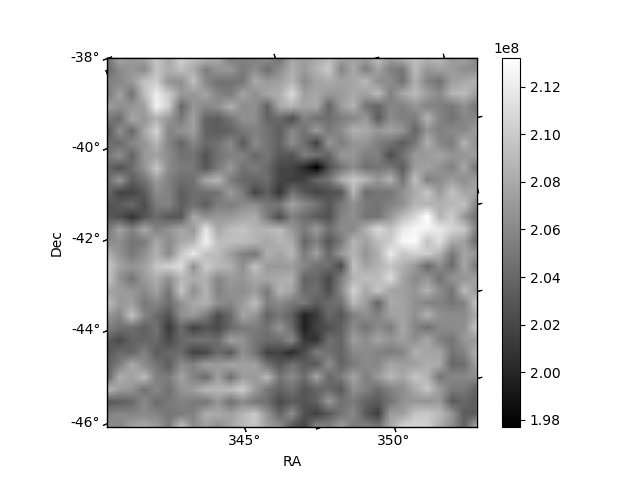
Quadrant B |
|---|---|---|---|
| Quadrant D | 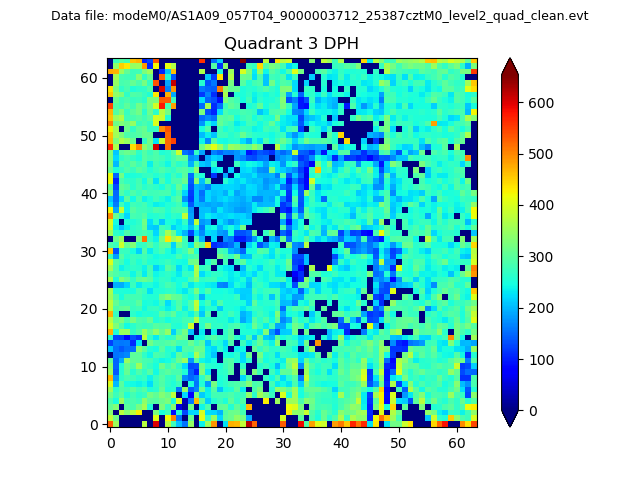 |
 |
Quadrant C |
| Plot type | Count rate plots | Images |
|---|---|---|
| Comparison with Poisson distribution Blue bars denote a histogram of data divided into 1 sec bins. Red curve is a Poisson curve with rate = median count rate of data. |
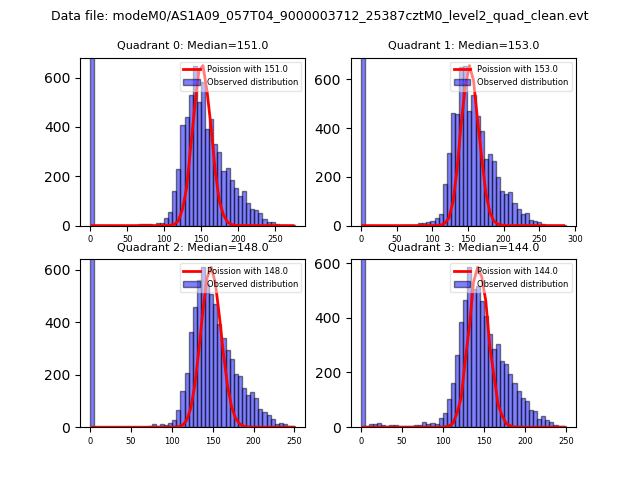 |
 |
| Quadrant-wise count rates Data is divided into 100 sec bins |
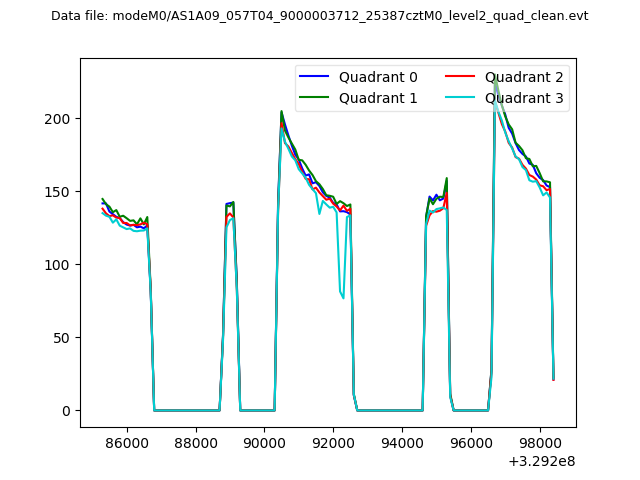 |
|
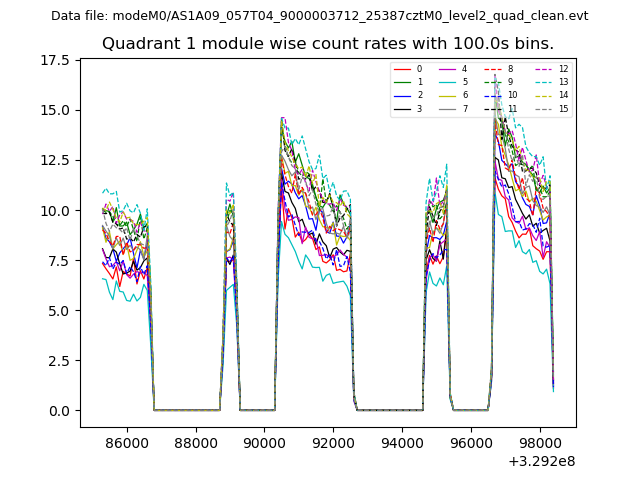
| Module-wise count rates for Quadrant A Data is divided into 100 sec bins |
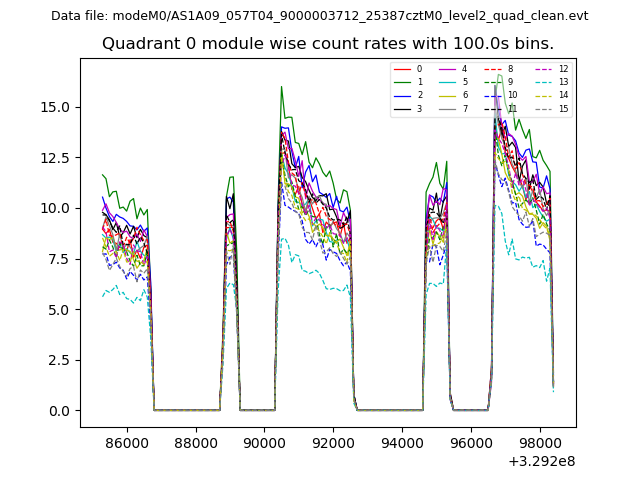 |
 |
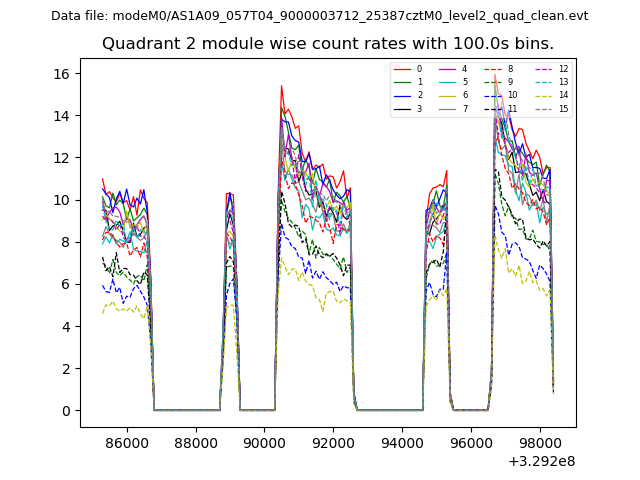
| Module-wise count rates for Quadrant B Data is divided into 100 sec bins |
 |
 |
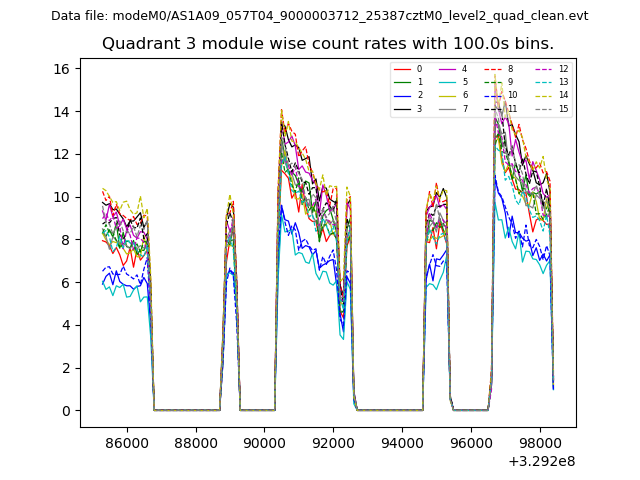
| Module-wise count rates for Quadrant C Data is divided into 100 sec bins |
 |
 |
| Module-wise count rates for Quadrant D Data is divided into 100 sec bins |
 |
 |
| Parameter | Plot |
|---|---|
| CZT HV Monitor | 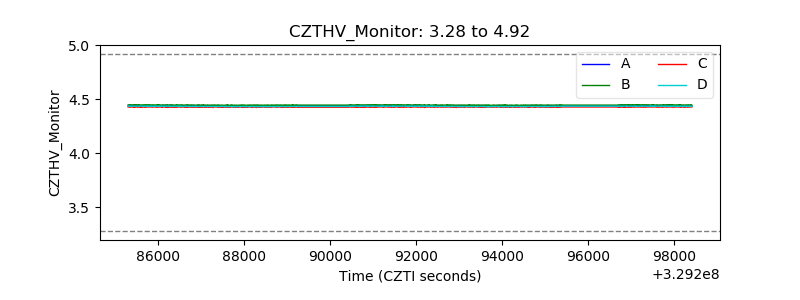 |
| D_VDD | 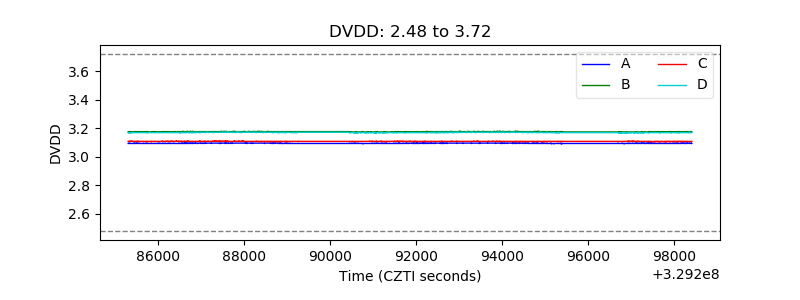 |
| Temperature 1 | 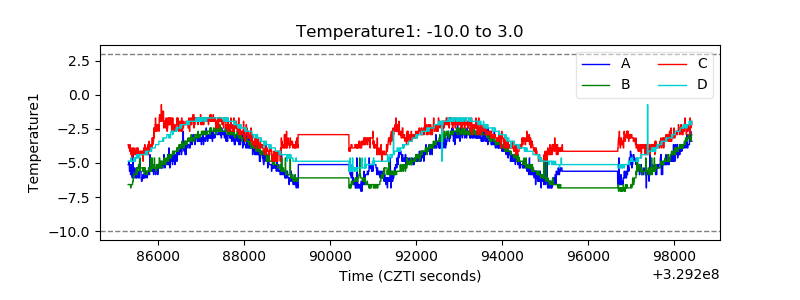 |
| Veto HV Monitor | 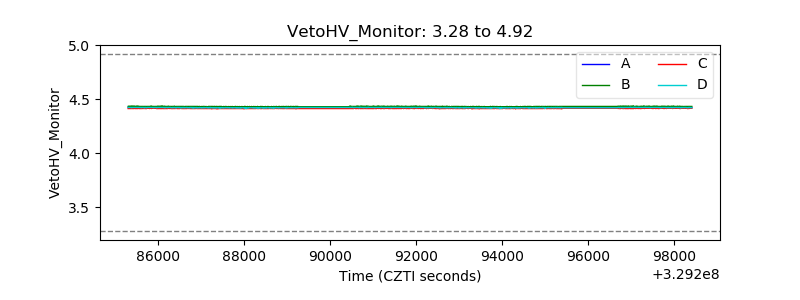 |
| Veto LLD | 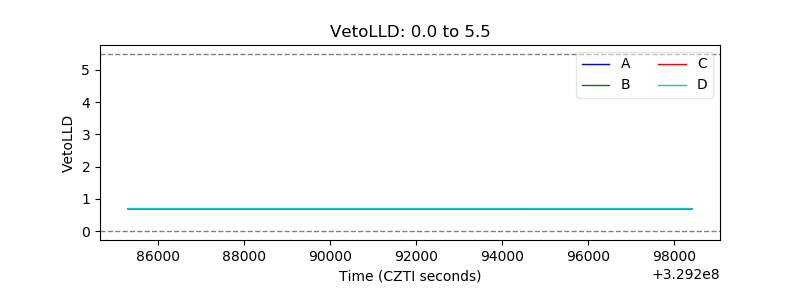 |
| Alpha Counter | 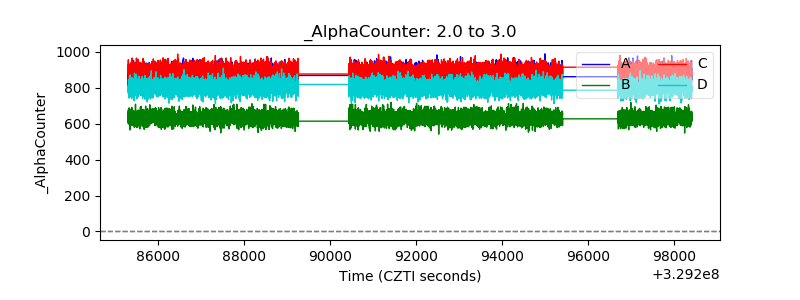 |
| _CPM_Rate | 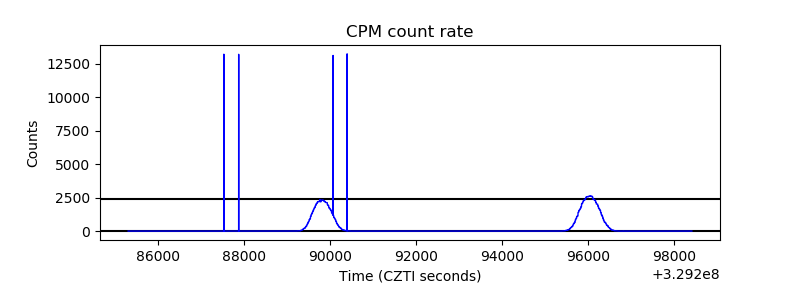 |
| CZT Counter | 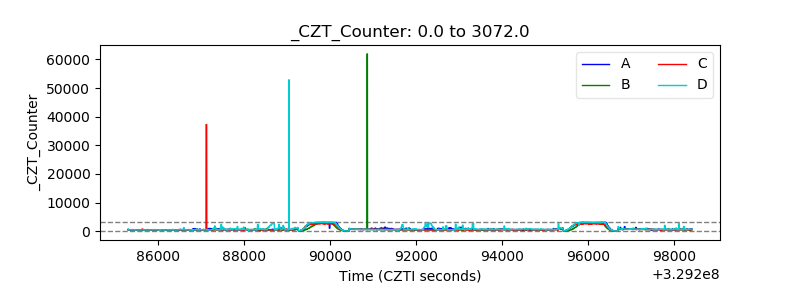 |
| +2.5 Volts monitor | 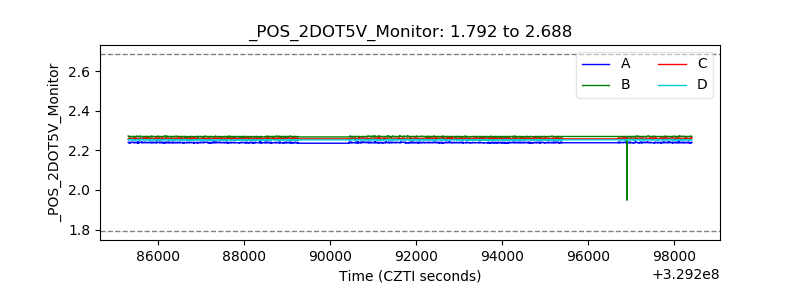 |
| +5 Volts monitor |  |
| _ROLL_ROT | 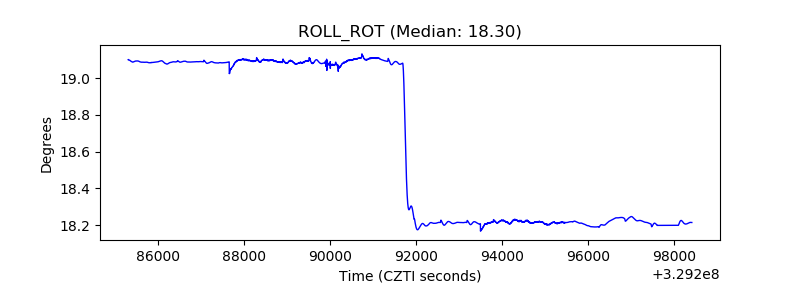 |
| _Roll_DEC | 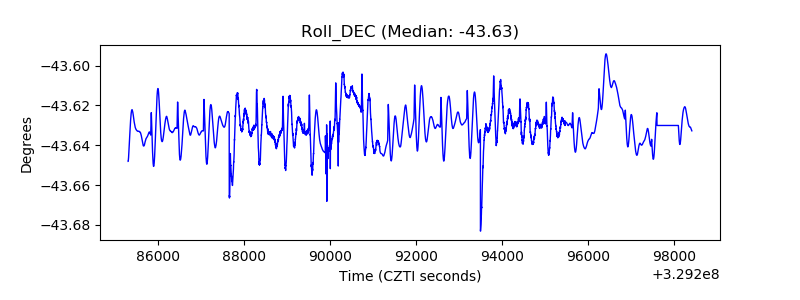 |
| _Roll_RA | 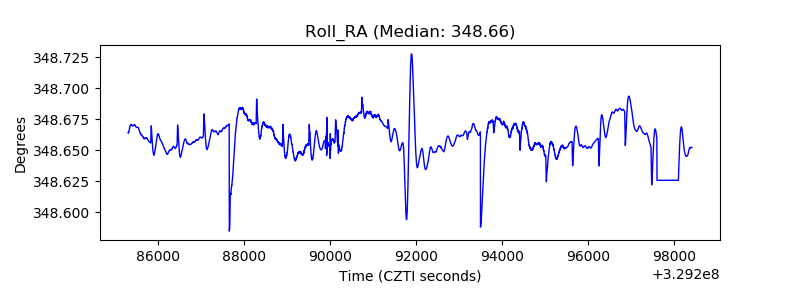 |
| Veto Counter | 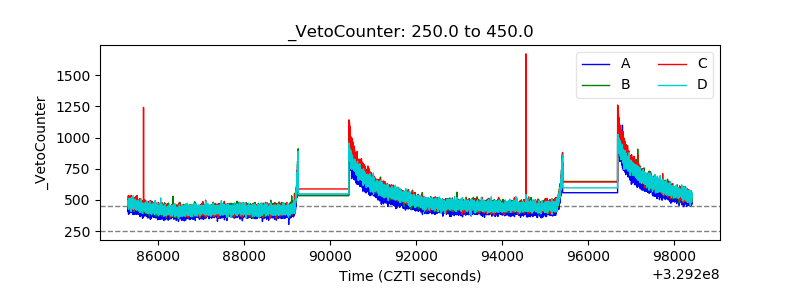 |