| Param | Original file | Final file |
|---|---|---|
| Filename | modeM0/AS1A09_057T04_9000003712_25388cztM0_level2.evt | modeM0/AS1A09_057T04_9000003712_25388cztM0_level2_quad_clean.evt |
| Size (bytes) | 604,028,160 | 74,998,080 |
| Size | 576.0 MB | 71.5 MB |
| Events in quadrant A | 3,694,780 | 533,659 |
| Events in quadrant B | 3,070,668 | 542,043 |
| Events in quadrant C | 3,013,331 | 509,205 |
| Events in quadrant D | 8,136,806 | 295,279 |
| Mode M9 | |||
|---|---|---|---|
| Quadrant | BADHDUFLAG | Total packets | Discarded packets |
| A | 0 | 13 | 0 |
| B | 0 | 13 | 0 |
| C | 0 | 13 | 0 |
| D | 0 | 13 | 0 |
| Mode M0 | |||
|---|---|---|---|
| Quadrant | BADHDUFLAG | Total packets | Discarded packets |
| A | 0 | 14707 | 0 |
| B | 0 | 12294 | 0 |
| C | 0 | 12177 | 0 |
| D | 0 | 28094 | 0 |
| Quadrant | Total seconds | Saturated seconds | Saturation percentage |
|---|---|---|---|
| A | 5575 | 67 | 1.201794% |
| B | 5576 | 68 | 1.219512% |
| C | 5576 | 87 | 1.560258% |
| D | 5576 | 1934 | 34.684362% |
Noise dominated data is calculated using 1-second bins in cleaned event files. If a bin has >2000 counts, and if more than 50% of those come from <1% of pixels, then it is considered to be noise-dominated and hence unusable.
| Quadrant | # 1 sec bins | Bins with >0 counts | Bins with >2000 counts | High rate bins dominated by noise | Noise dominated (total time) | Noise dominated (detector-on time) | Marked lightcurve |
|---|---|---|---|---|---|---|---|
| A | 6895 | 5575 | 0 | 0 | 0.00% | 0.00% | 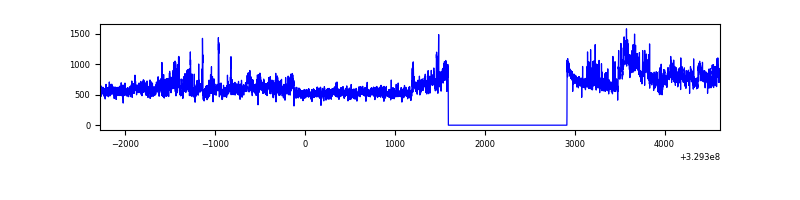 |
| B | 6896 | 5576 | 0 | 0 | 0.00% | 0.00% | 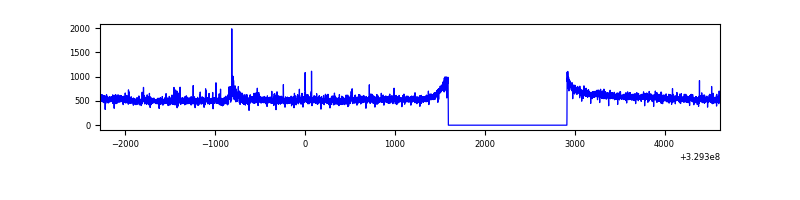 |
| C | 6896 | 5576 | 0 | 0 | 0.00% | 0.00% | 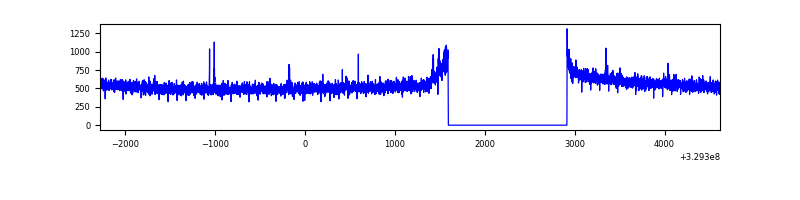 |
| D | 6896 | 5576 | 1871 | 1871 | 27.13% | 33.55% | 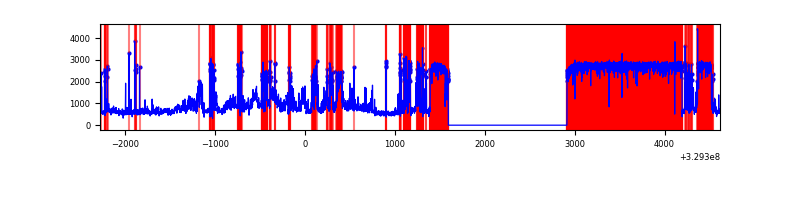 |
Top three noisy pixels from each quadrant. If the there are fewer than three noisy pixels in the level2.evt file, extra rows are filled as -1
| Pixel properties | Quadrant properties | ||||||
|---|---|---|---|---|---|---|---|
| Quadrant | DetID | PixID | Counts | Sigma | Mean | Median | Sigma |
| A | 6 | 16 | 635866 | 4101.32 | 784 | 772 | 154.9 |
| A | 15 | 173 | 35470 | 224.07 | 784 | 772 | 154.9 |
| A | 13 | 254 | 7481 | 43.33 | 784 | 772 | 154.9 |
| B | 0 | 190 | 30823 | 212.43 | 764 | 748 | 141.6 |
| B | 3 | 112 | 17017 | 114.91 | 764 | 748 | 141.6 |
| B | 12 | 111 | 16536 | 111.51 | 764 | 748 | 141.6 |
| C | 14 | 238 | 118925 | 696.28 | 736 | 745 | 169.7 |
| C | 7 | 87 | 16718 | 94.11 | 736 | 745 | 169.7 |
| C | 3 | 233 | 6582 | 34.39 | 736 | 745 | 169.7 |
| D | 1 | 52 | 5571082 | 40882.15 | 568 | 553 | 136.3 |
| D | 8 | 195 | 187470 | 1371.79 | 568 | 553 | 136.3 |
| D | 7 | 238 | 182315 | 1333.95 | 568 | 553 | 136.3 |
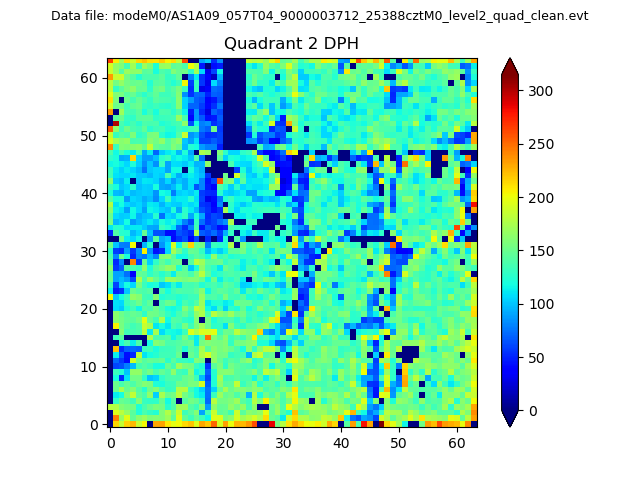
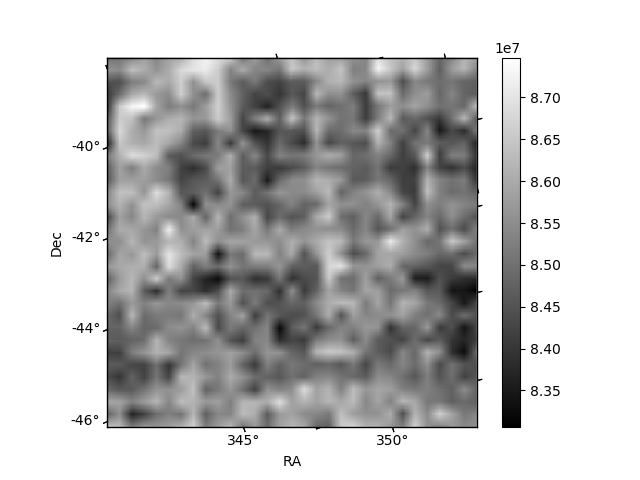
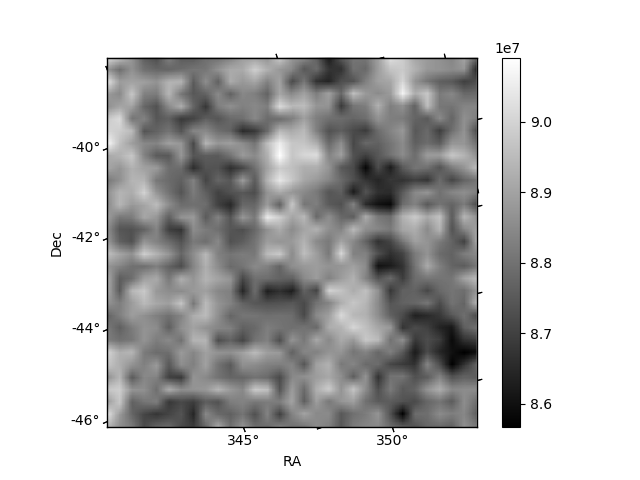
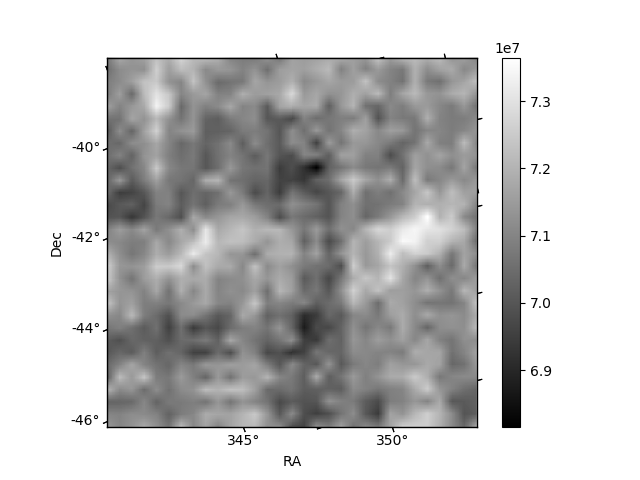
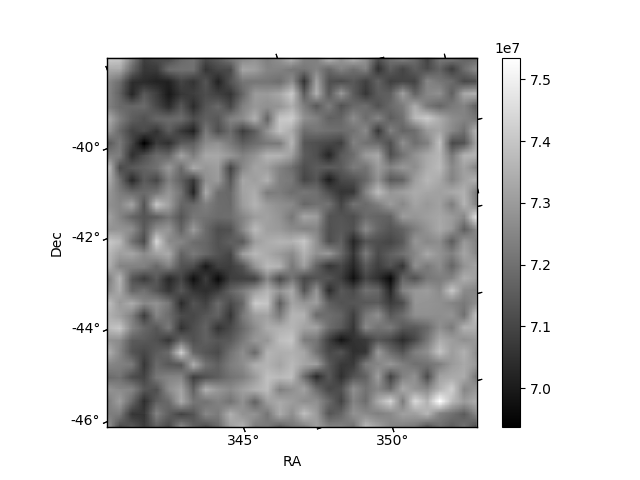
Histogram calculated using DETX and DETY for each event in the final _common_clean file
| Quadrant A | 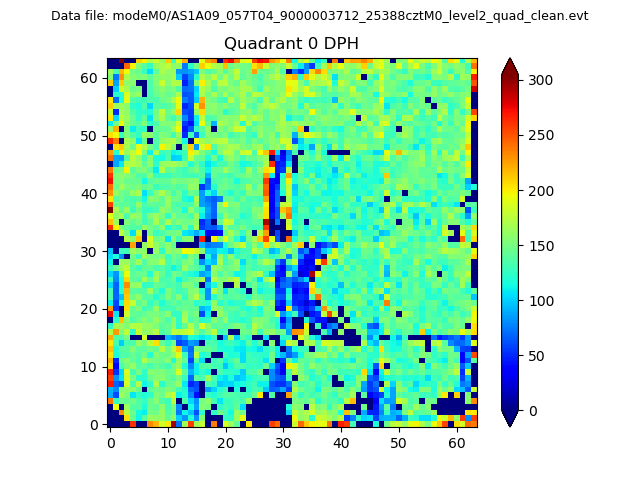 |
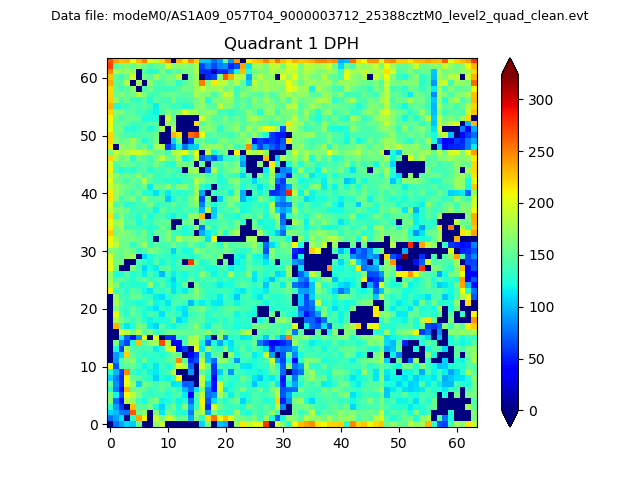 |
Quadrant B |
|---|---|---|---|
| Quadrant D | 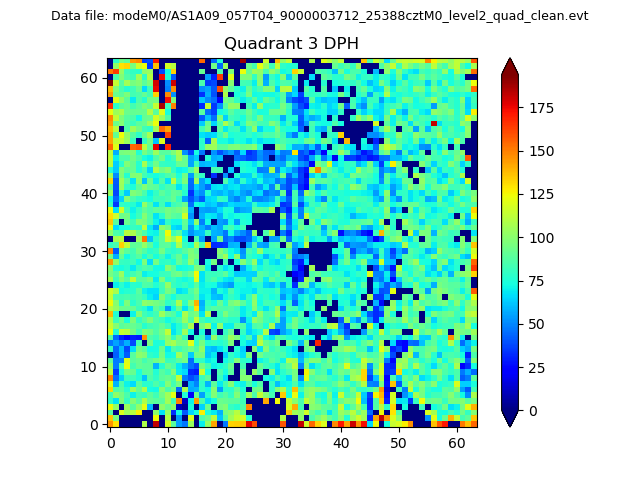 |
 |
Quadrant C |
| Plot type | Count rate plots | Images |
|---|---|---|
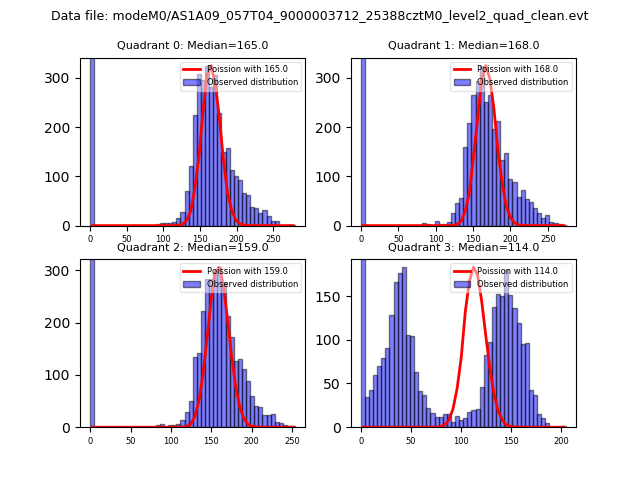
| Comparison with Poisson distribution Blue bars denote a histogram of data divided into 1 sec bins. Red curve is a Poisson curve with rate = median count rate of data. |
 |
 |
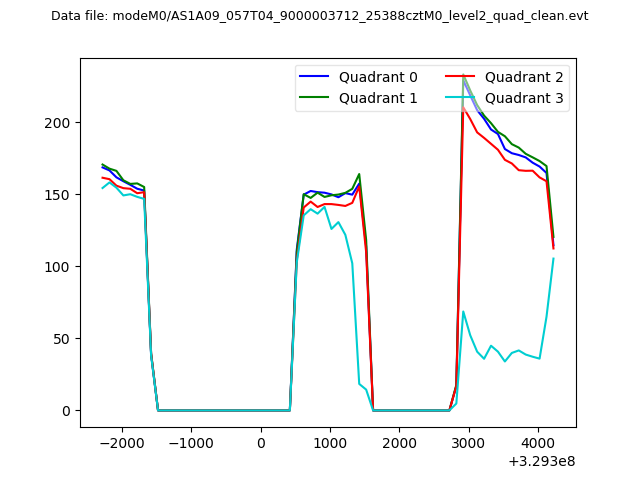
| Quadrant-wise count rates Data is divided into 100 sec bins |
 |
|
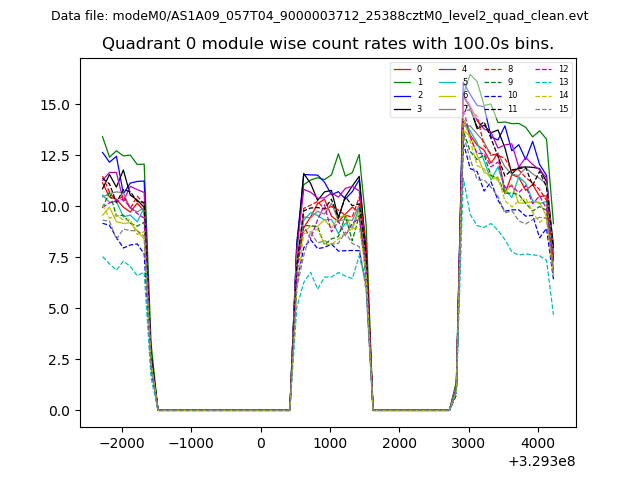
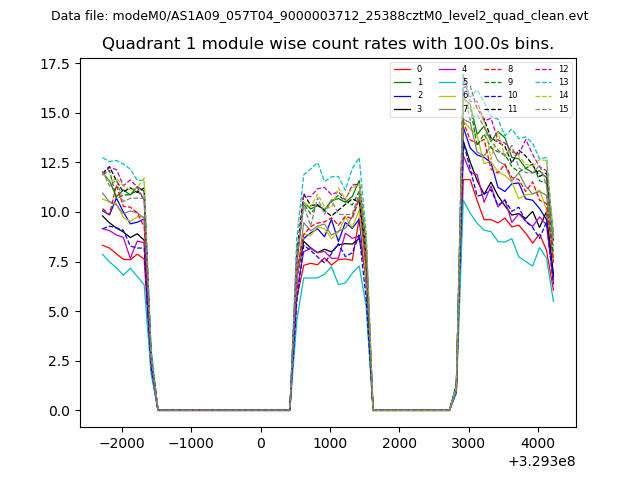
| Module-wise count rates for Quadrant A Data is divided into 100 sec bins |
 |
 |
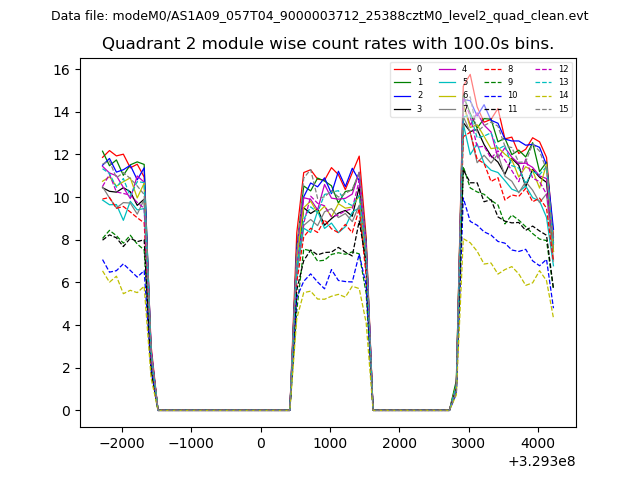
| Module-wise count rates for Quadrant B Data is divided into 100 sec bins |
 |
 |
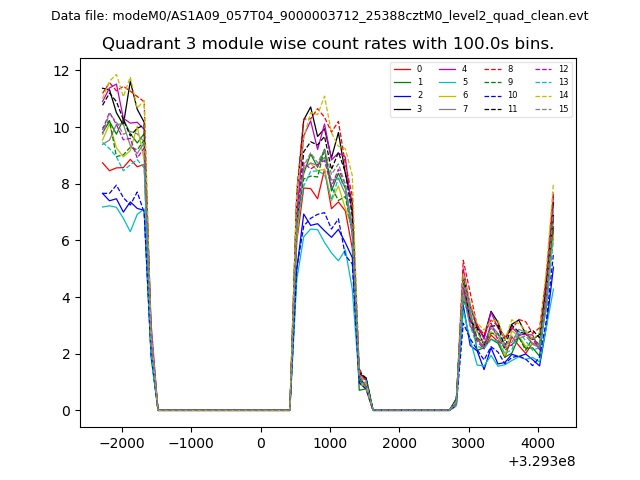
| Module-wise count rates for Quadrant C Data is divided into 100 sec bins |
 |
 |
| Module-wise count rates for Quadrant D Data is divided into 100 sec bins |
 |
 |
| Parameter | Plot |
|---|---|
| CZT HV Monitor | 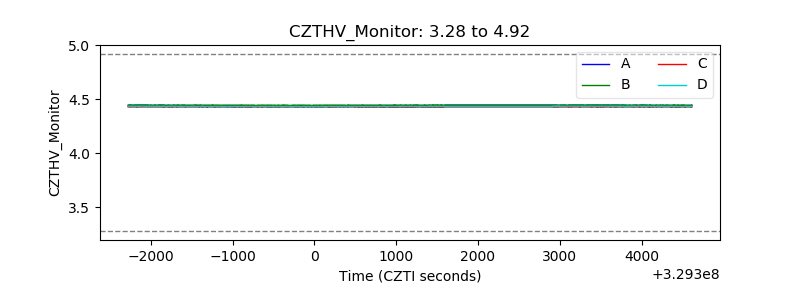 |
| D_VDD | 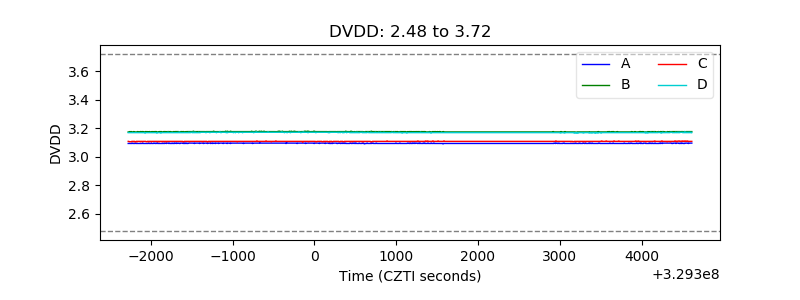 |
| Temperature 1 | 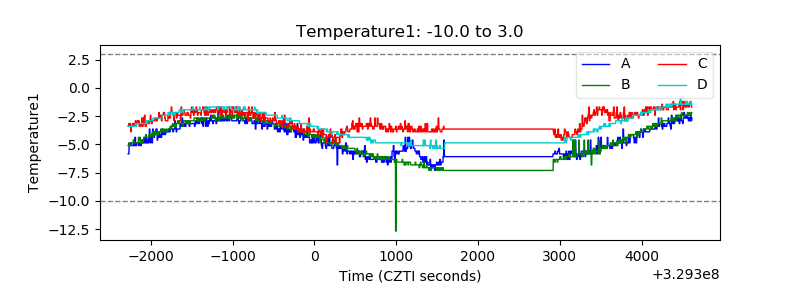 |
| Veto HV Monitor |  |
| Veto LLD | 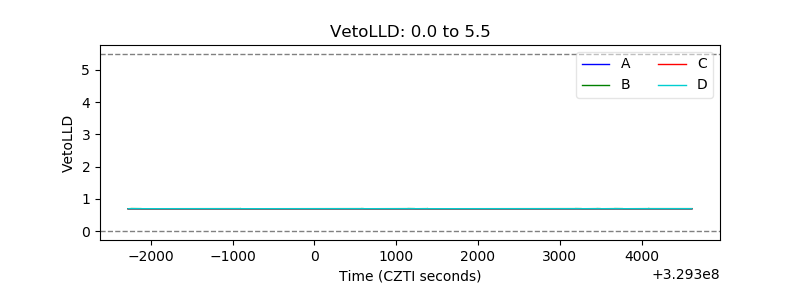 |
| Alpha Counter | 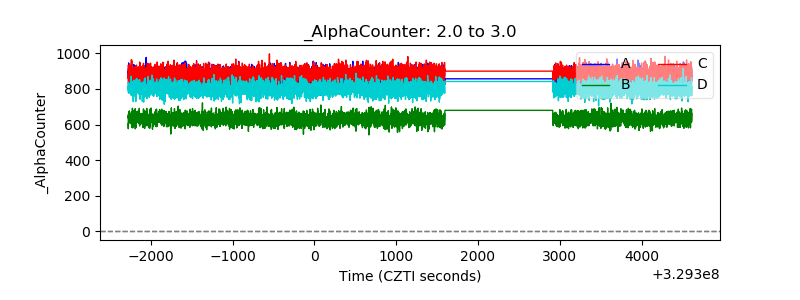 |
| _CPM_Rate | 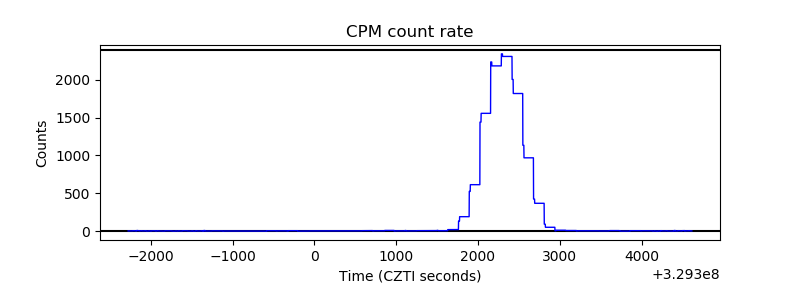 |
| CZT Counter | 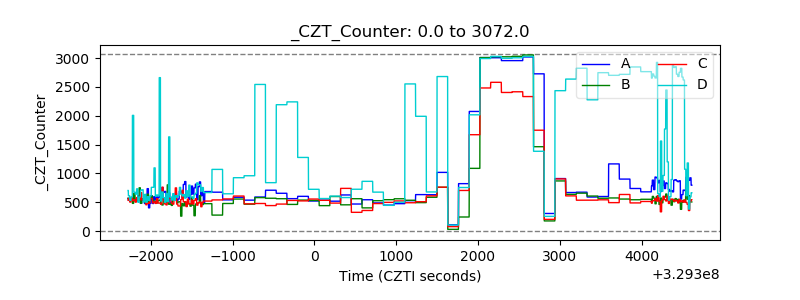 |
| +2.5 Volts monitor |  |
| +5 Volts monitor |  |
| _ROLL_ROT | 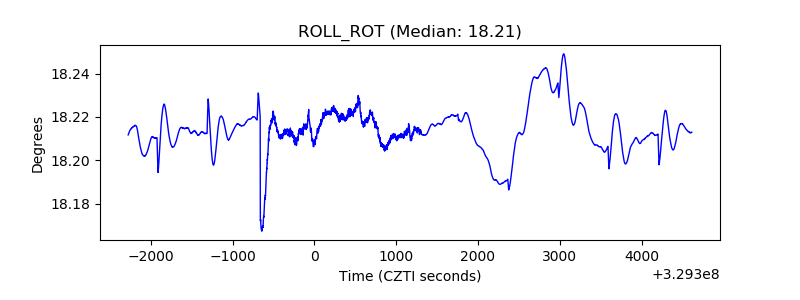 |
| _Roll_DEC | 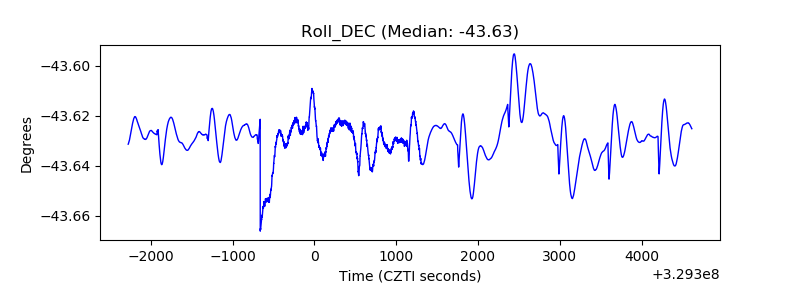 |
| _Roll_RA | 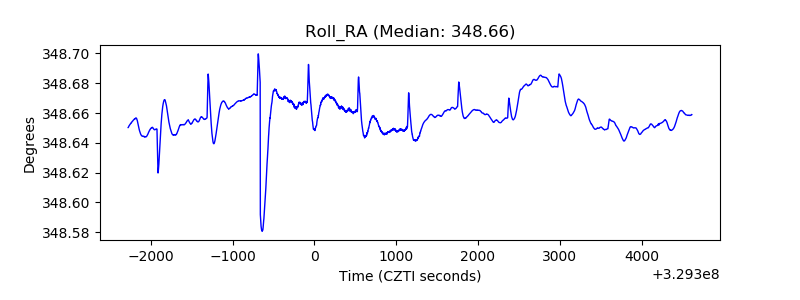 |
| Veto Counter | 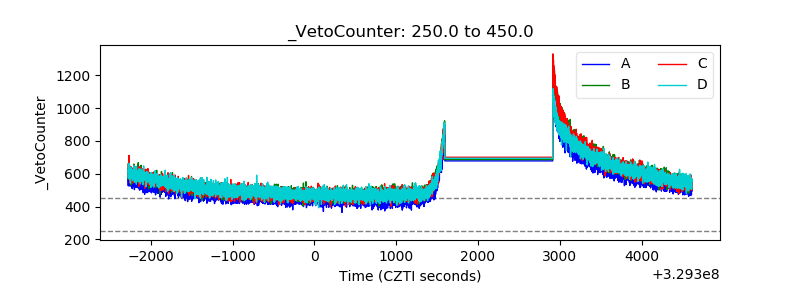 |