| Param | Original file | Final file |
|---|---|---|
| Filename | modeM0/AS1A09_057T04_9000003712_25389cztM0_level2.evt | modeM0/AS1A09_057T04_9000003712_25389cztM0_level2_quad_clean.evt |
| Size (bytes) | 726,696,000 | 75,337,920 |
| Size | 693.0 MB | 71.8 MB |
| Events in quadrant A | 4,339,920 | 520,696 |
| Events in quadrant B | 3,205,628 | 529,215 |
| Events in quadrant C | 3,129,600 | 493,025 |
| Events in quadrant D | 10,942,113 | 333,418 |
| Mode M9 | |||
|---|---|---|---|
| Quadrant | BADHDUFLAG | Total packets | Discarded packets |
| A | 0 | 13 | 0 |
| B | 0 | 13 | 0 |
| C | 0 | 13 | 0 |
| D | 0 | 13 | 0 |
| Mode M0 | |||
|---|---|---|---|
| Quadrant | BADHDUFLAG | Total packets | Discarded packets |
| A | 0 | 17249 | 0 |
| B | 0 | 12790 | 0 |
| C | 0 | 12585 | 0 |
| D | 0 | 36553 | 0 |
| Quadrant | Total seconds | Saturated seconds | Saturation percentage |
|---|---|---|---|
| A | 5778 | 157 | 2.717203% |
| B | 5779 | 118 | 2.041876% |
| C | 5779 | 134 | 2.318740% |
| D | 5779 | 3503 | 60.616024% |
Noise dominated data is calculated using 1-second bins in cleaned event files. If a bin has >2000 counts, and if more than 50% of those come from <1% of pixels, then it is considered to be noise-dominated and hence unusable.
| Quadrant | # 1 sec bins | Bins with >0 counts | Bins with >2000 counts | High rate bins dominated by noise | Noise dominated (total time) | Noise dominated (detector-on time) | Marked lightcurve |
|---|---|---|---|---|---|---|---|
| A | 7093 | 5778 | 27 | 27 | 0.38% | 0.47% | 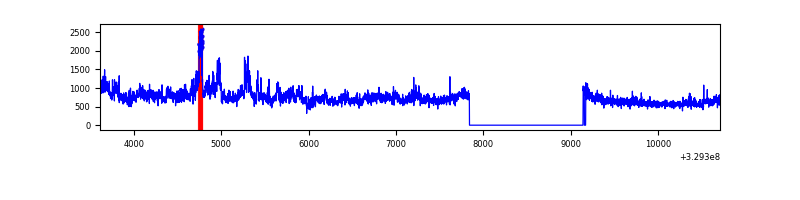 |
| B | 7094 | 5780 | 0 | 0 | 0.00% | 0.00% | 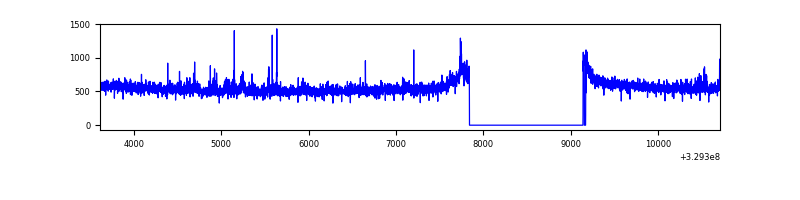 |
| C | 7094 | 5780 | 0 | 0 | 0.00% | 0.00% | 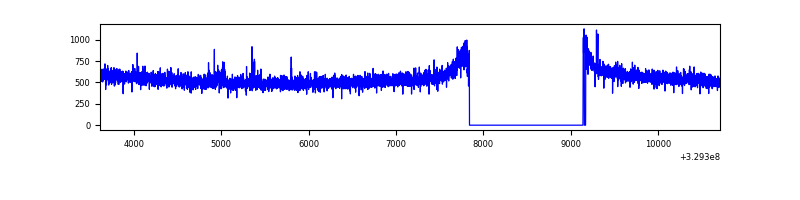 |
| D | 7093 | 5778 | 3213 | 3213 | 45.30% | 55.61% | 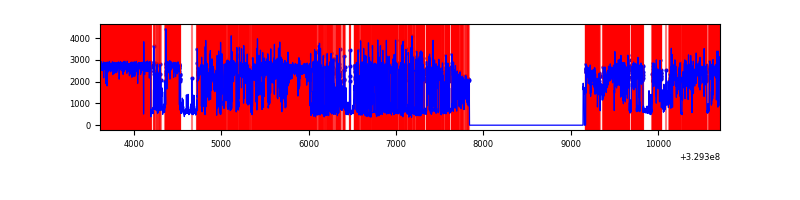 |
Top three noisy pixels from each quadrant. If the there are fewer than three noisy pixels in the level2.evt file, extra rows are filled as -1
| Pixel properties | Quadrant properties | ||||||
|---|---|---|---|---|---|---|---|
| Quadrant | DetID | PixID | Counts | Sigma | Mean | Median | Sigma |
| A | 6 | 16 | 1163346 | 7216.84 | 818 | 804 | 161.1 |
| A | 15 | 173 | 20039 | 119.41 | 818 | 804 | 161.1 |
| A | 13 | 254 | 7668 | 42.61 | 818 | 804 | 161.1 |
| B | 0 | 190 | 28468 | 185.62 | 799 | 782 | 149.2 |
| B | 4 | 80 | 18310 | 117.52 | 799 | 782 | 149.2 |
| B | 12 | 111 | 17206 | 110.11 | 799 | 782 | 149.2 |
| C | 14 | 238 | 124927 | 707.17 | 765 | 771 | 175.6 |
| C | 5 | 112 | 11561 | 61.46 | 765 | 771 | 175.6 |
| C | 3 | 233 | 6283 | 31.4 | 765 | 771 | 175.6 |
| D | 1 | 52 | 7283211 | 52824.6 | 574 | 560 | 137.9 |
| D | 7 | 238 | 1022187 | 7410.36 | 574 | 560 | 137.9 |
| D | 8 | 195 | 283269 | 2050.63 | 574 | 560 | 137.9 |
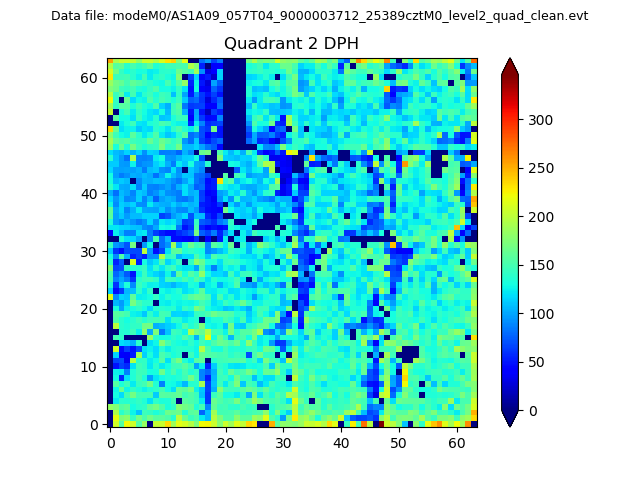
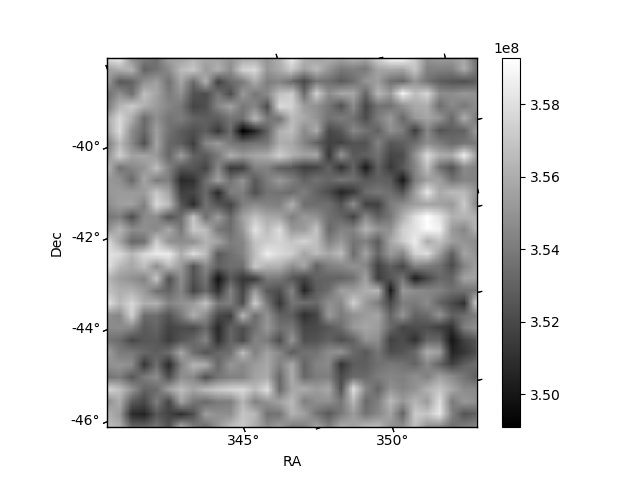
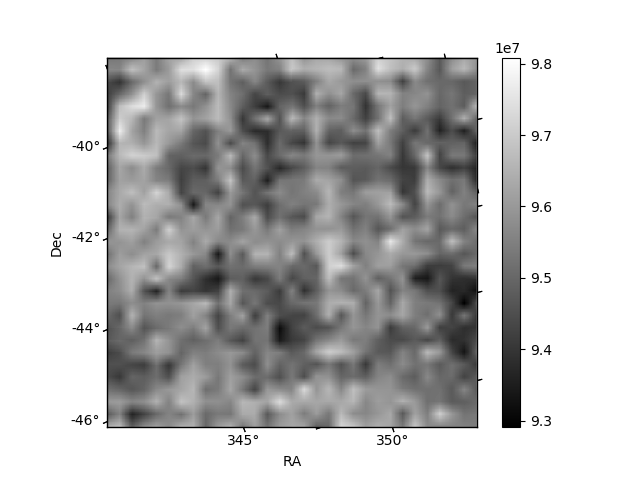
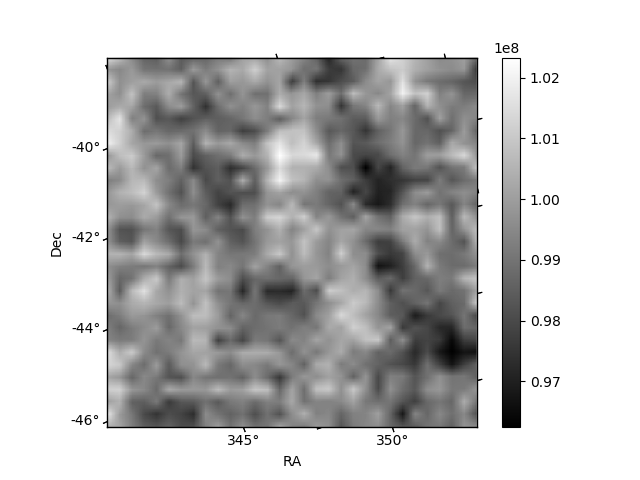
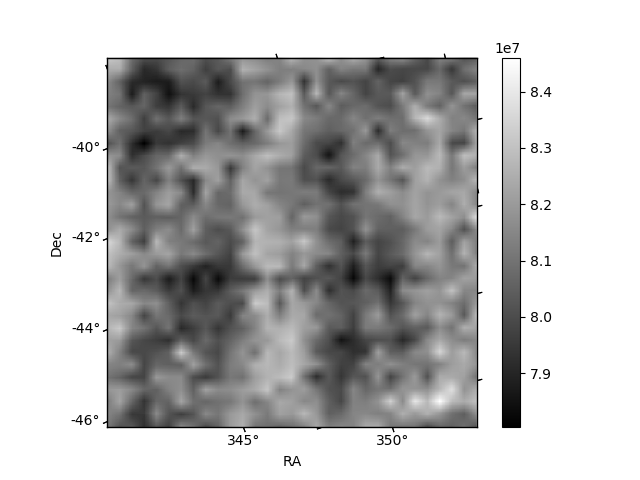
Histogram calculated using DETX and DETY for each event in the final _common_clean file
| Quadrant A | 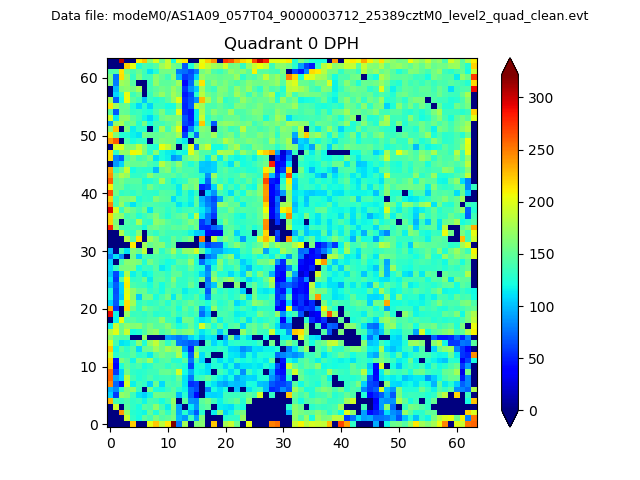 |
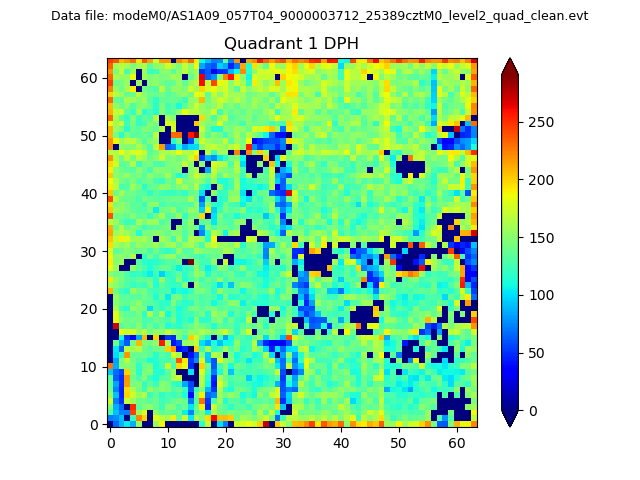 |
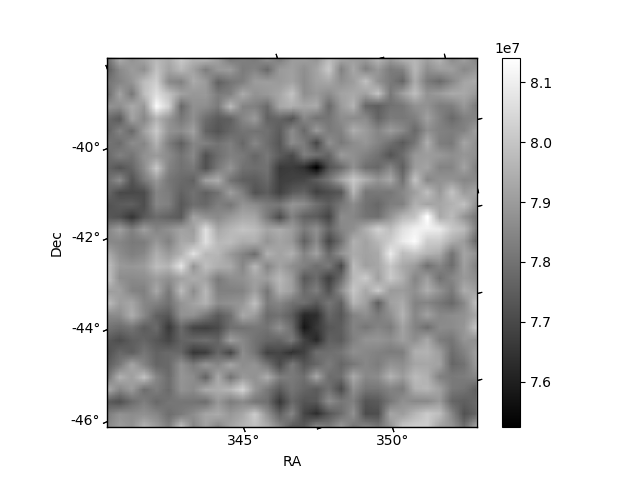
Quadrant B |
|---|---|---|---|
| Quadrant D | 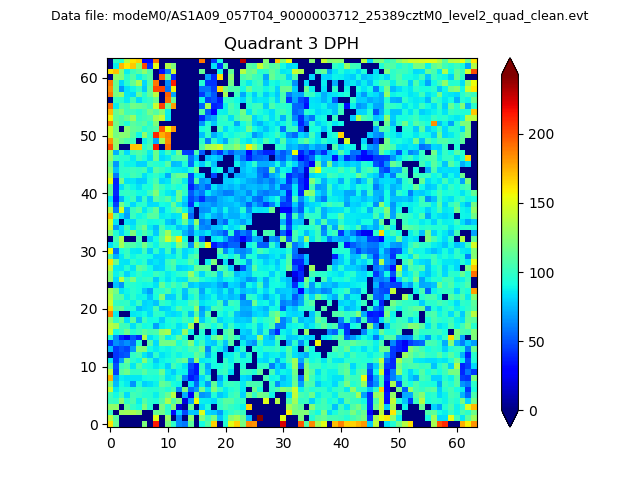 |
 |
Quadrant C |
| Plot type | Count rate plots | Images |
|---|---|---|
| Comparison with Poisson distribution Blue bars denote a histogram of data divided into 1 sec bins. Red curve is a Poisson curve with rate = median count rate of data. |
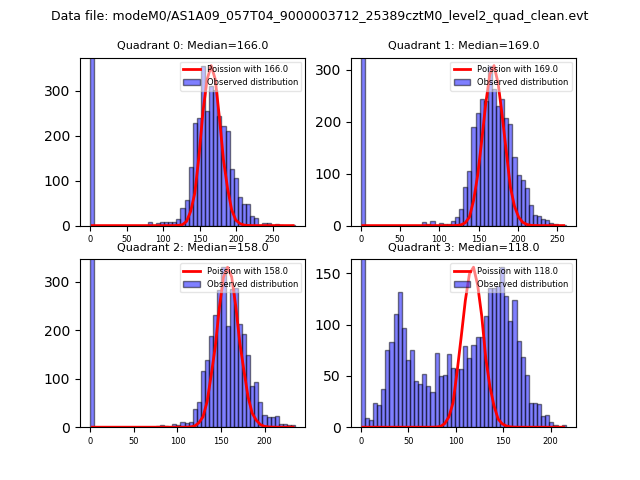 |
 |
| Quadrant-wise count rates Data is divided into 100 sec bins |
 |
|
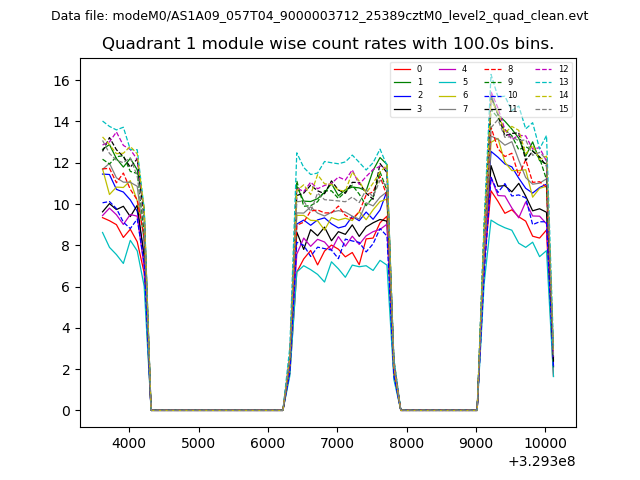
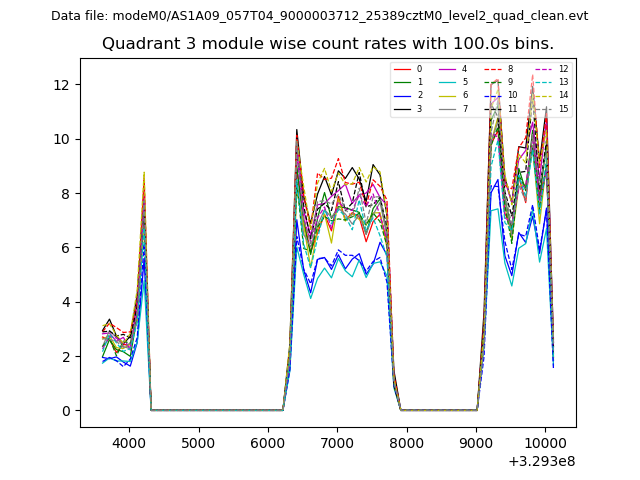
| Module-wise count rates for Quadrant A Data is divided into 100 sec bins |
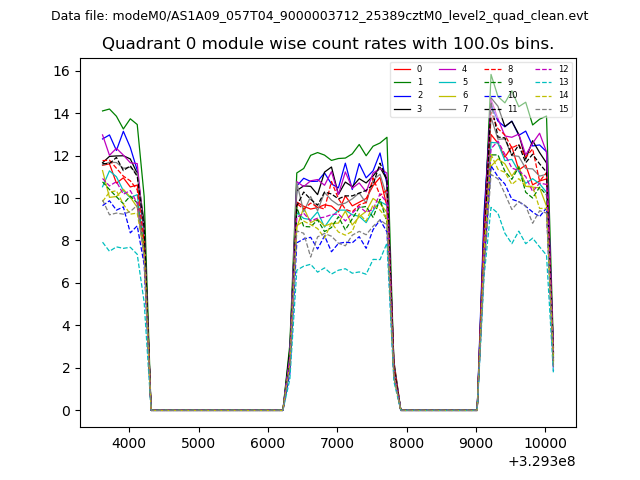 |
 |
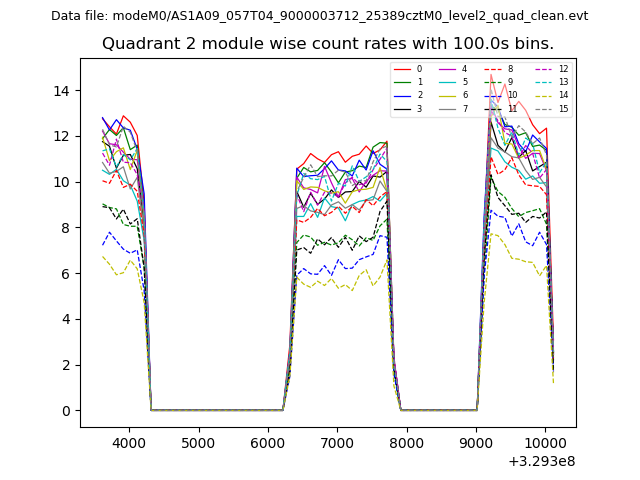
| Module-wise count rates for Quadrant B Data is divided into 100 sec bins |
 |
 |
| Module-wise count rates for Quadrant C Data is divided into 100 sec bins |
 |
 |
| Module-wise count rates for Quadrant D Data is divided into 100 sec bins |
 |
 |
| Parameter | Plot |
|---|---|
| CZT HV Monitor | 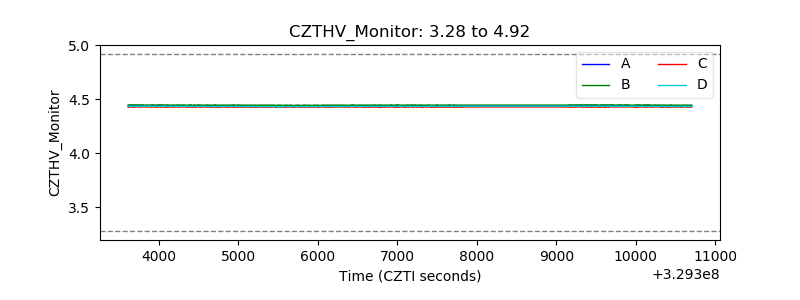 |
| D_VDD | 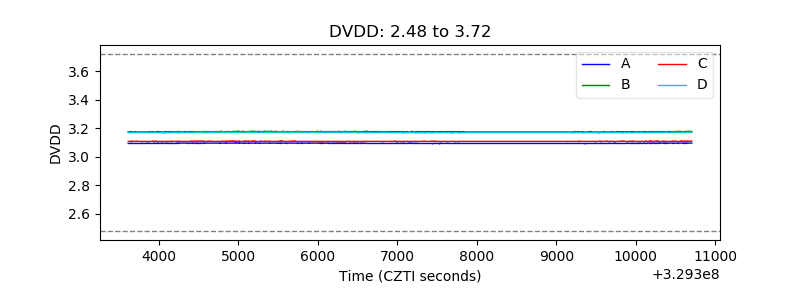 |
| Temperature 1 | 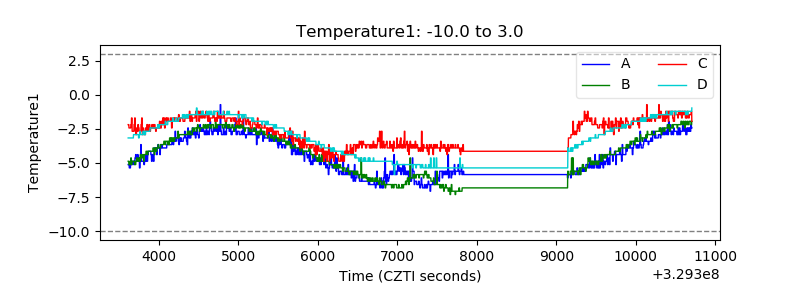 |
| Veto HV Monitor |  |
| Veto LLD | 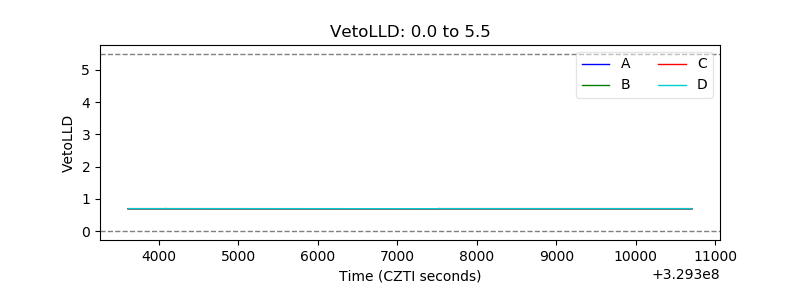 |
| Alpha Counter | 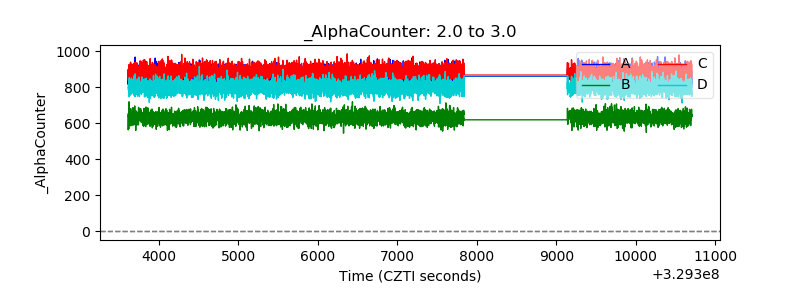 |
| _CPM_Rate | 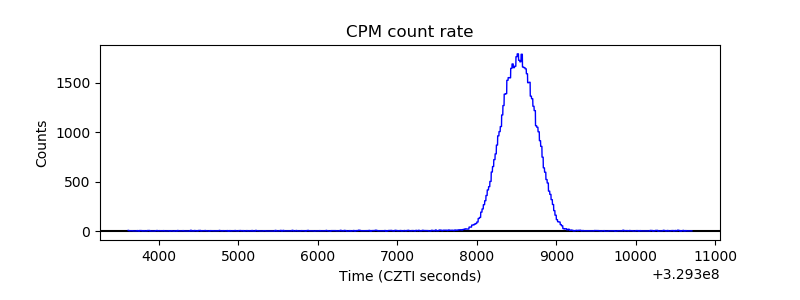 |
| CZT Counter | 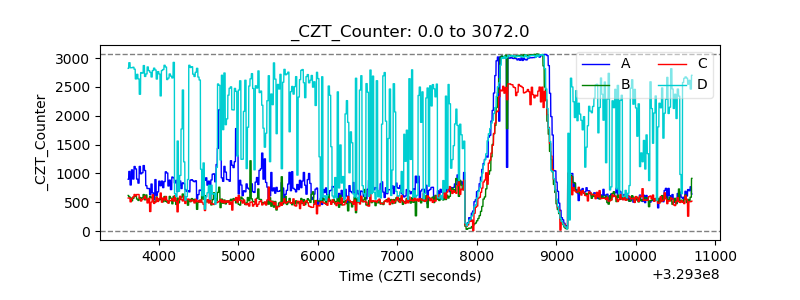 |
| +2.5 Volts monitor | 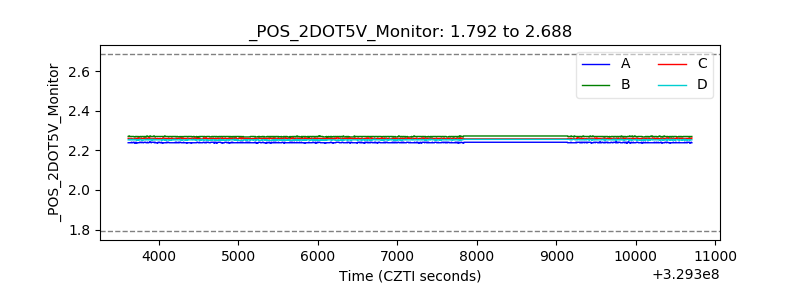 |
| +5 Volts monitor |  |
| _ROLL_ROT | 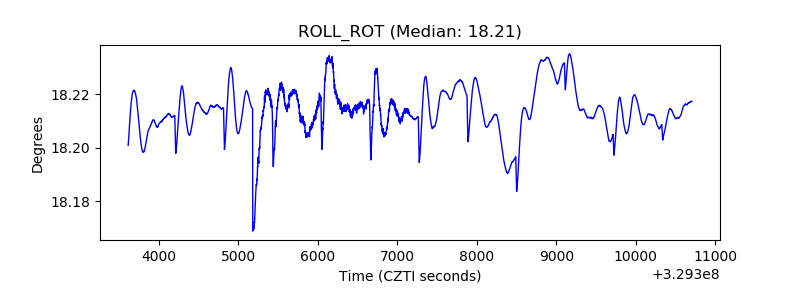 |
| _Roll_DEC | 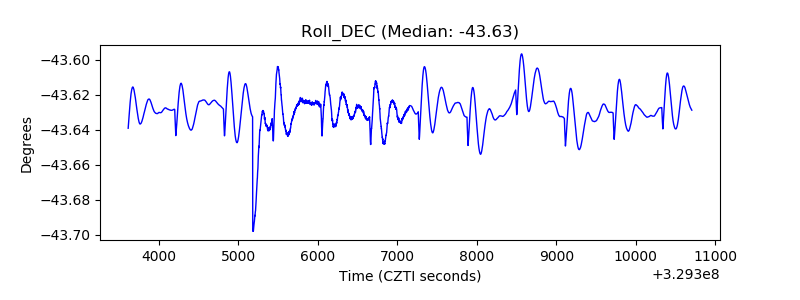 |
| _Roll_RA |  |
| Veto Counter | 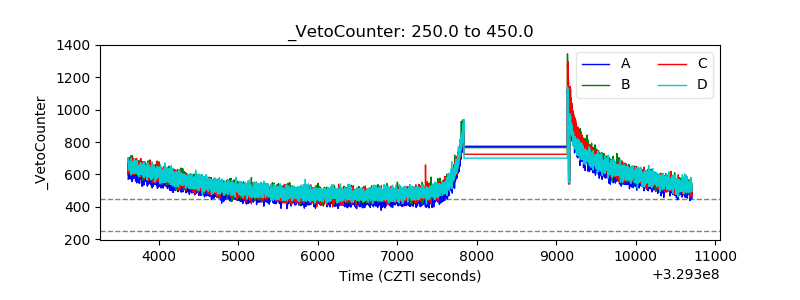 |