| Param | Original file | Final file |
|---|---|---|
| Filename | modeM0/AS1A09_057T04_9000003712_25390cztM0_level2.evt | modeM0/AS1A09_057T04_9000003712_25390cztM0_level2_quad_clean.evt |
| Size (bytes) | 772,712,640 | 77,296,320 |
| Size | 736.9 MB | 73.7 MB |
| Events in quadrant A | 5,685,994 | 503,775 |
| Events in quadrant B | 3,424,034 | 514,370 |
| Events in quadrant C | 3,287,694 | 478,483 |
| Events in quadrant D | 10,581,027 | 405,895 |
| Mode M9 | |||
|---|---|---|---|
| Quadrant | BADHDUFLAG | Total packets | Discarded packets |
| A | 0 | 12 | 0 |
| B | 0 | 12 | 0 |
| C | 0 | 12 | 0 |
| D | 0 | 12 | 0 |
| Mode M0 | |||
|---|---|---|---|
| Quadrant | BADHDUFLAG | Total packets | Discarded packets |
| A | 0 | 21221 | 0 |
| B | 0 | 13640 | 0 |
| C | 0 | 13333 | 0 |
| D | 0 | 35840 | 0 |
| Quadrant | Total seconds | Saturated seconds | Saturation percentage |
|---|---|---|---|
| A | 6266 | 487 | 7.772103% |
| B | 6267 | 88 | 1.404181% |
| C | 6267 | 112 | 1.787139% |
| D | 6267 | 2561 | 40.864848% |
Noise dominated data is calculated using 1-second bins in cleaned event files. If a bin has >2000 counts, and if more than 50% of those come from <1% of pixels, then it is considered to be noise-dominated and hence unusable.
| Quadrant | # 1 sec bins | Bins with >0 counts | Bins with >2000 counts | High rate bins dominated by noise | Noise dominated (total time) | Noise dominated (detector-on time) | Marked lightcurve |
|---|---|---|---|---|---|---|---|
| A | 7546 | 6267 | 309 | 309 | 4.09% | 4.93% | 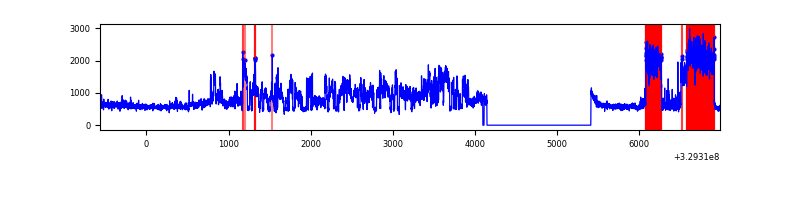 |
| B | 7547 | 6268 | 3 | 3 | 0.04% | 0.05% | 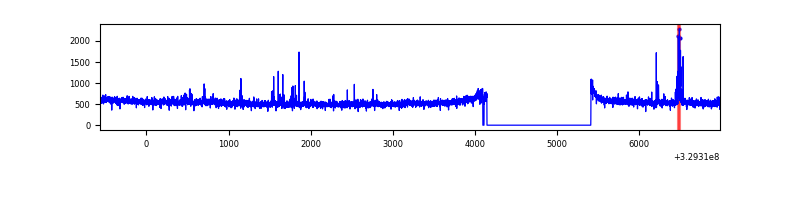 |
| C | 7547 | 6267 | 0 | 0 | 0.00% | 0.00% | 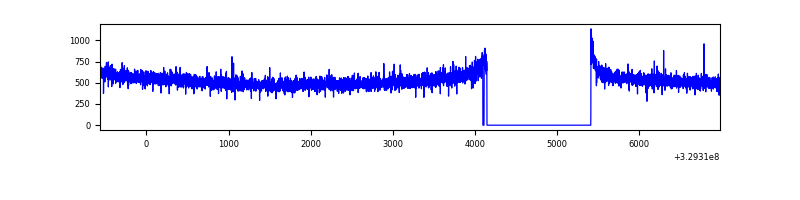 |
| D | 7546 | 6266 | 2232 | 2232 | 29.58% | 35.62% | 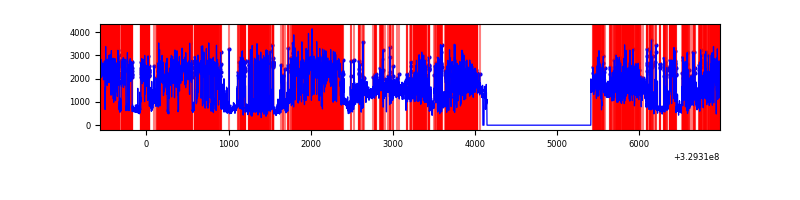 |
Top three noisy pixels from each quadrant. If the there are fewer than three noisy pixels in the level2.evt file, extra rows are filled as -1
| Pixel properties | Quadrant properties | ||||||
|---|---|---|---|---|---|---|---|
| Quadrant | DetID | PixID | Counts | Sigma | Mean | Median | Sigma |
| A | 6 | 16 | 2360884 | 13970.46 | 854 | 839 | 168.9 |
| A | 15 | 173 | 31999 | 184.45 | 854 | 839 | 168.9 |
| A | 13 | 254 | 8560 | 45.71 | 854 | 839 | 168.9 |
| B | 0 | 190 | 50807 | 320.67 | 844 | 826 | 155.9 |
| B | 0 | 229 | 24773 | 153.64 | 844 | 826 | 155.9 |
| B | 12 | 111 | 18667 | 114.46 | 844 | 826 | 155.9 |
| C | 14 | 238 | 132283 | 707.44 | 807 | 813 | 185.8 |
| C | 13 | 61 | 5497 | 25.2 | 807 | 813 | 185.8 |
| C | 7 | 247 | 4816 | 21.54 | 807 | 813 | 185.8 |
| D | 1 | 52 | 5906251 | 34297.77 | 725 | 705 | 172.2 |
| D | 7 | 238 | 1193244 | 6925.93 | 725 | 705 | 172.2 |
| D | 8 | 195 | 649970 | 3770.75 | 725 | 705 | 172.2 |
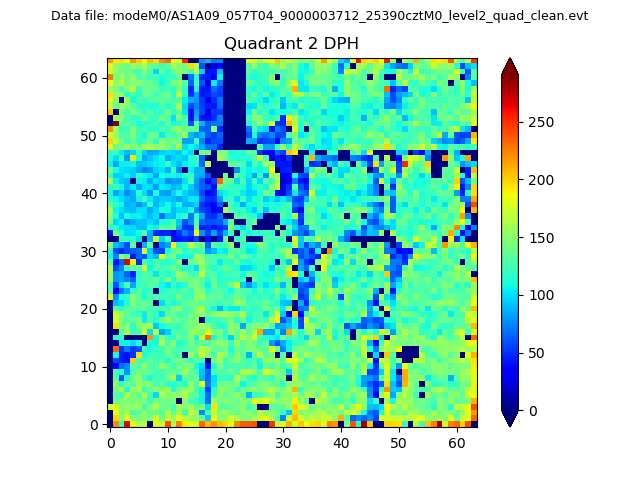
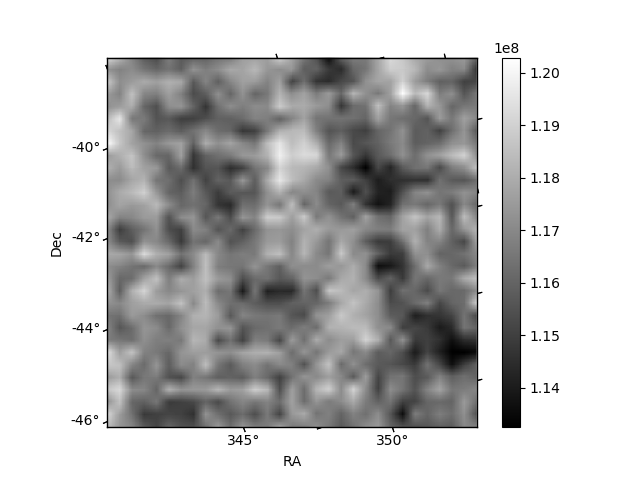
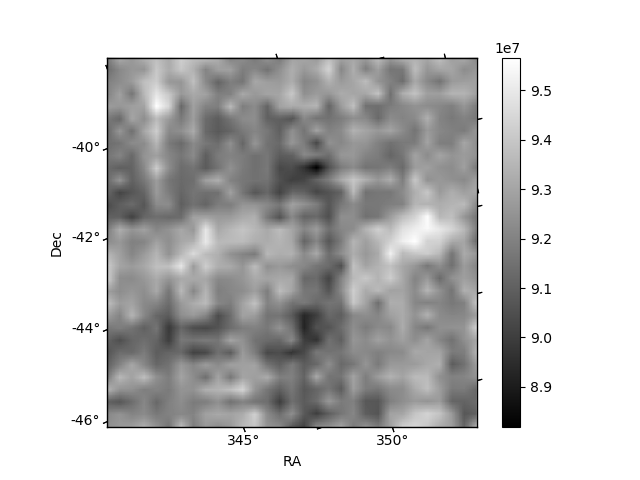
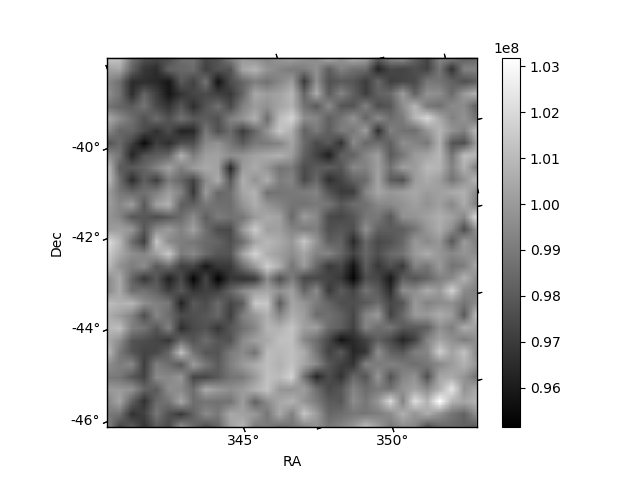
Histogram calculated using DETX and DETY for each event in the final _common_clean file
| Quadrant A |  |
 |
Quadrant B |
|---|---|---|---|
| Quadrant D | 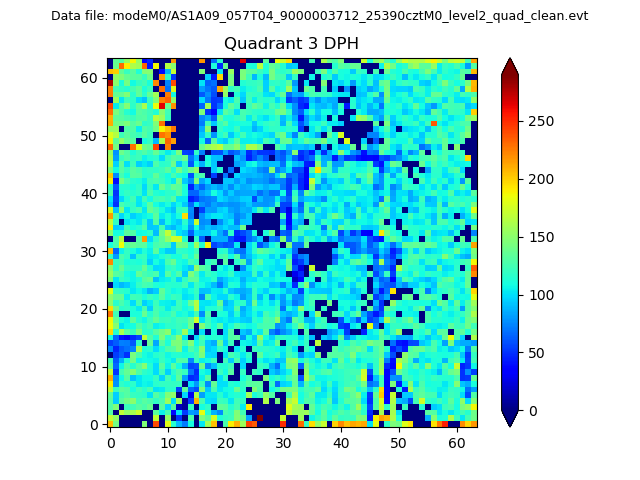 |
 |
Quadrant C |
| Plot type | Count rate plots | Images |
|---|---|---|
| Comparison with Poisson distribution Blue bars denote a histogram of data divided into 1 sec bins. Red curve is a Poisson curve with rate = median count rate of data. |
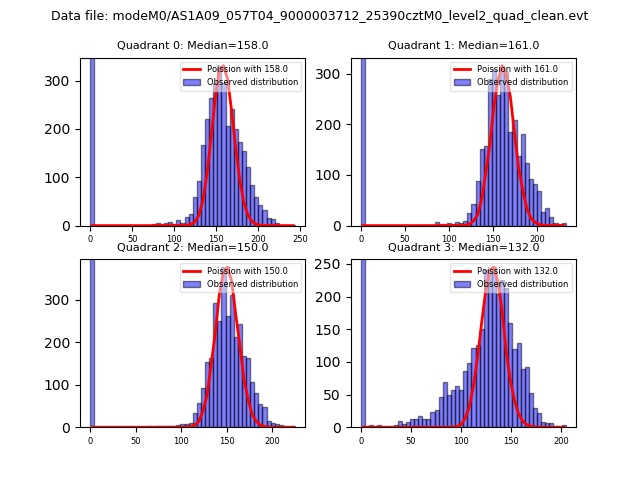 |
 |
| Quadrant-wise count rates Data is divided into 100 sec bins |
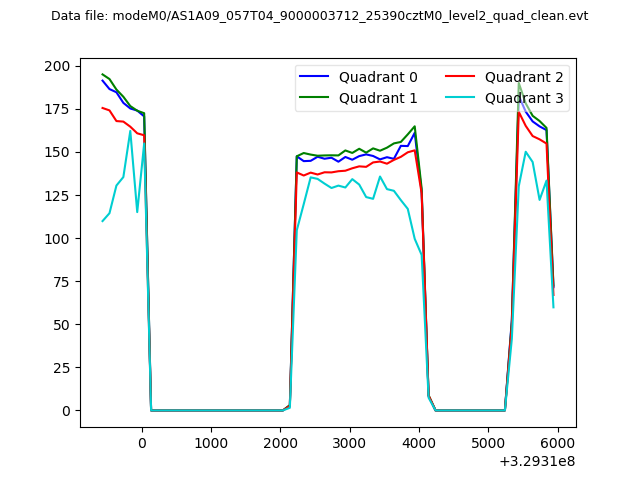 |
|
| Module-wise count rates for Quadrant A Data is divided into 100 sec bins |
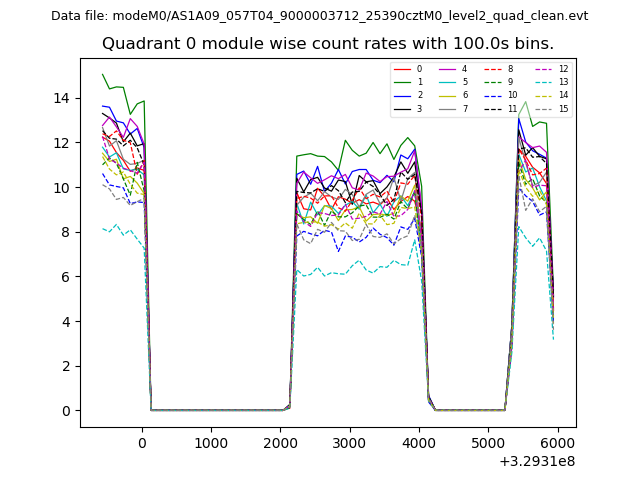 |
 |
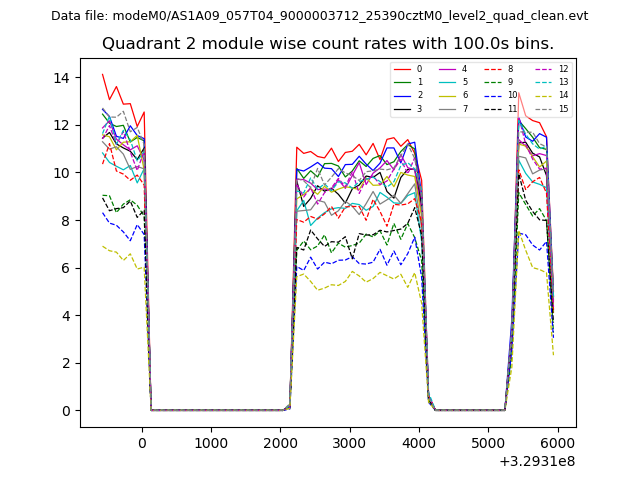
| Module-wise count rates for Quadrant B Data is divided into 100 sec bins |
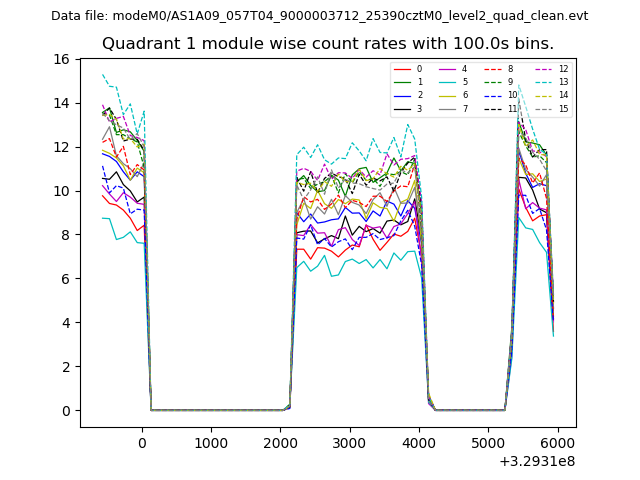 |
 |
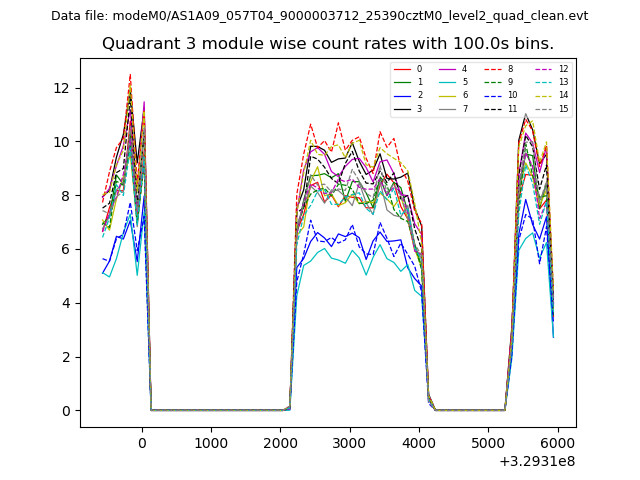
| Module-wise count rates for Quadrant C Data is divided into 100 sec bins |
 |
 |
| Module-wise count rates for Quadrant D Data is divided into 100 sec bins |
 |
 |
| Parameter | Plot |
|---|---|
| CZT HV Monitor | 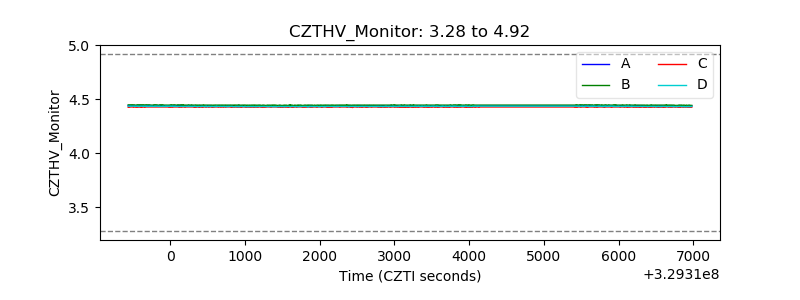 |
| D_VDD | 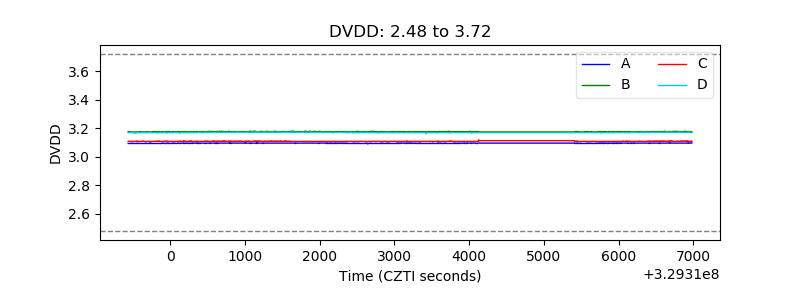 |
| Temperature 1 |  |
| Veto HV Monitor | 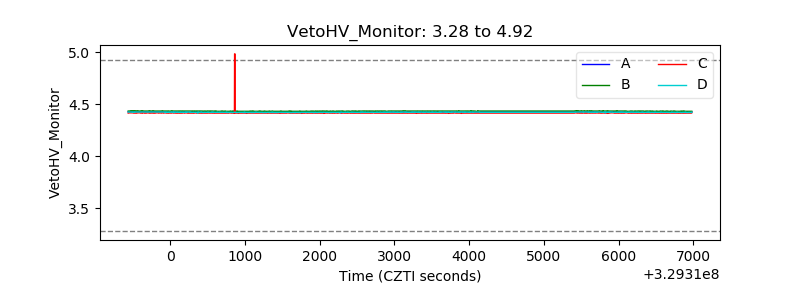 |
| Veto LLD |  |
| Alpha Counter | 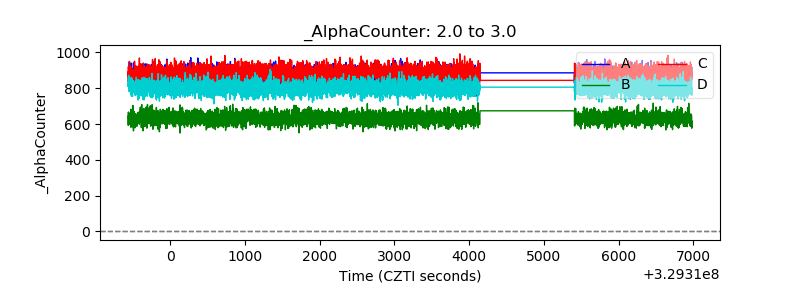 |
| _CPM_Rate | 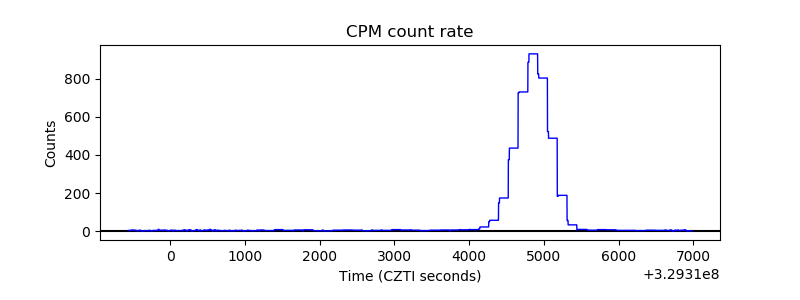 |
| CZT Counter | 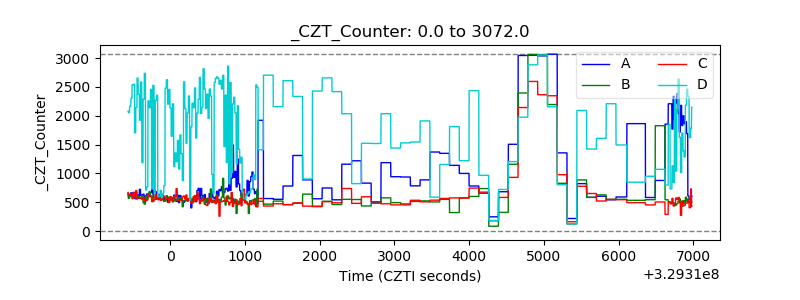 |
| +2.5 Volts monitor |  |
| +5 Volts monitor | 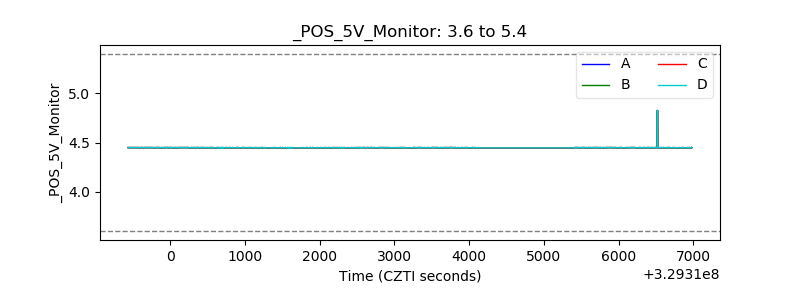 |
| _ROLL_ROT |  |
| _Roll_DEC | 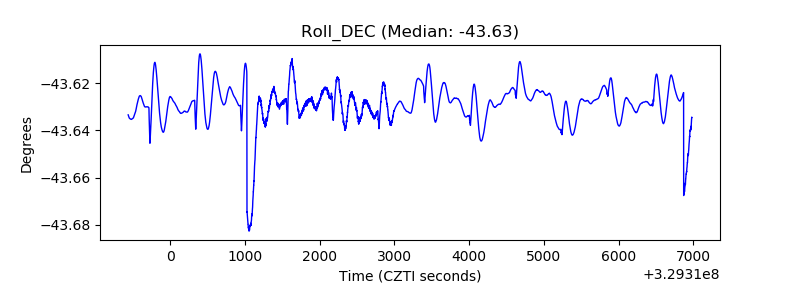 |
| _Roll_RA | 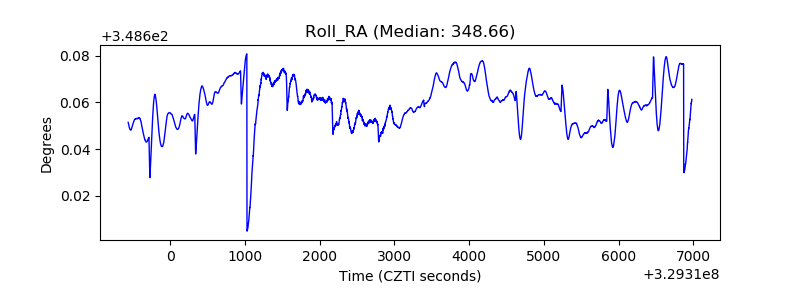 |
| Veto Counter |  |