| Param | Original file | Final file |
|---|---|---|
| Filename | modeM0/AS1A09_057T04_9000003712_25391cztM0_level2.evt | modeM0/AS1A09_057T04_9000003712_25391cztM0_level2_quad_clean.evt |
| Size (bytes) | 743,345,280 | 77,613,120 |
| Size | 708.9 MB | 74.0 MB |
| Events in quadrant A | 7,399,672 | 467,042 |
| Events in quadrant B | 3,576,452 | 495,516 |
| Events in quadrant C | 3,462,572 | 464,537 |
| Events in quadrant D | 7,613,966 | 448,852 |
| Mode M9 | |||
|---|---|---|---|
| Quadrant | BADHDUFLAG | Total packets | Discarded packets |
| A | 0 | 10 | 0 |
| B | 0 | 10 | 0 |
| C | 0 | 10 | 0 |
| D | 0 | 10 | 0 |
| Mode M0 | |||
|---|---|---|---|
| Quadrant | BADHDUFLAG | Total packets | Discarded packets |
| A | 0 | 26371 | 0 |
| B | 0 | 14476 | 0 |
| C | 0 | 14210 | 0 |
| D | 0 | 27743 | 0 |
| Quadrant | Total seconds | Saturated seconds | Saturation percentage |
|---|---|---|---|
| A | 6799 | 1743 | 25.636123% |
| B | 6800 | 108 | 1.588235% |
| C | 6800 | 118 | 1.735294% |
| D | 6799 | 1143 | 16.811296% |
Noise dominated data is calculated using 1-second bins in cleaned event files. If a bin has >2000 counts, and if more than 50% of those come from <1% of pixels, then it is considered to be noise-dominated and hence unusable.
| Quadrant | # 1 sec bins | Bins with >0 counts | Bins with >2000 counts | High rate bins dominated by noise | Noise dominated (total time) | Noise dominated (detector-on time) | Marked lightcurve |
|---|---|---|---|---|---|---|---|
| A | 7799 | 6799 | 1555 | 1555 | 19.94% | 22.87% | 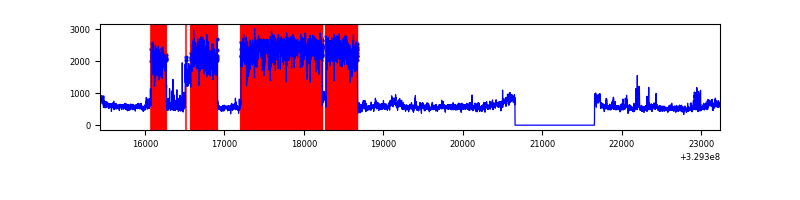 |
| B | 7800 | 6800 | 4 | 4 | 0.05% | 0.06% | 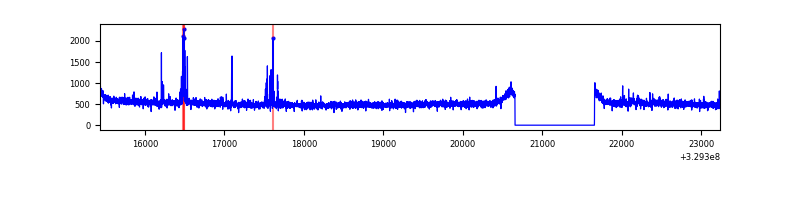 |
| C | 7800 | 6800 | 0 | 0 | 0.00% | 0.00% | 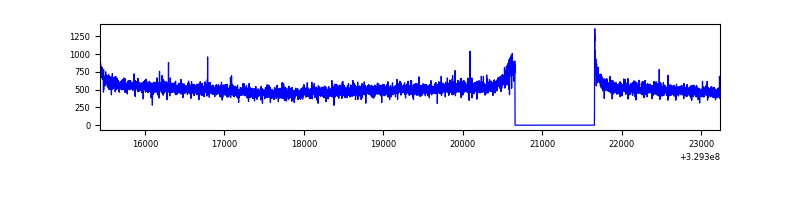 |
| D | 7798 | 6798 | 895 | 895 | 11.48% | 13.17% | 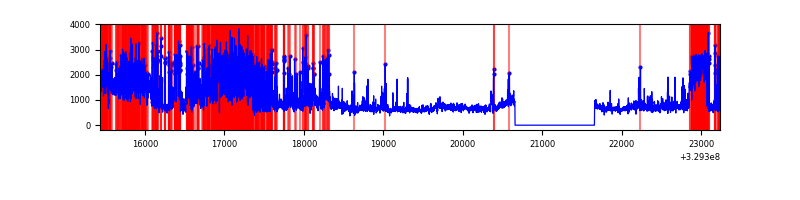 |
Top three noisy pixels from each quadrant. If the there are fewer than three noisy pixels in the level2.evt file, extra rows are filled as -1
| Pixel properties | Quadrant properties | ||||||
|---|---|---|---|---|---|---|---|
| Quadrant | DetID | PixID | Counts | Sigma | Mean | Median | Sigma |
| A | 6 | 16 | 4062043 | 24079.29 | 850 | 833 | 168.7 |
| A | 15 | 173 | 54638 | 319.01 | 850 | 833 | 168.7 |
| A | 13 | 254 | 8942 | 48.08 | 850 | 833 | 168.7 |
| B | 0 | 190 | 48568 | 287.18 | 884 | 863 | 166.1 |
| B | 15 | 32 | 27335 | 159.36 | 884 | 863 | 166.1 |
| B | 12 | 111 | 20014 | 115.29 | 884 | 863 | 166.1 |
| C | 14 | 238 | 136815 | 694.2 | 849 | 858 | 195.8 |
| C | 3 | 233 | 11829 | 56.02 | 849 | 858 | 195.8 |
| C | 7 | 247 | 8370 | 38.36 | 849 | 858 | 195.8 |
| D | 1 | 52 | 2308779 | 11943.31 | 809 | 786 | 193.2 |
| D | 8 | 195 | 1476620 | 7637.09 | 809 | 786 | 193.2 |
| D | 7 | 238 | 751678 | 3885.69 | 809 | 786 | 193.2 |
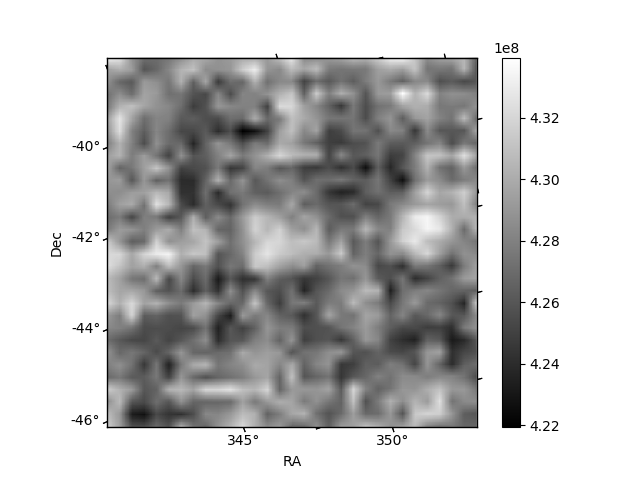
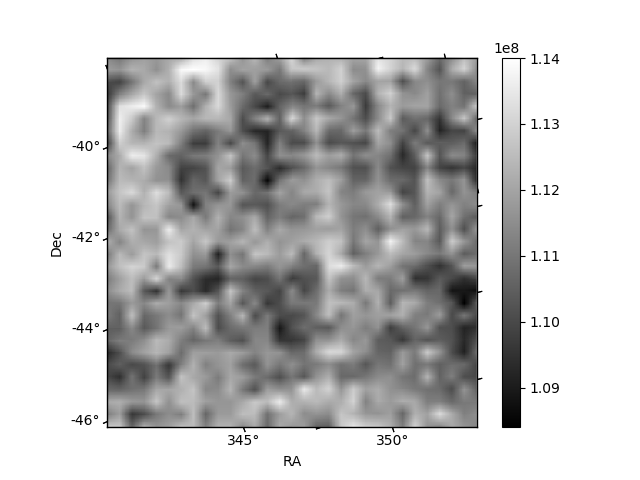
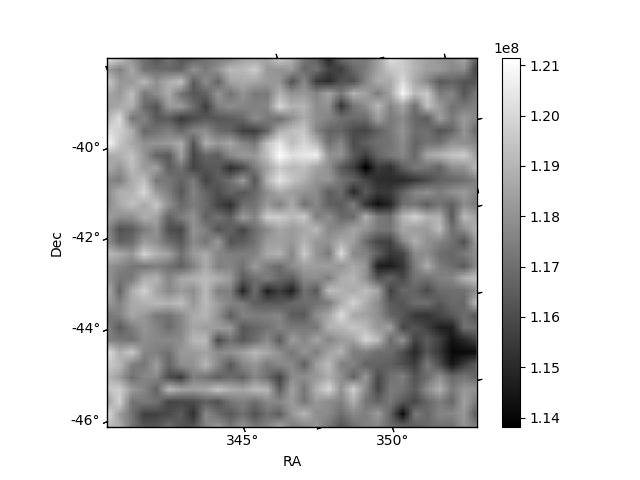
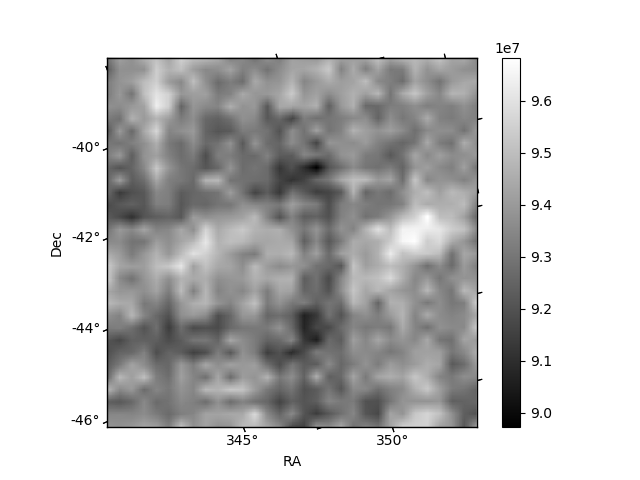
Histogram calculated using DETX and DETY for each event in the final _common_clean file
| Quadrant A | 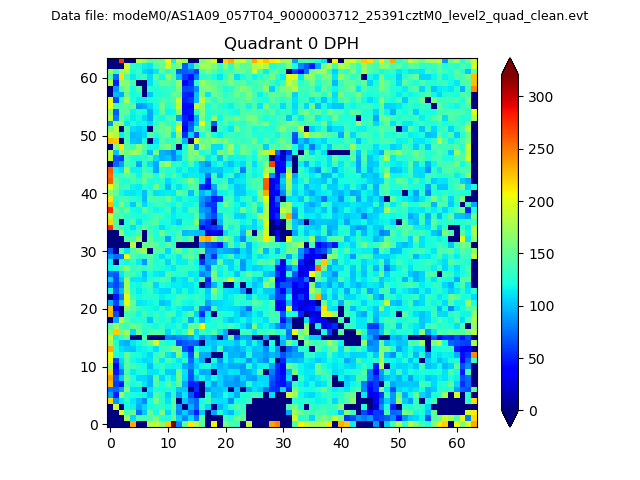 |
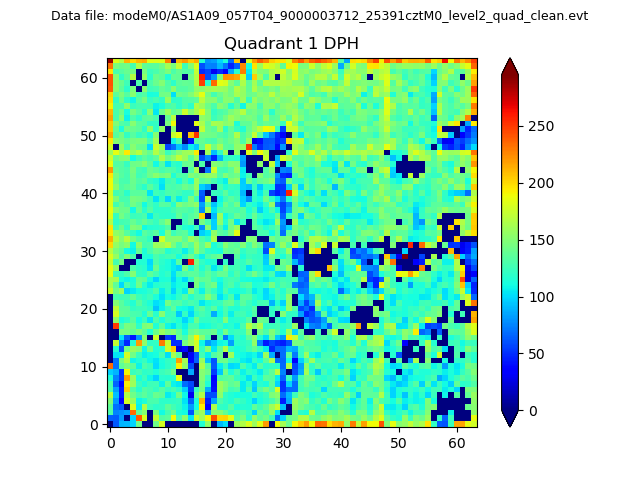 |
Quadrant B |
|---|---|---|---|
| Quadrant D |  |
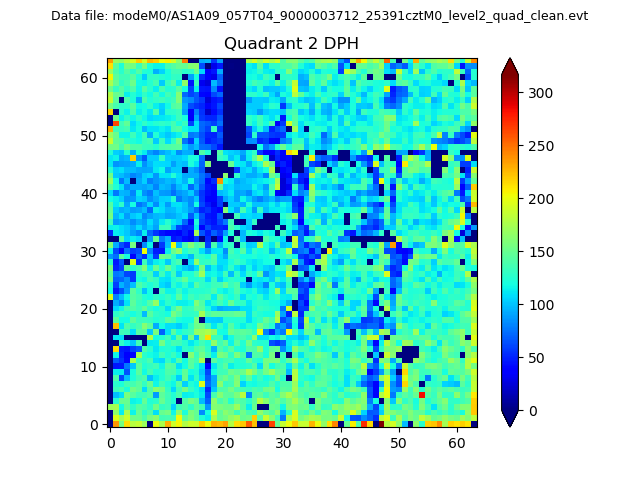 |
Quadrant C |
| Plot type | Count rate plots | Images |
|---|---|---|
| Comparison with Poisson distribution Blue bars denote a histogram of data divided into 1 sec bins. Red curve is a Poisson curve with rate = median count rate of data. |
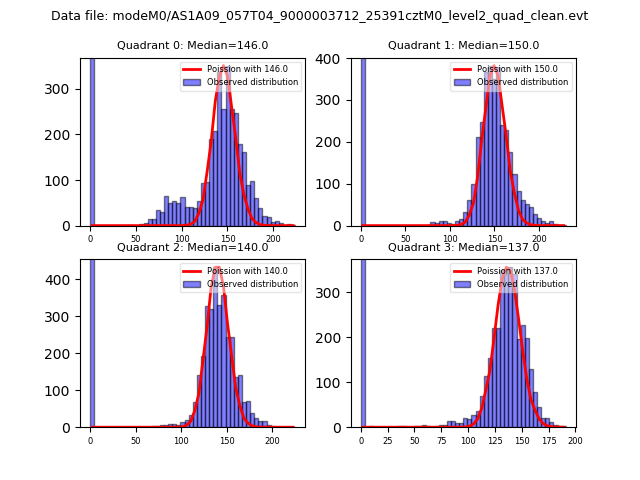 |
 |
| Quadrant-wise count rates Data is divided into 100 sec bins |
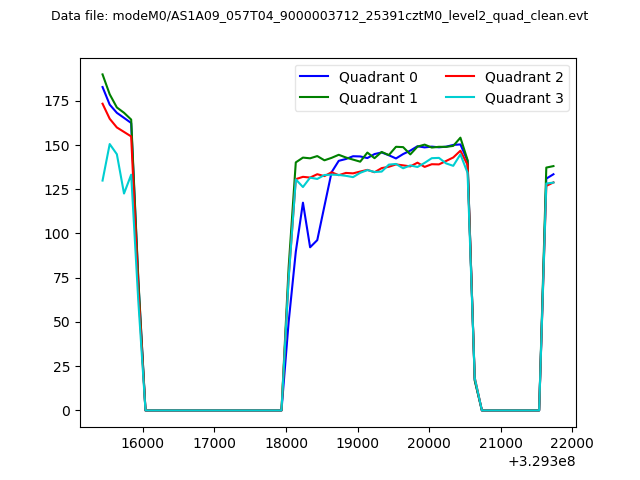 |
|
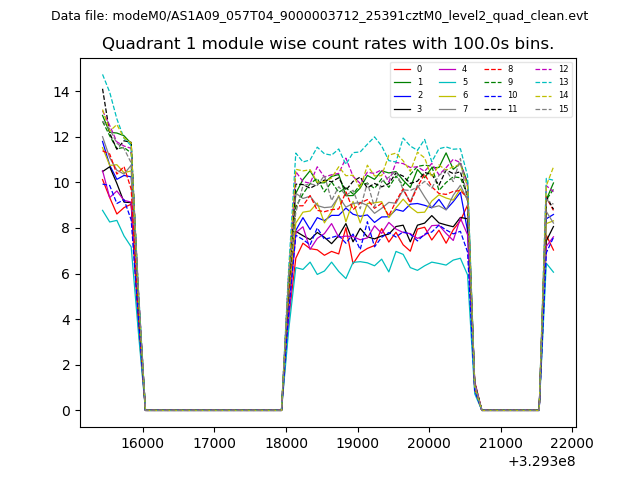
| Module-wise count rates for Quadrant A Data is divided into 100 sec bins |
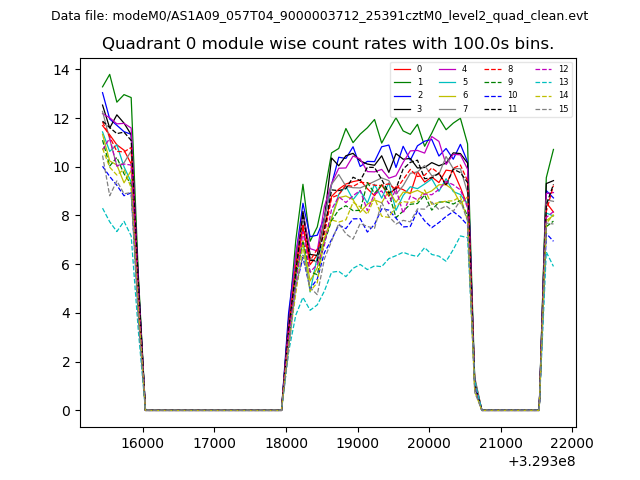 |
 |
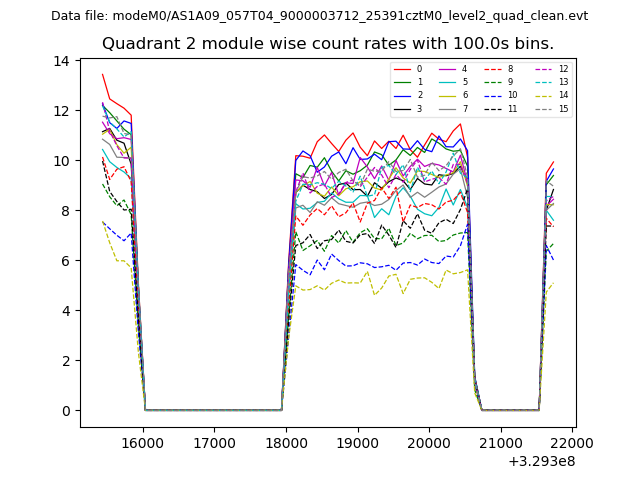
| Module-wise count rates for Quadrant B Data is divided into 100 sec bins |
 |
 |
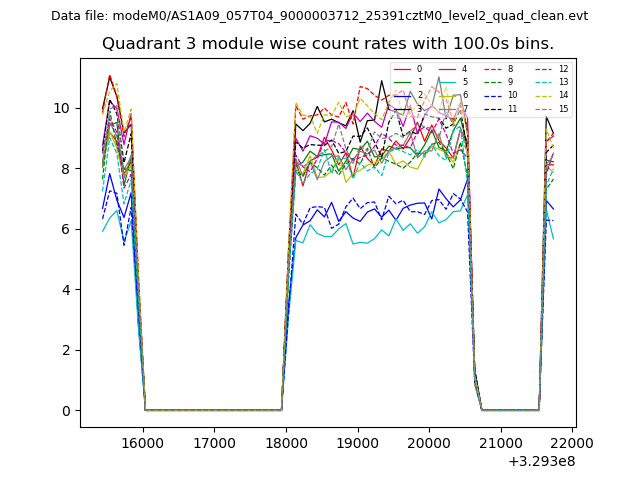
| Module-wise count rates for Quadrant C Data is divided into 100 sec bins |
 |
 |
| Module-wise count rates for Quadrant D Data is divided into 100 sec bins |
 |
 |
| Parameter | Plot |
|---|---|
| CZT HV Monitor | 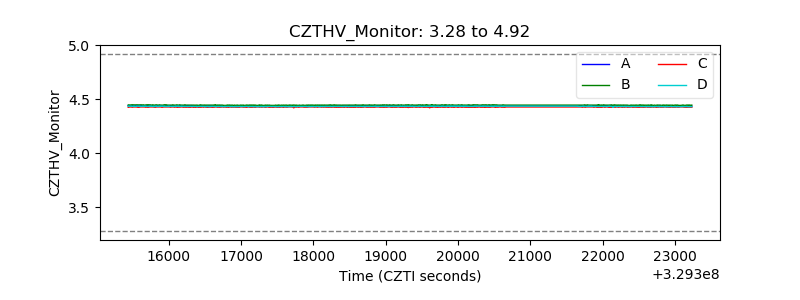 |
| D_VDD | 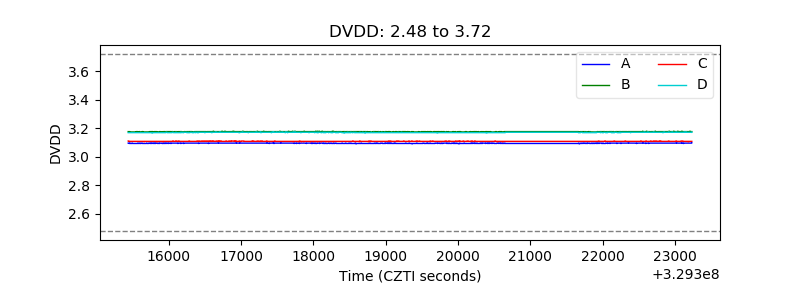 |
| Temperature 1 | 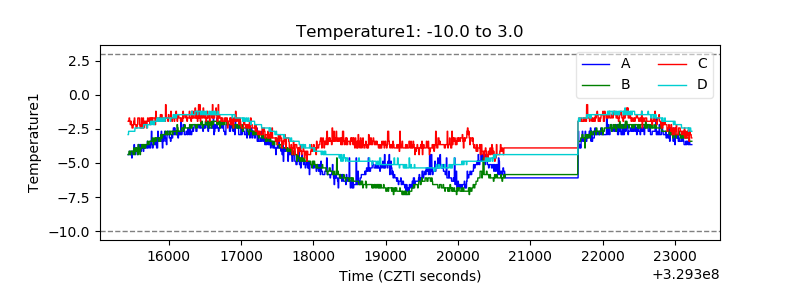 |
| Veto HV Monitor | 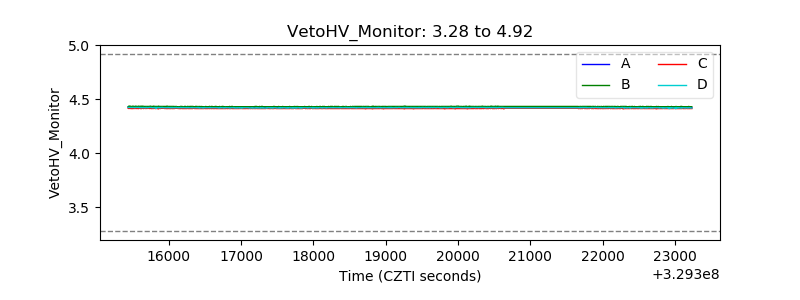 |
| Veto LLD | 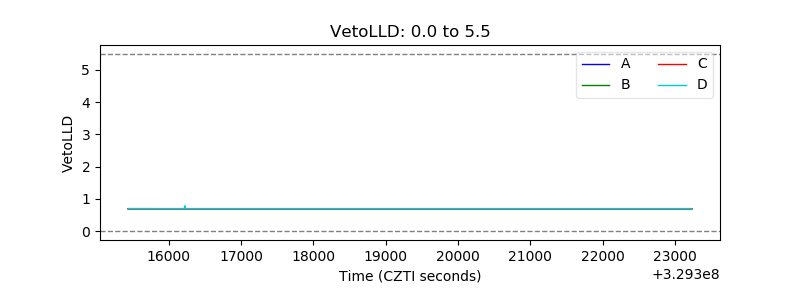 |
| Alpha Counter | 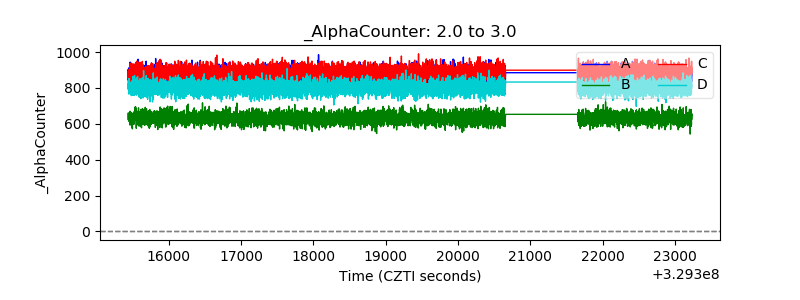 |
| _CPM_Rate | 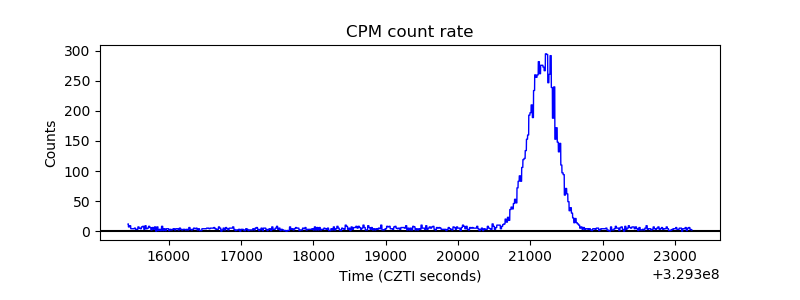 |
| CZT Counter |  |
| +2.5 Volts monitor | 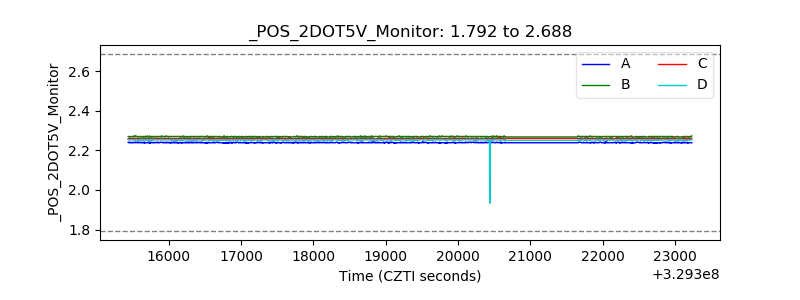 |
| +5 Volts monitor |  |
| _ROLL_ROT | 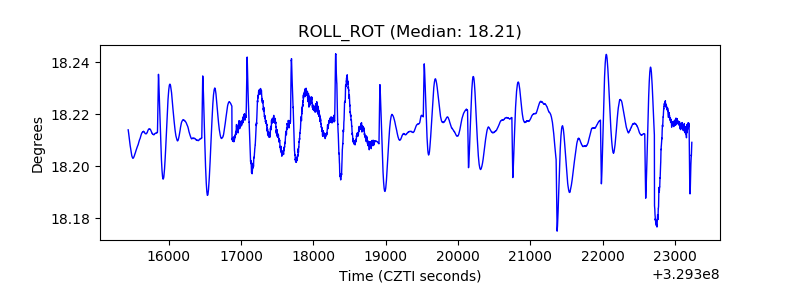 |
| _Roll_DEC |  |
| _Roll_RA | 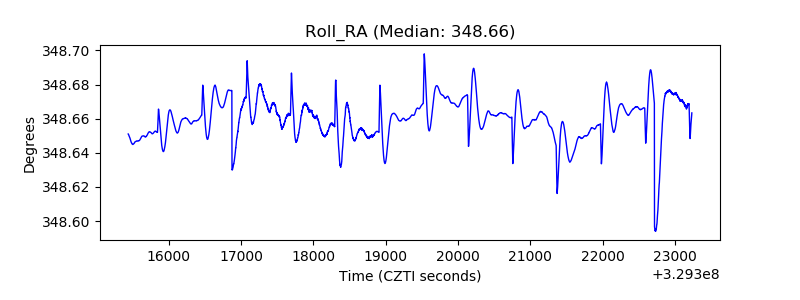 |
| Veto Counter | 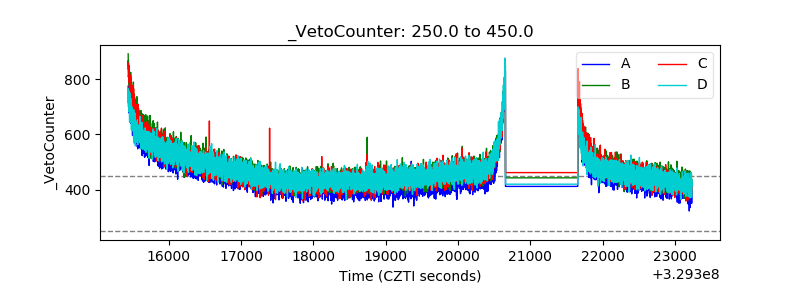 |