| Param | Original file | Final file |
|---|---|---|
| Filename | modeM0/AS1A09_057T04_9000003712_25392cztM0_level2.evt | modeM0/AS1A09_057T04_9000003712_25392cztM0_level2_quad_clean.evt |
| Size (bytes) | 616,510,080 | 79,367,040 |
| Size | 587.9 MB | 75.7 MB |
| Events in quadrant A | 4,494,054 | 484,917 |
| Events in quadrant B | 3,632,192 | 491,748 |
| Events in quadrant C | 3,516,208 | 466,955 |
| Events in quadrant D | 6,547,772 | 465,224 |
| Mode M9 | |||
|---|---|---|---|
| Quadrant | BADHDUFLAG | Total packets | Discarded packets |
| A | 0 | 6 | 0 |
| B | 0 | 7 | 0 |
| C | 0 | 7 | 0 |
| D | 0 | 7 | 0 |
| Mode M0 | |||
|---|---|---|---|
| Quadrant | BADHDUFLAG | Total packets | Discarded packets |
| A | 0 | 18014 | 0 |
| B | 0 | 15044 | 0 |
| C | 0 | 14742 | 0 |
| D | 0 | 24465 | 0 |
| Quadrant | Total seconds | Saturated seconds | Saturation percentage |
|---|---|---|---|
| A | 7092 | 136 | 1.917654% |
| B | 7092 | 159 | 2.241963% |
| C | 7092 | 152 | 2.143260% |
| D | 7092 | 885 | 12.478849% |
Noise dominated data is calculated using 1-second bins in cleaned event files. If a bin has >2000 counts, and if more than 50% of those come from <1% of pixels, then it is considered to be noise-dominated and hence unusable.
| Quadrant | # 1 sec bins | Bins with >0 counts | Bins with >2000 counts | High rate bins dominated by noise | Noise dominated (total time) | Noise dominated (detector-on time) | Marked lightcurve |
|---|---|---|---|---|---|---|---|
| A | 7662 | 7092 | 3 | 3 | 0.04% | 0.04% | 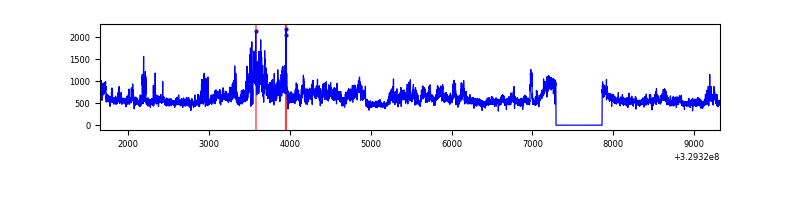 |
| B | 7662 | 7092 | 1 | 1 | 0.01% | 0.01% | 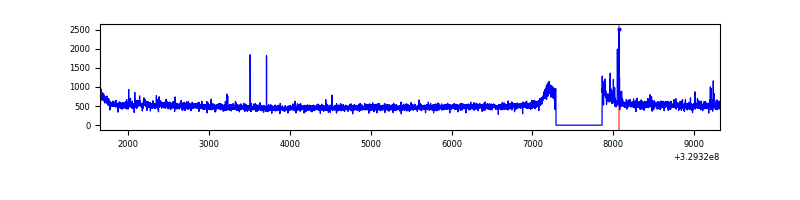 |
| C | 7662 | 7092 | 0 | 0 | 0.00% | 0.00% | 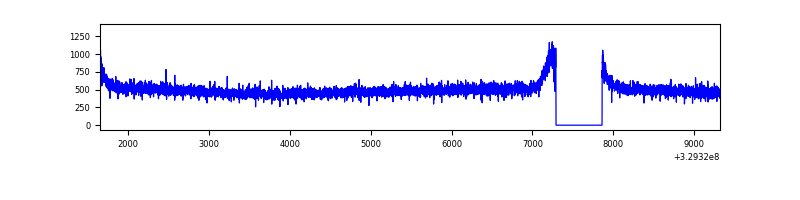 |
| D | 7662 | 7092 | 640 | 640 | 8.35% | 9.02% | 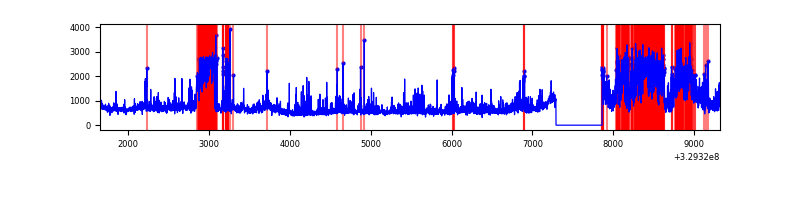 |
Top three noisy pixels from each quadrant. If the there are fewer than three noisy pixels in the level2.evt file, extra rows are filled as -1
| Pixel properties | Quadrant properties | ||||||
|---|---|---|---|---|---|---|---|
| Quadrant | DetID | PixID | Counts | Sigma | Mean | Median | Sigma |
| A | 6 | 16 | 950305 | 5170.99 | 910 | 889 | 183.6 |
| A | 15 | 173 | 33998 | 180.33 | 910 | 889 | 183.6 |
| A | 13 | 254 | 9470 | 46.74 | 910 | 889 | 183.6 |
| B | 0 | 190 | 53712 | 306.19 | 896 | 872 | 172.6 |
| B | 0 | 229 | 33300 | 187.91 | 896 | 872 | 172.6 |
| B | 12 | 111 | 21002 | 116.65 | 896 | 872 | 172.6 |
| C | 14 | 238 | 139144 | 685.93 | 862 | 867 | 201.6 |
| C | 3 | 233 | 14233 | 66.3 | 862 | 867 | 201.6 |
| C | 7 | 247 | 7378 | 32.3 | 862 | 867 | 201.6 |
| D | 12 | 233 | 1278167 | 6317.26 | 841 | 817 | 202.2 |
| D | 8 | 195 | 850435 | 4201.87 | 841 | 817 | 202.2 |
| D | 1 | 52 | 665753 | 3288.5 | 841 | 817 | 202.2 |
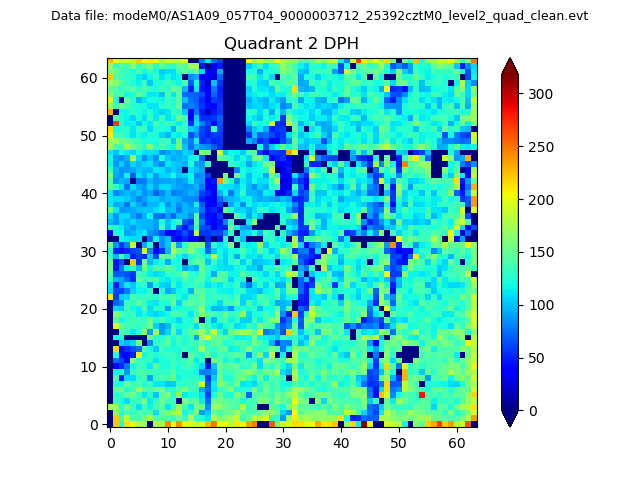
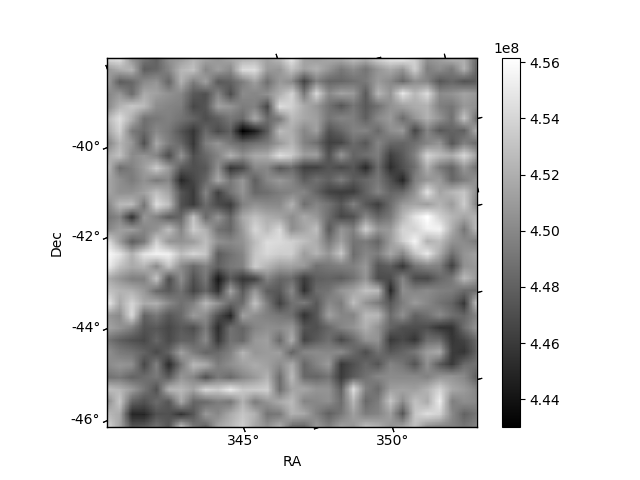
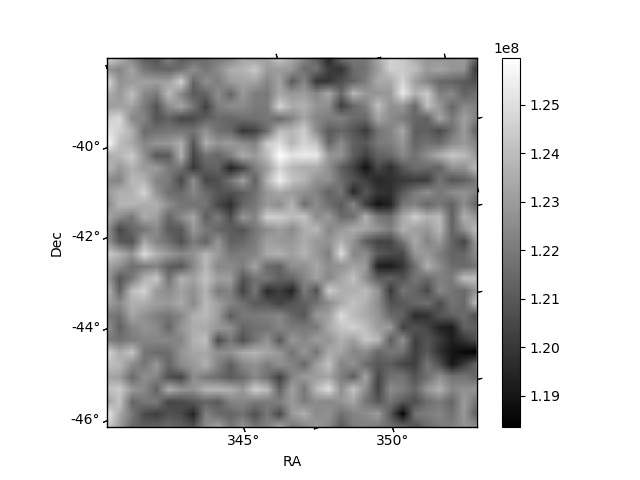
Histogram calculated using DETX and DETY for each event in the final _common_clean file
| Quadrant A | 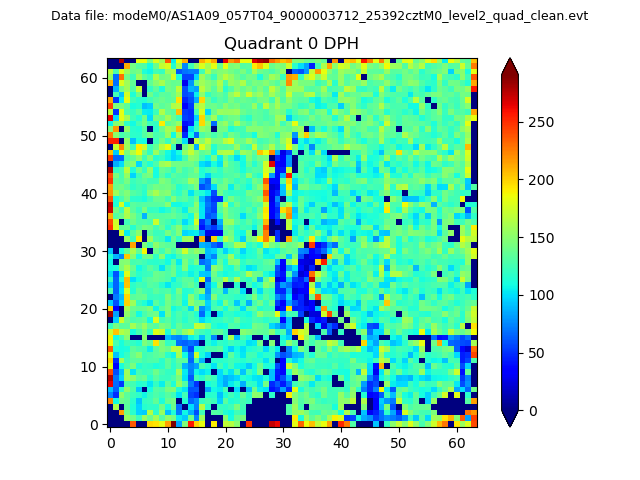 |
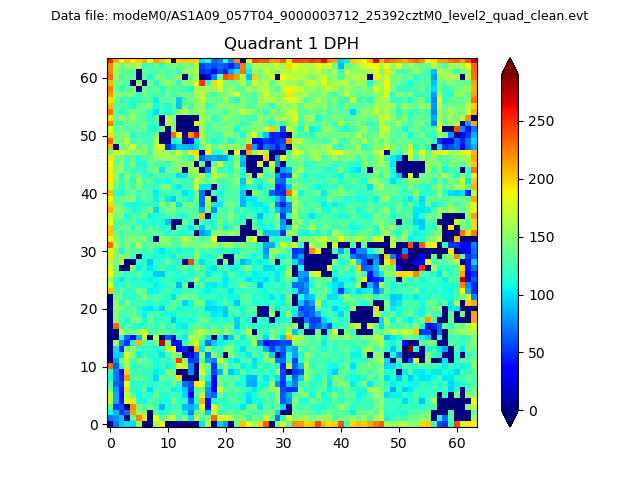 |
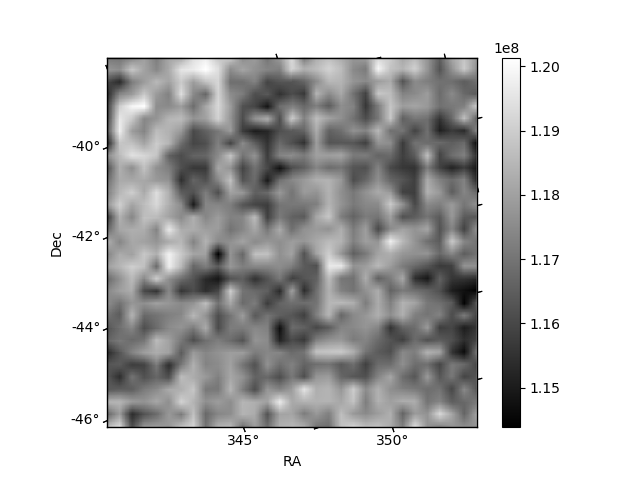
Quadrant B |
|---|---|---|---|
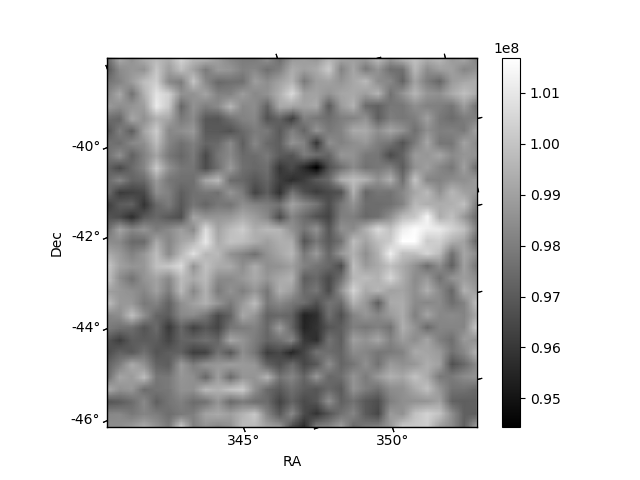
| Quadrant D | 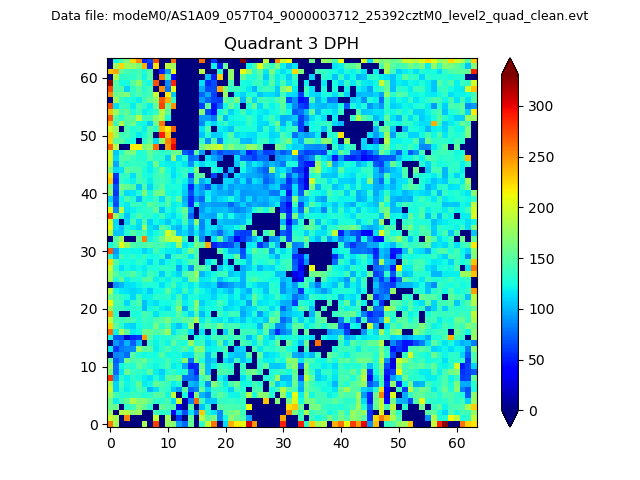 |
 |
Quadrant C |
| Plot type | Count rate plots | Images |
|---|---|---|
| Comparison with Poisson distribution Blue bars denote a histogram of data divided into 1 sec bins. Red curve is a Poisson curve with rate = median count rate of data. |
 |
 |
| Quadrant-wise count rates Data is divided into 100 sec bins |
 |
|
| Module-wise count rates for Quadrant A Data is divided into 100 sec bins |
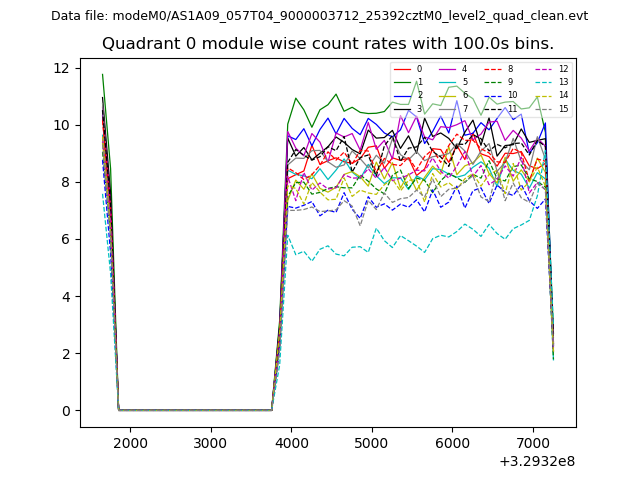 |
 |
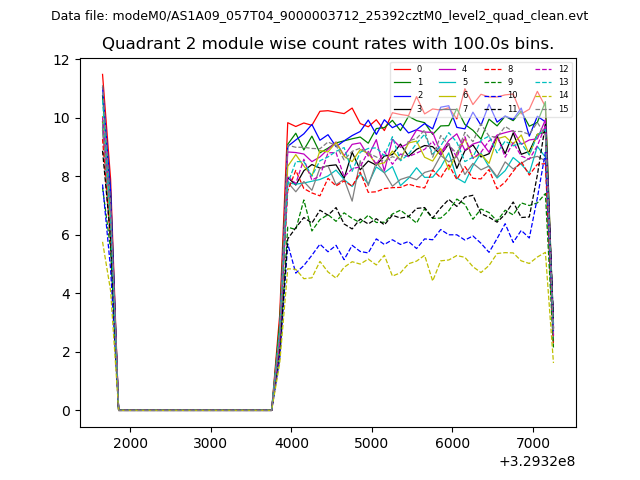
| Module-wise count rates for Quadrant B Data is divided into 100 sec bins |
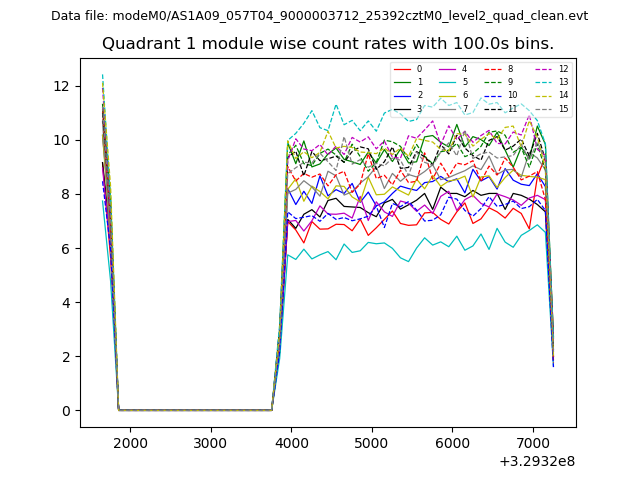 |
 |
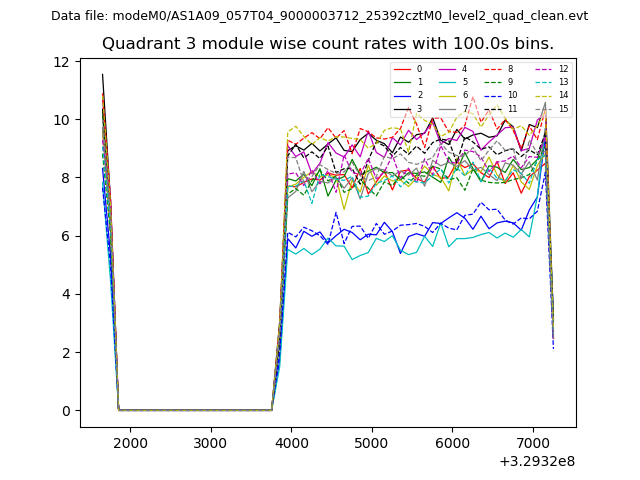
| Module-wise count rates for Quadrant C Data is divided into 100 sec bins |
 |
 |
| Module-wise count rates for Quadrant D Data is divided into 100 sec bins |
 |
 |
| Parameter | Plot |
|---|---|
| CZT HV Monitor | 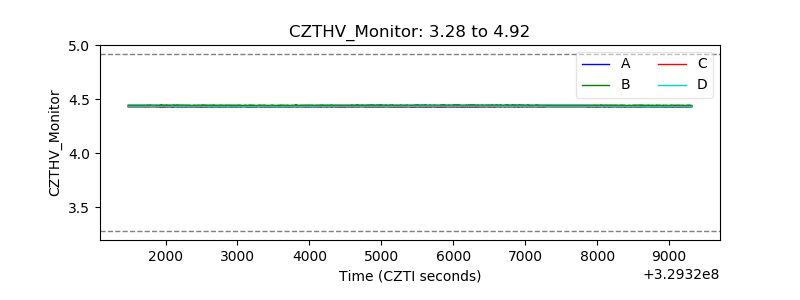 |
| D_VDD | 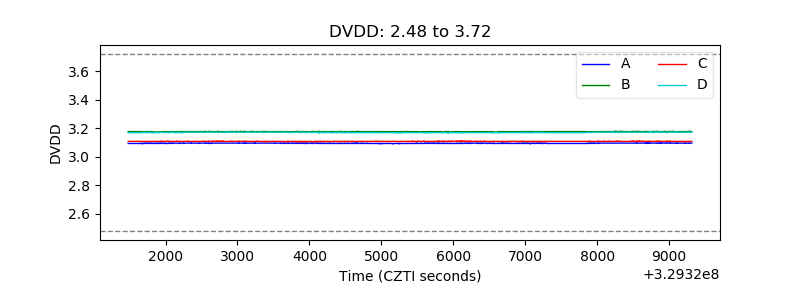 |
| Temperature 1 | 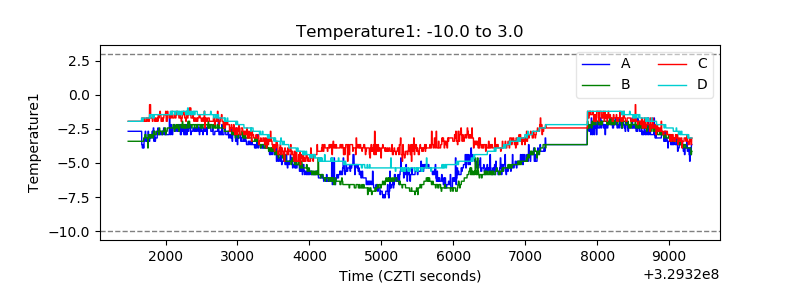 |
| Veto HV Monitor | 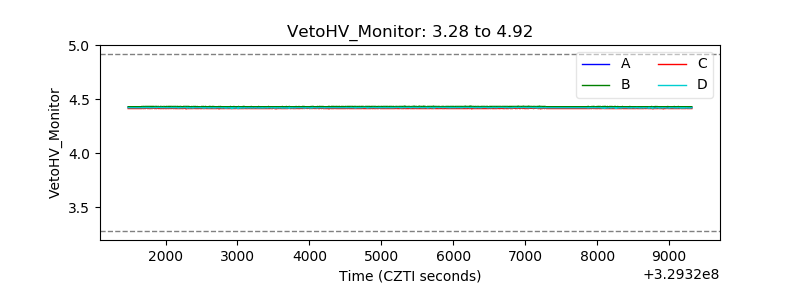 |
| Veto LLD | 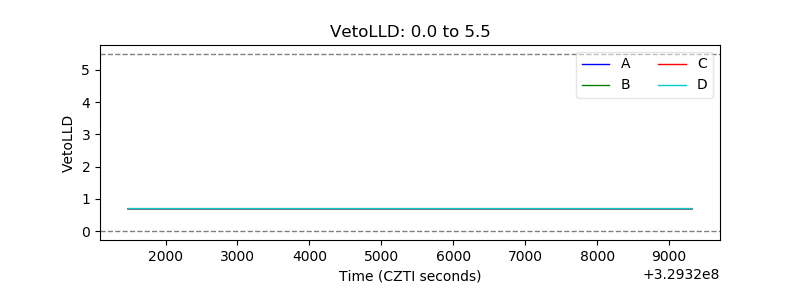 |
| Alpha Counter | 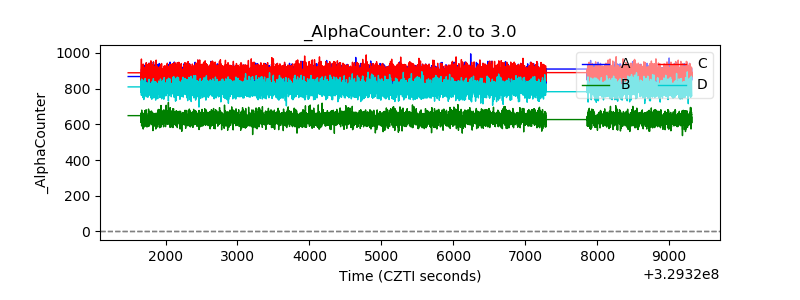 |
| _CPM_Rate |  |
| CZT Counter | 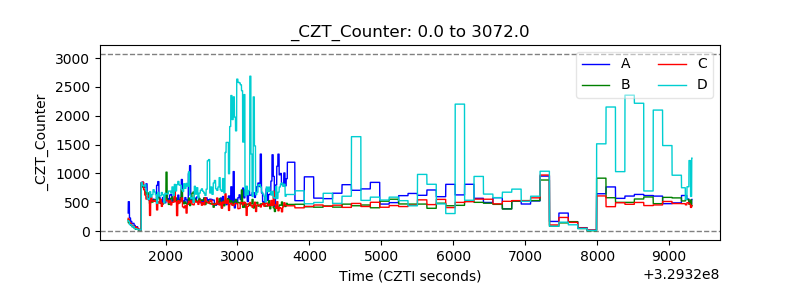 |
| +2.5 Volts monitor | 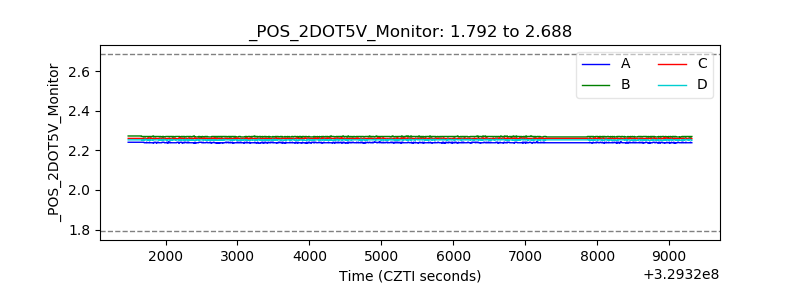 |
| +5 Volts monitor |  |
| _ROLL_ROT | 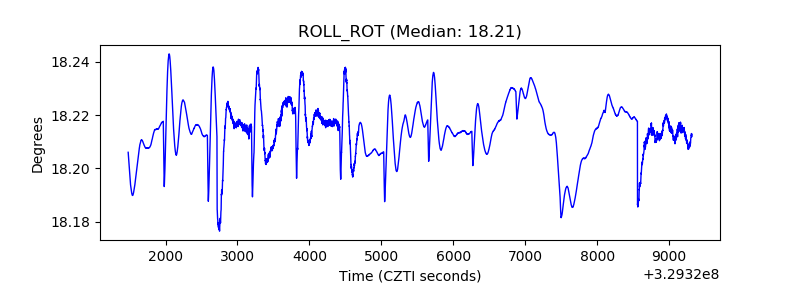 |
| _Roll_DEC | 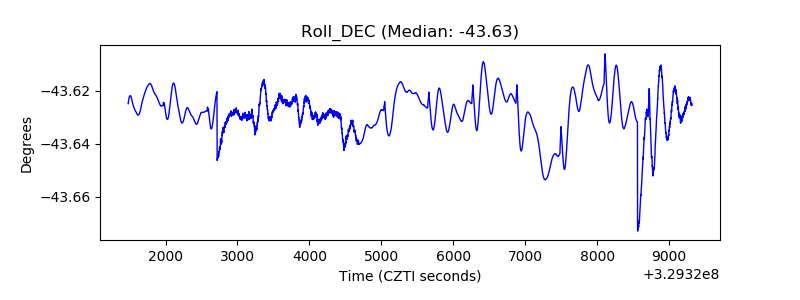 |
| _Roll_RA | 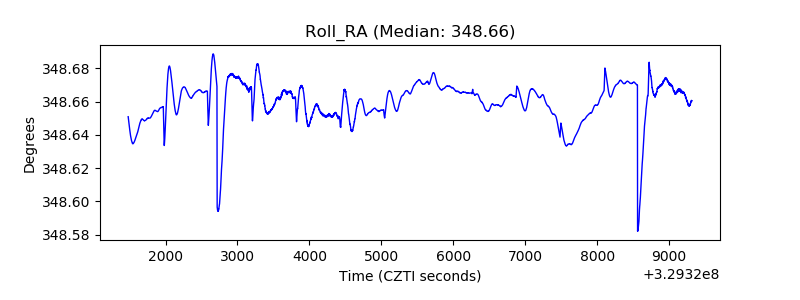 |
| Veto Counter | 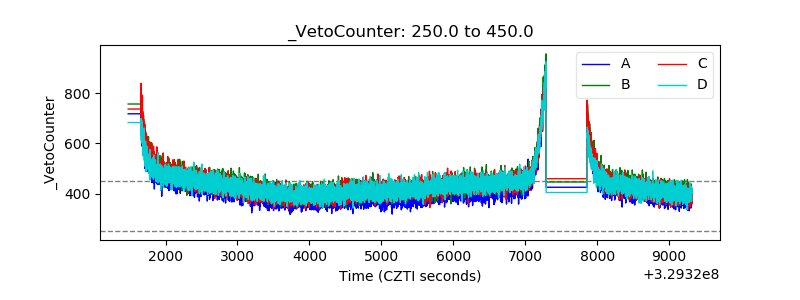 |