| Param | Original file | Final file |
|---|---|---|
| Filename | modeM0/AS1A09_057T04_9000003712_25393cztM0_level2.evt | modeM0/AS1A09_057T04_9000003712_25393cztM0_level2_quad_clean.evt |
| Size (bytes) | 657,262,080 | 80,910,720 |
| Size | 626.8 MB | 77.2 MB |
| Events in quadrant A | 4,711,583 | 491,649 |
| Events in quadrant B | 3,802,117 | 497,437 |
| Events in quadrant C | 3,641,897 | 474,853 |
| Events in quadrant D | 7,245,101 | 467,224 |
| Mode M9 | |||
|---|---|---|---|
| Quadrant | BADHDUFLAG | Total packets | Discarded packets |
| A | 0 | 2 | 0 |
| B | 0 | 2 | 0 |
| C | 0 | 2 | 0 |
| D | 0 | 2 | 0 |
| Mode M0 | |||
|---|---|---|---|
| Quadrant | BADHDUFLAG | Total packets | Discarded packets |
| A | 0 | 18933 | 0 |
| B | 0 | 15905 | 0 |
| C | 0 | 15456 | 0 |
| D | 0 | 26530 | 0 |
| Quadrant | Total seconds | Saturated seconds | Saturation percentage |
|---|---|---|---|
| A | 7453 | 133 | 1.784516% |
| B | 7453 | 160 | 2.146787% |
| C | 7453 | 148 | 1.985778% |
| D | 7453 | 866 | 11.619482% |
Noise dominated data is calculated using 1-second bins in cleaned event files. If a bin has >2000 counts, and if more than 50% of those come from <1% of pixels, then it is considered to be noise-dominated and hence unusable.
| Quadrant | # 1 sec bins | Bins with >0 counts | Bins with >2000 counts | High rate bins dominated by noise | Noise dominated (total time) | Noise dominated (detector-on time) | Marked lightcurve |
|---|---|---|---|---|---|---|---|
| A | 7688 | 7453 | 0 | 0 | 0.00% | 0.00% | 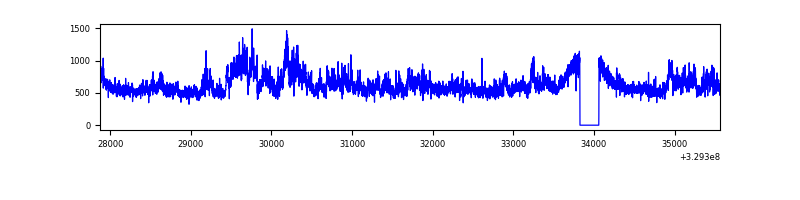 |
| B | 7688 | 7453 | 1 | 1 | 0.01% | 0.01% | 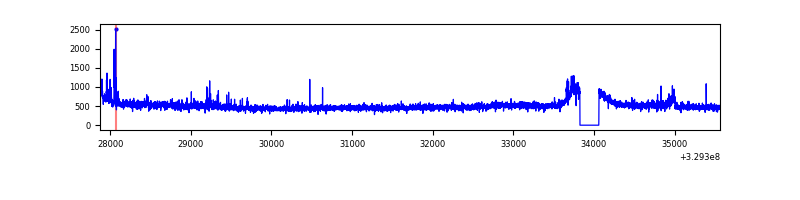 |
| C | 7688 | 7454 | 0 | 0 | 0.00% | 0.00% | 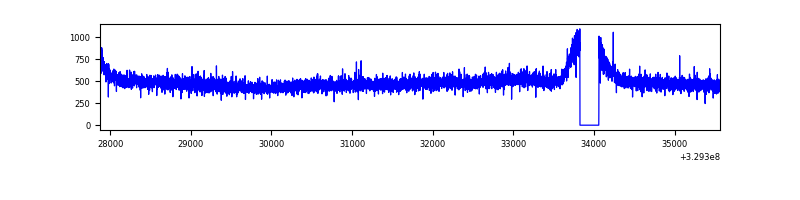 |
| D | 7688 | 7453 | 701 | 701 | 9.12% | 9.41% | 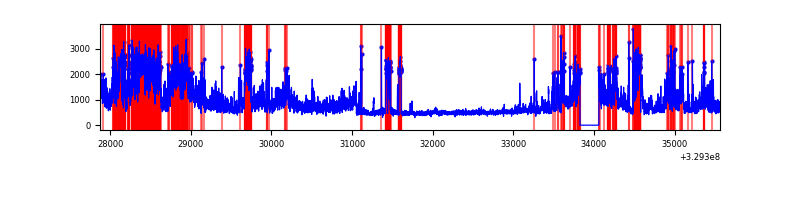 |
Top three noisy pixels from each quadrant. If the there are fewer than three noisy pixels in the level2.evt file, extra rows are filled as -1
| Pixel properties | Quadrant properties | ||||||
|---|---|---|---|---|---|---|---|
| Quadrant | DetID | PixID | Counts | Sigma | Mean | Median | Sigma |
| A | 6 | 16 | 1051880 | 5543.36 | 940 | 920 | 189.6 |
| A | 15 | 173 | 29953 | 153.14 | 940 | 920 | 189.6 |
| A | 13 | 254 | 10846 | 52.36 | 940 | 920 | 189.6 |
| B | 0 | 190 | 71875 | 398.61 | 924 | 900 | 178.1 |
| B | 0 | 229 | 39677 | 217.78 | 924 | 900 | 178.1 |
| B | 4 | 80 | 39472 | 216.63 | 924 | 900 | 178.1 |
| C | 14 | 238 | 143269 | 678.39 | 892 | 898 | 209.9 |
| C | 3 | 233 | 14801 | 66.25 | 892 | 898 | 209.9 |
| C | 7 | 247 | 10573 | 46.1 | 892 | 898 | 209.9 |
| D | 1 | 52 | 1476136 | 6943.78 | 878 | 851 | 212.5 |
| D | 12 | 233 | 1340927 | 6307.39 | 878 | 851 | 212.5 |
| D | 8 | 195 | 745746 | 3506.03 | 878 | 851 | 212.5 |
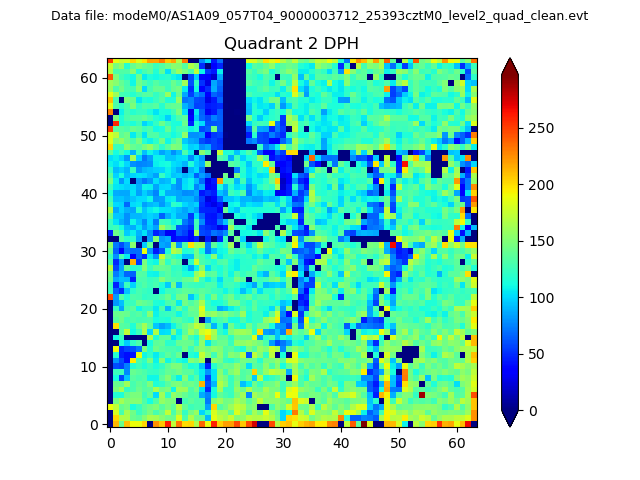
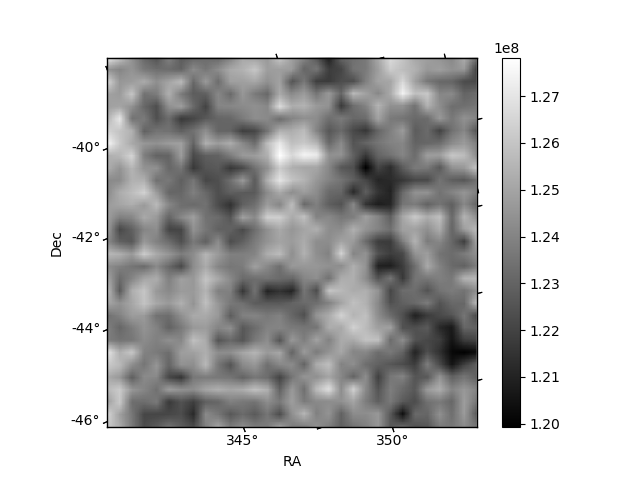
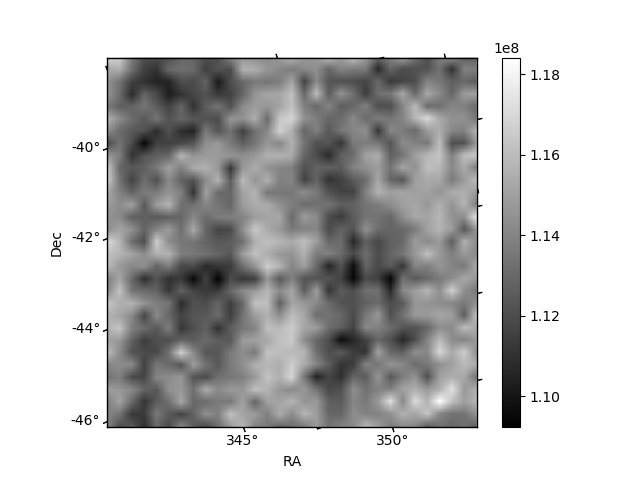
Histogram calculated using DETX and DETY for each event in the final _common_clean file
| Quadrant A | 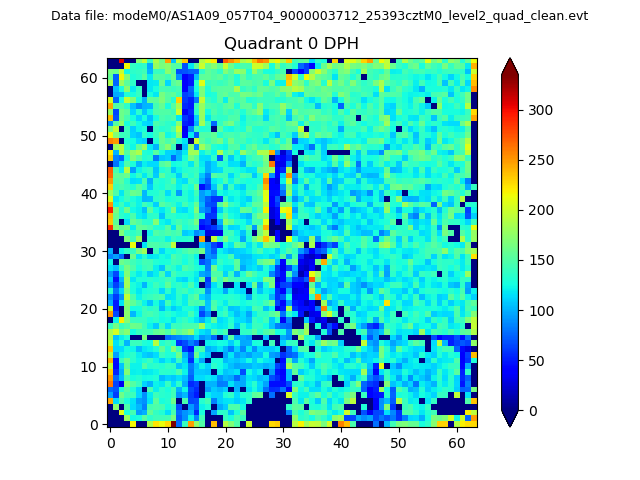 |
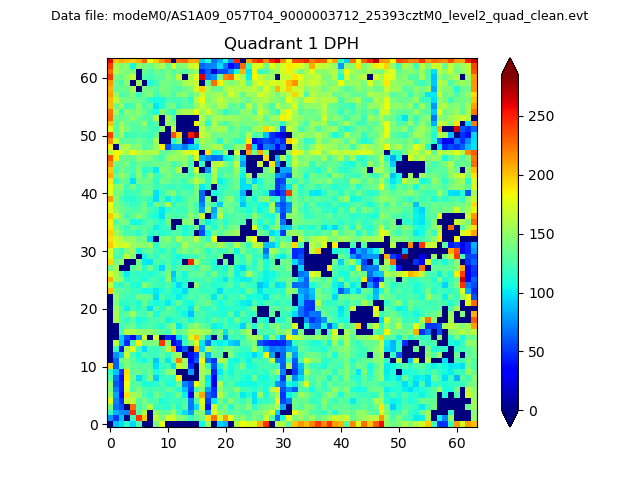 |
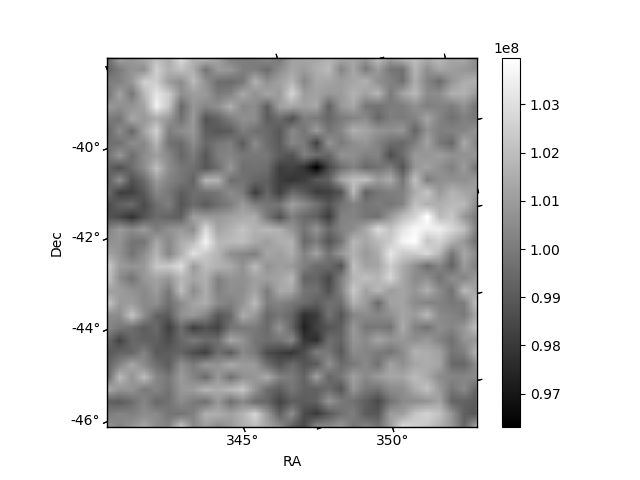
Quadrant B |
|---|---|---|---|
| Quadrant D | 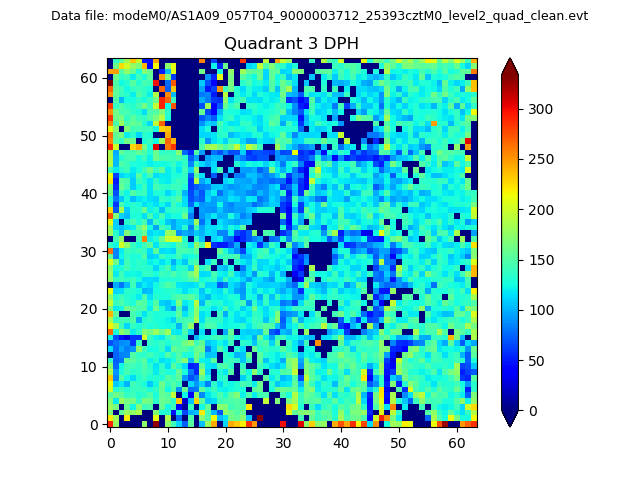 |
 |
Quadrant C |
| Plot type | Count rate plots | Images |
|---|---|---|
| Comparison with Poisson distribution Blue bars denote a histogram of data divided into 1 sec bins. Red curve is a Poisson curve with rate = median count rate of data. |
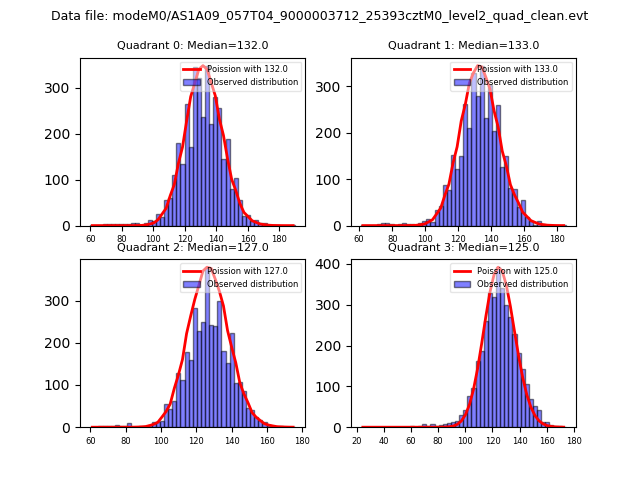 |
 |
| Quadrant-wise count rates Data is divided into 100 sec bins |
 |
|
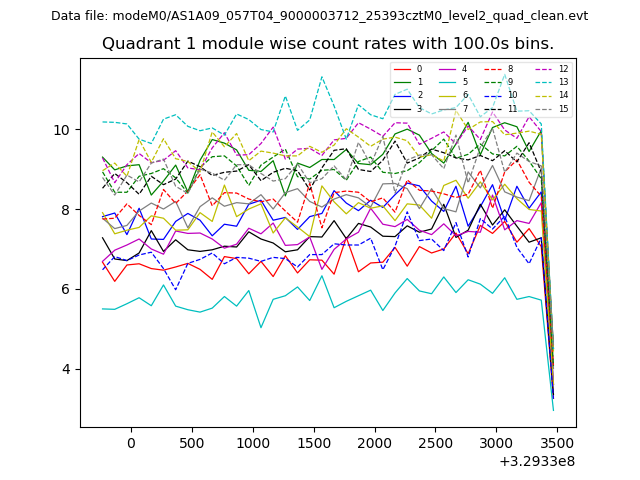
| Module-wise count rates for Quadrant A Data is divided into 100 sec bins |
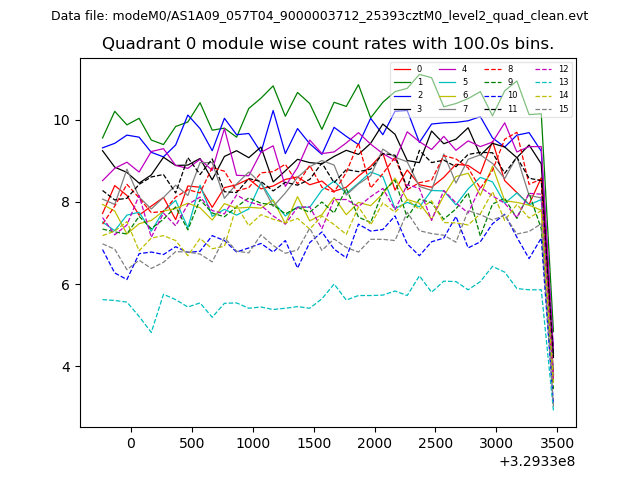 |
 |
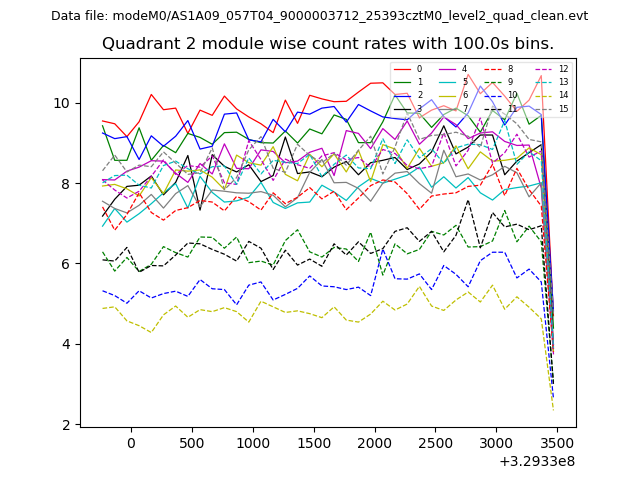
| Module-wise count rates for Quadrant B Data is divided into 100 sec bins |
 |
 |
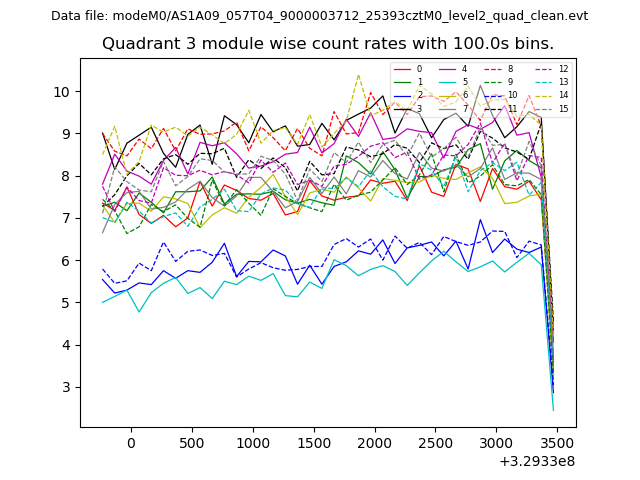
| Module-wise count rates for Quadrant C Data is divided into 100 sec bins |
 |
 |
| Module-wise count rates for Quadrant D Data is divided into 100 sec bins |
 |
 |
| Parameter | Plot |
|---|---|
| CZT HV Monitor | 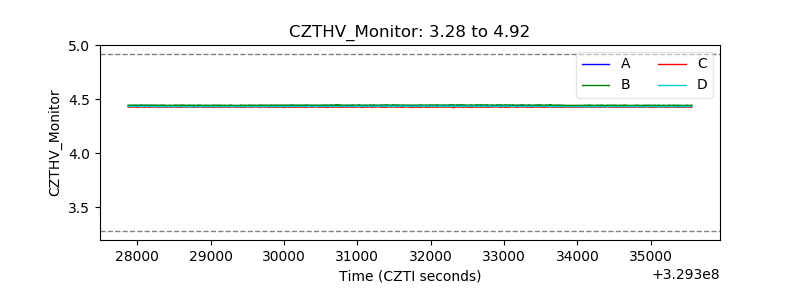 |
| D_VDD | 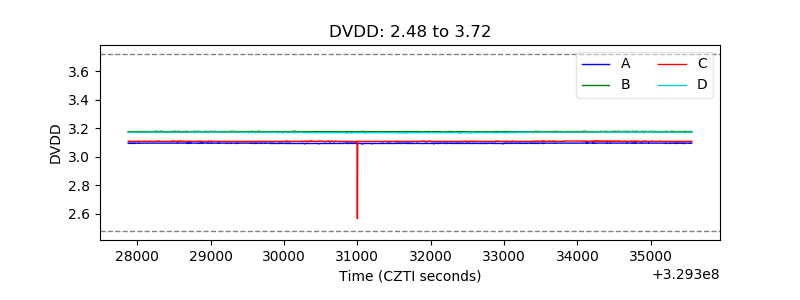 |
| Temperature 1 | 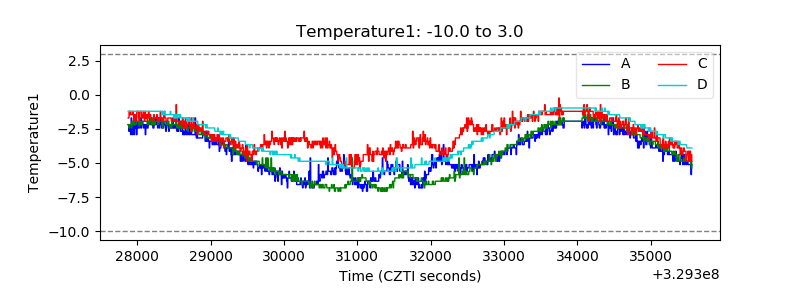 |
| Veto HV Monitor | 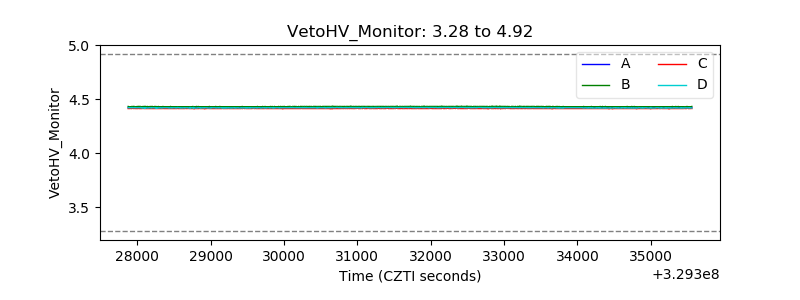 |
| Veto LLD | 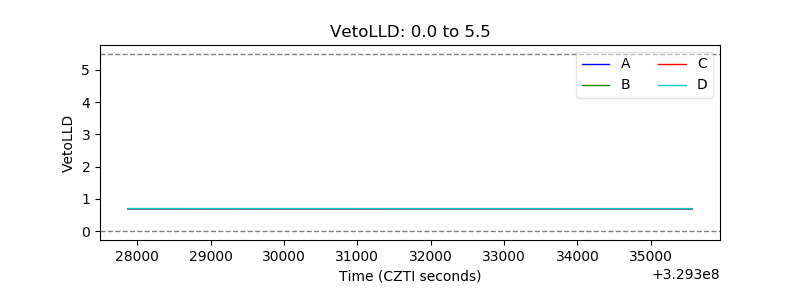 |
| Alpha Counter |  |
| _CPM_Rate |  |
| CZT Counter | 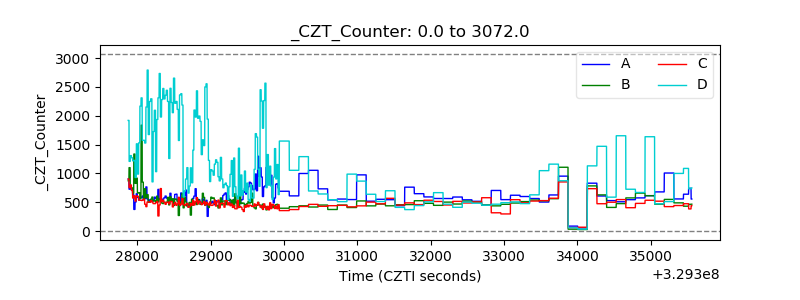 |
| +2.5 Volts monitor |  |
| +5 Volts monitor |  |
| _ROLL_ROT | 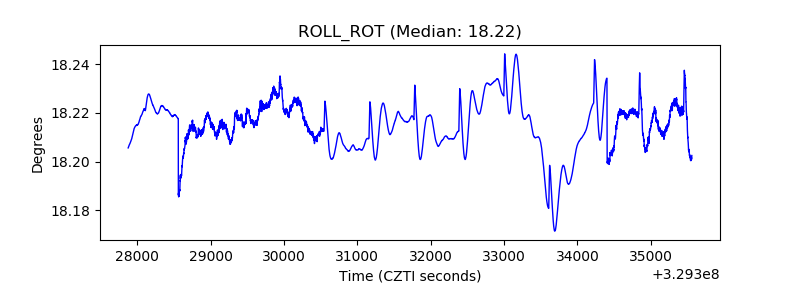 |
| _Roll_DEC | 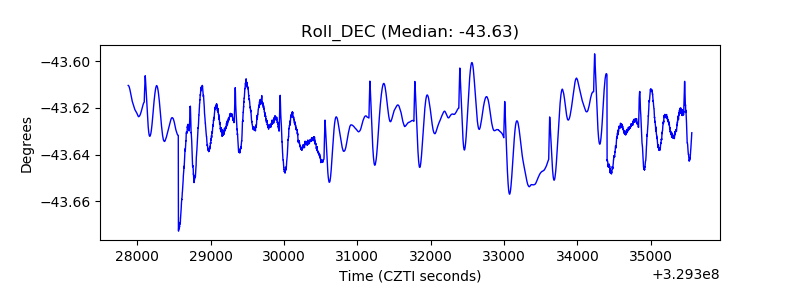 |
| _Roll_RA | 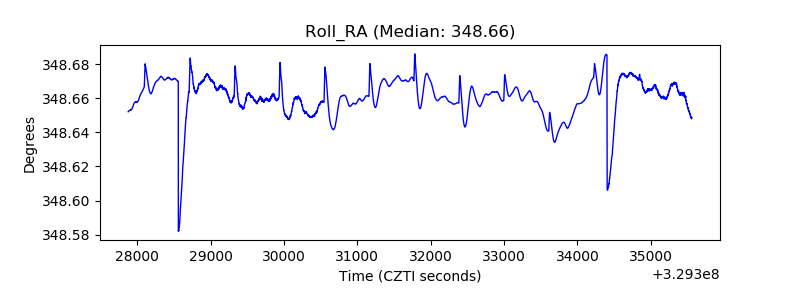 |
| Veto Counter | 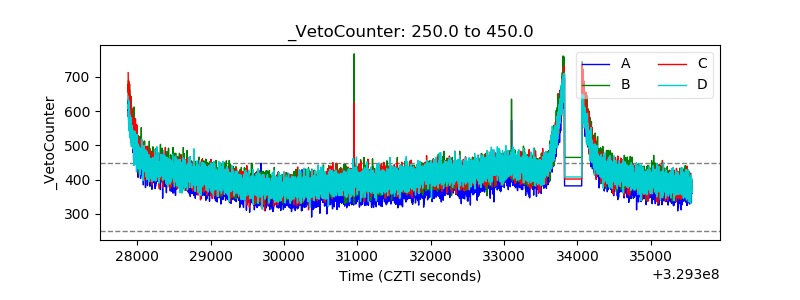 |