| Param | Original file | Final file |
|---|---|---|
| Filename | modeM0/AS1A09_057T04_9000003712_25397cztM0_level2.evt | modeM0/AS1A09_057T04_9000003712_25397cztM0_level2_quad_clean.evt |
| Size (bytes) | 1,208,545,920 | 214,571,520 |
| Size | 1.1 GB | 204.6 MB |
| Events in quadrant A | 7,303,161 | 1,401,227 |
| Events in quadrant B | 7,132,951 | 1,411,326 |
| Events in quadrant C | 7,127,453 | 1,348,870 |
| Events in quadrant D | 14,018,784 | 1,296,575 |
| Mode M9 | |||
|---|---|---|---|
| Quadrant | BADHDUFLAG | Total packets | Discarded packets |
| A | 0 | 11 | 0 |
| B | 0 | 11 | 0 |
| C | 0 | 11 | 0 |
| D | 0 | 11 | 0 |
| Mode M0 | |||
|---|---|---|---|
| Quadrant | BADHDUFLAG | Total packets | Discarded packets |
| A | 0 | 31263 | 0 |
| B | 0 | 31024 | 0 |
| C | 0 | 30727 | 0 |
| D | 0 | 52006 | 0 |
| Quadrant | Total seconds | Saturated seconds | Saturation percentage |
|---|---|---|---|
| A | 15092 | 57 | 0.377684% |
| B | 15092 | 90 | 0.596342% |
| C | 15092 | 133 | 0.881262% |
| D | 15092 | 1452 | 9.620991% |
Noise dominated data is calculated using 1-second bins in cleaned event files. If a bin has >2000 counts, and if more than 50% of those come from <1% of pixels, then it is considered to be noise-dominated and hence unusable.
| Quadrant | # 1 sec bins | Bins with >0 counts | Bins with >2000 counts | High rate bins dominated by noise | Noise dominated (total time) | Noise dominated (detector-on time) | Marked lightcurve |
|---|---|---|---|---|---|---|---|
| A | 16152 | 15093 | 0 | 0 | 0.00% | 0.00% | 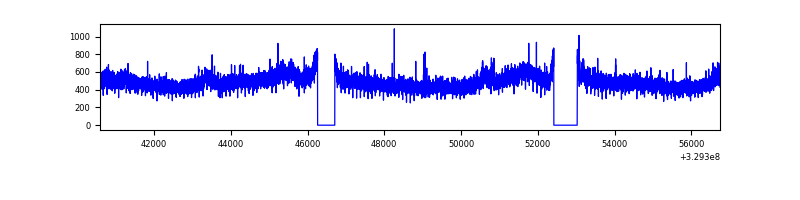 |
| B | 16152 | 15092 | 2 | 2 | 0.01% | 0.01% | 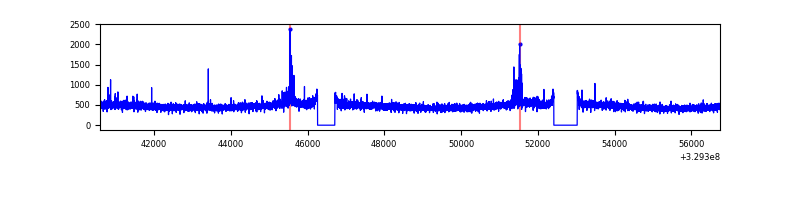 |
| C | 16152 | 15092 | 1 | 1 | 0.01% | 0.01% | 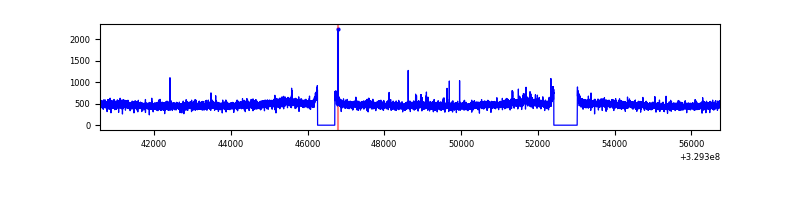 |
| D | 16152 | 15093 | 1247 | 1247 | 7.72% | 8.26% | 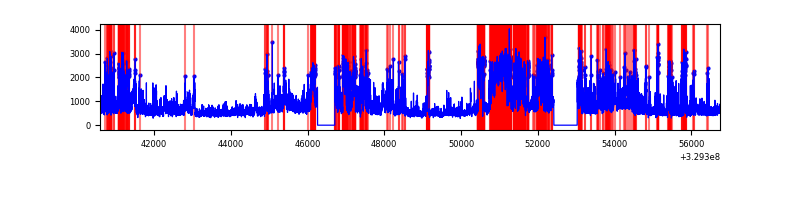 |
Top three noisy pixels from each quadrant. If the there are fewer than three noisy pixels in the level2.evt file, extra rows are filled as -1
| Pixel properties | Quadrant properties | ||||||
|---|---|---|---|---|---|---|---|
| Quadrant | DetID | PixID | Counts | Sigma | Mean | Median | Sigma |
| A | 6 | 16 | 290979 | 798.5 | 1803 | 1762 | 362.2 |
| A | 15 | 173 | 59226 | 158.65 | 1803 | 1762 | 362.2 |
| A | 13 | 254 | 22699 | 57.81 | 1803 | 1762 | 362.2 |
| B | 0 | 190 | 75583 | 218.22 | 1785 | 1740 | 338.4 |
| B | 12 | 111 | 42458 | 120.33 | 1785 | 1740 | 338.4 |
| B | 11 | 111 | 38336 | 108.15 | 1785 | 1740 | 338.4 |
| C | 14 | 238 | 274616 | 672.69 | 1736 | 1748 | 405.6 |
| C | 7 | 247 | 44452 | 105.28 | 1736 | 1748 | 405.6 |
| C | 3 | 233 | 22911 | 52.17 | 1736 | 1748 | 405.6 |
| D | 1 | 52 | 4235182 | 10274.07 | 1706 | 1654 | 412.1 |
| D | 8 | 195 | 1524347 | 3695.32 | 1706 | 1654 | 412.1 |
| D | 7 | 238 | 1358434 | 3292.68 | 1706 | 1654 | 412.1 |
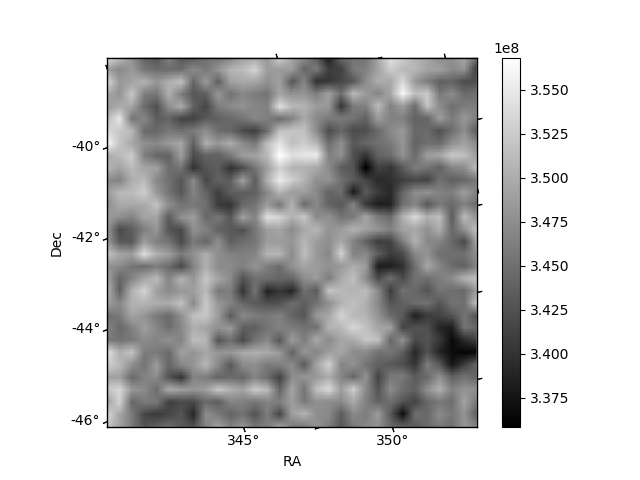
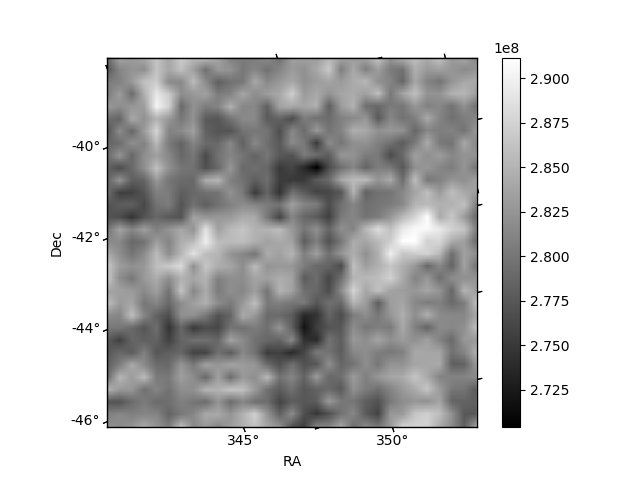
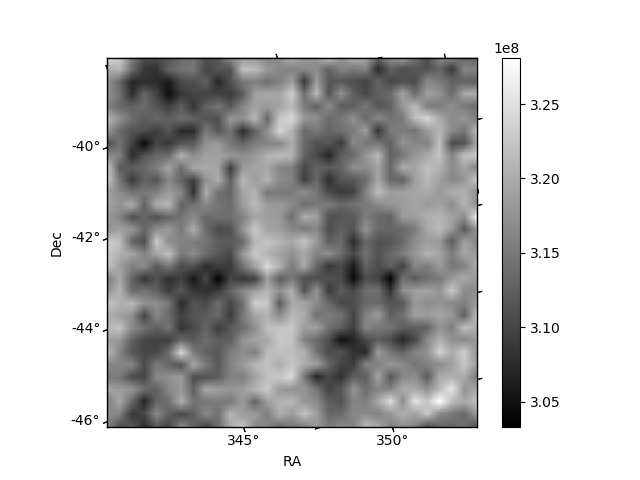
Histogram calculated using DETX and DETY for each event in the final _common_clean file
| Quadrant A |  |
 |
Quadrant B |
|---|---|---|---|
| Quadrant D |  |
 |
Quadrant C |
| Plot type | Count rate plots | Images |
|---|---|---|
| Comparison with Poisson distribution Blue bars denote a histogram of data divided into 1 sec bins. Red curve is a Poisson curve with rate = median count rate of data. |
 |
 |
| Quadrant-wise count rates Data is divided into 100 sec bins |
 |
|
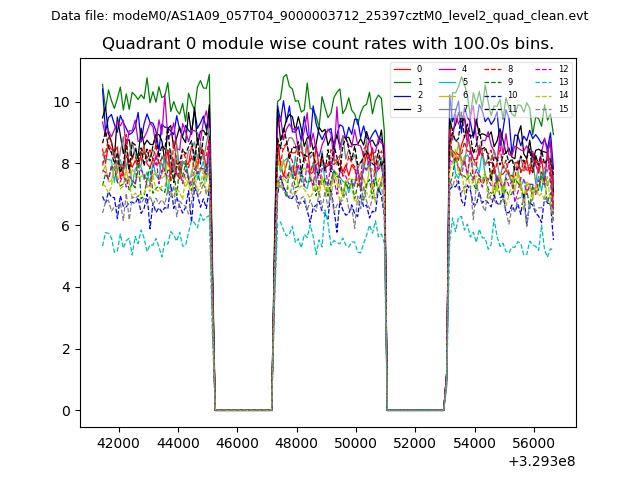
| Module-wise count rates for Quadrant A Data is divided into 100 sec bins |
 |
 |
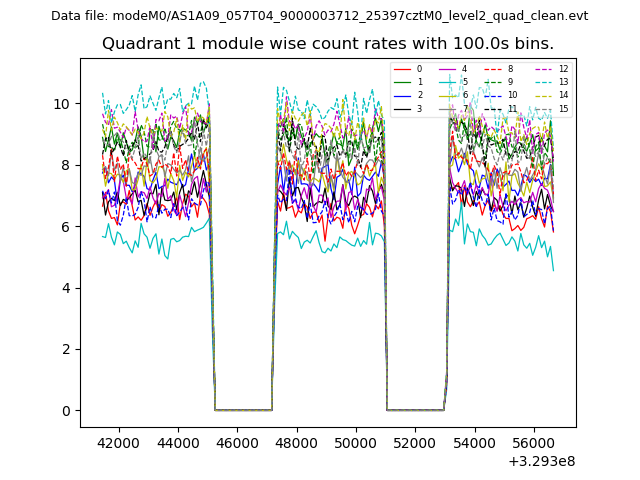
| Module-wise count rates for Quadrant B Data is divided into 100 sec bins |
 |
 |
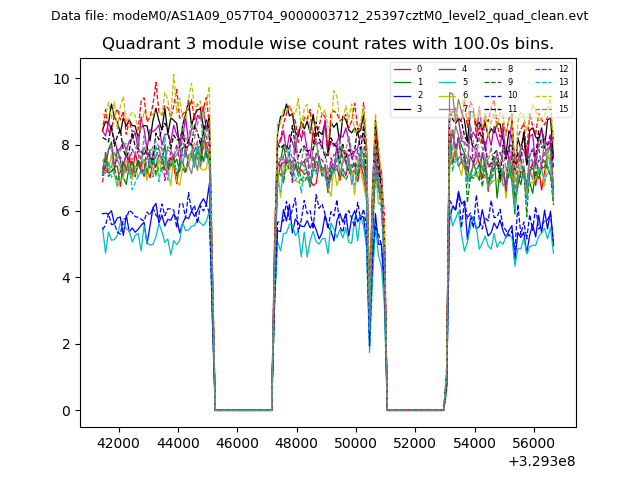
| Module-wise count rates for Quadrant C Data is divided into 100 sec bins |
 |
 |
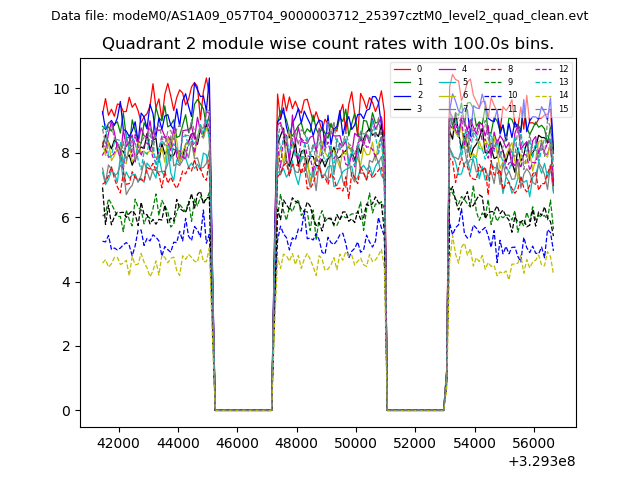
| Module-wise count rates for Quadrant D Data is divided into 100 sec bins |
 |
 |
| Parameter | Plot |
|---|---|
| CZT HV Monitor | 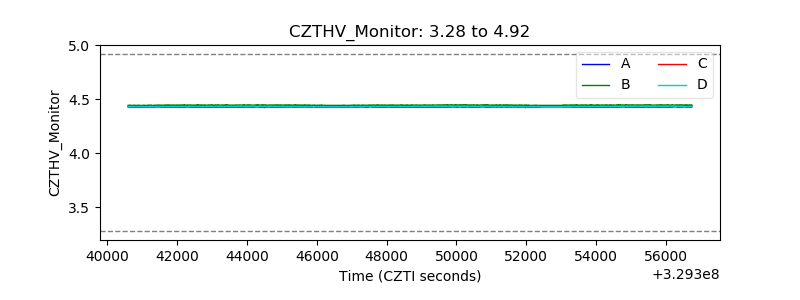 |
| D_VDD | 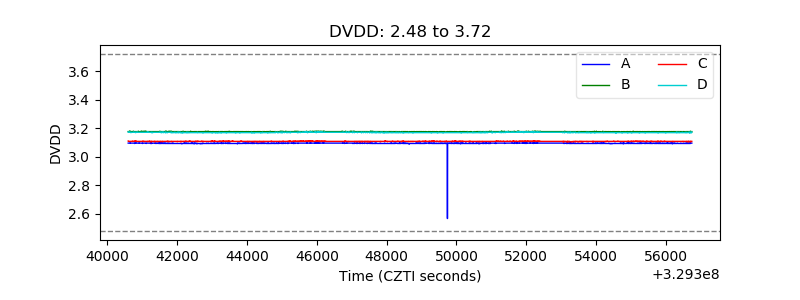 |
| Temperature 1 | 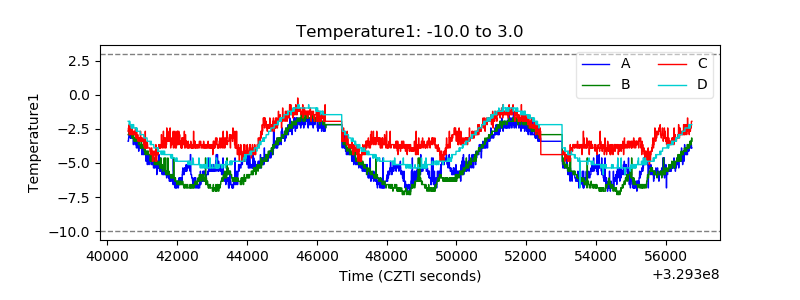 |
| Veto HV Monitor |  |
| Veto LLD | 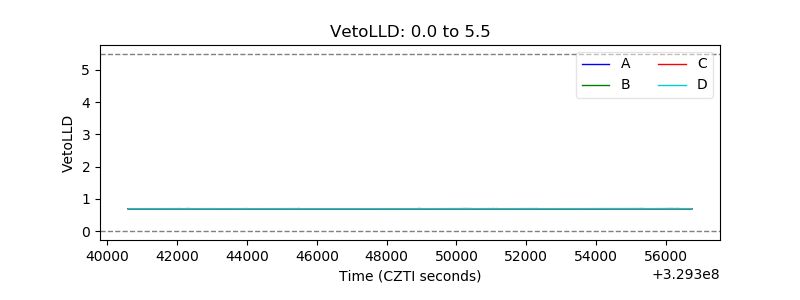 |
| Alpha Counter | 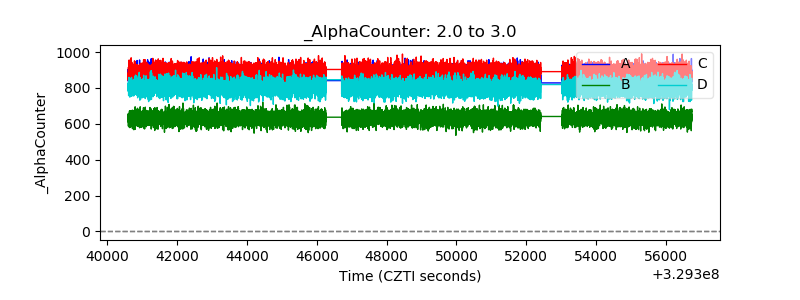 |
| _CPM_Rate |  |
| CZT Counter | 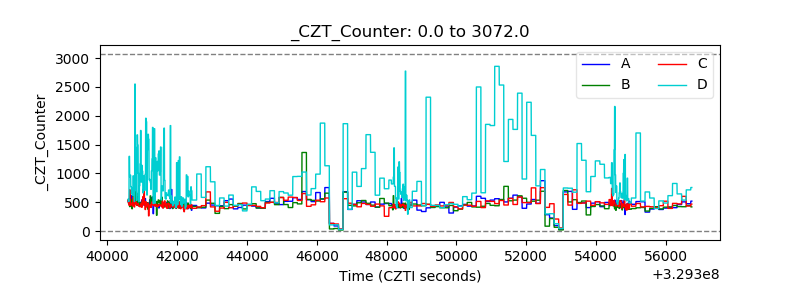 |
| +2.5 Volts monitor | 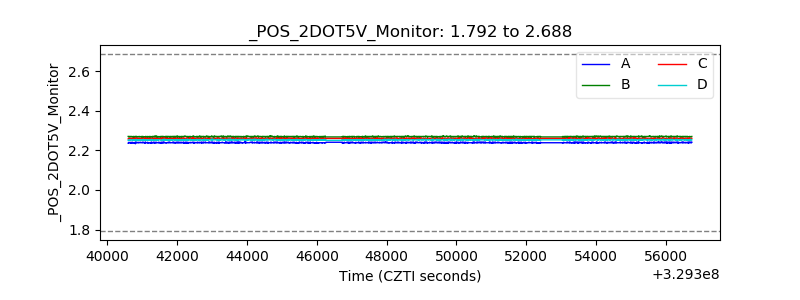 |
| +5 Volts monitor |  |
| _ROLL_ROT | 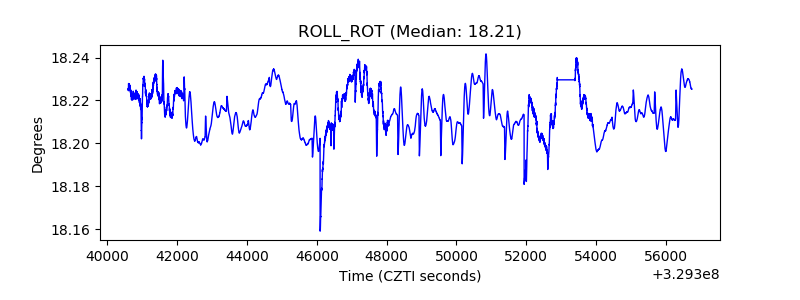 |
| _Roll_DEC | 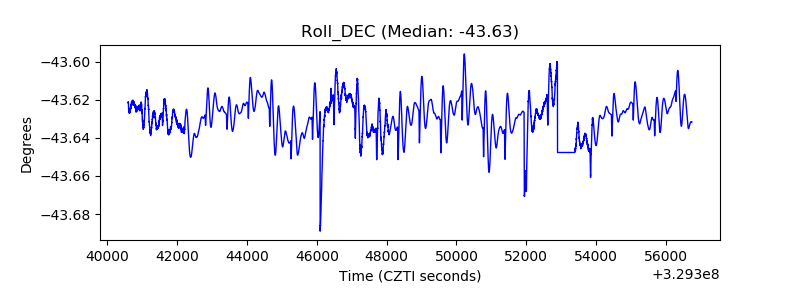 |
| _Roll_RA | 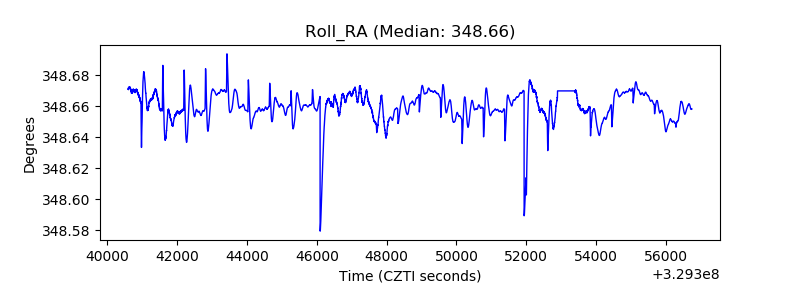 |
| Veto Counter | 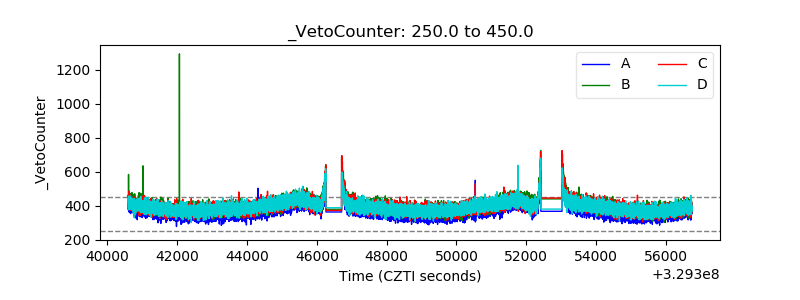 |