| Param | Original file | Final file |
|---|---|---|
| Filename | modeM0/AS1A09_057T04_9000003712_25398cztM0_level2.evt | modeM0/AS1A09_057T04_9000003712_25398cztM0_level2_quad_clean.evt |
| Size (bytes) | 681,125,760 | 109,457,280 |
| Size | 649.6 MB | 104.4 MB |
| Events in quadrant A | 4,538,428 | 687,961 |
| Events in quadrant B | 4,390,210 | 697,634 |
| Events in quadrant C | 4,460,354 | 674,472 |
| Events in quadrant D | 6,644,657 | 645,166 |
| Mode M9 | |||
|---|---|---|---|
| Quadrant | BADHDUFLAG | Total packets | Discarded packets |
| A | 0 | 18 | 0 |
| B | 0 | 18 | 0 |
| C | 0 | 18 | 0 |
| D | 0 | 18 | 0 |
| Mode M0 | |||
|---|---|---|---|
| Quadrant | BADHDUFLAG | Total packets | Discarded packets |
| A | 0 | 18488 | 0 |
| B | 0 | 18415 | 0 |
| C | 0 | 18820 | 0 |
| D | 0 | 25762 | 0 |
| Quadrant | Total seconds | Saturated seconds | Saturation percentage |
|---|---|---|---|
| A | 8780 | 31 | 0.353075% |
| B | 8781 | 48 | 0.546635% |
| C | 8781 | 83 | 0.945223% |
| D | 8781 | 301 | 3.427856% |
Noise dominated data is calculated using 1-second bins in cleaned event files. If a bin has >2000 counts, and if more than 50% of those come from <1% of pixels, then it is considered to be noise-dominated and hence unusable.
| Quadrant | # 1 sec bins | Bins with >0 counts | Bins with >2000 counts | High rate bins dominated by noise | Noise dominated (total time) | Noise dominated (detector-on time) | Marked lightcurve |
|---|---|---|---|---|---|---|---|
| A | 10585 | 8782 | 0 | 0 | 0.00% | 0.00% | 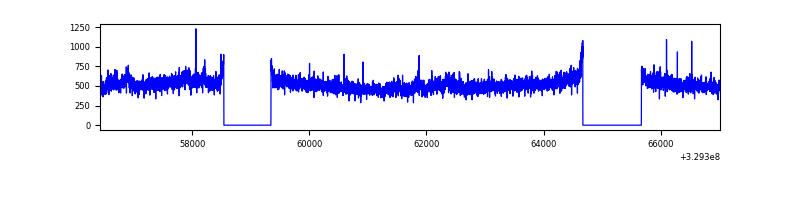 |
| B | 10586 | 8782 | 2 | 2 | 0.02% | 0.02% | 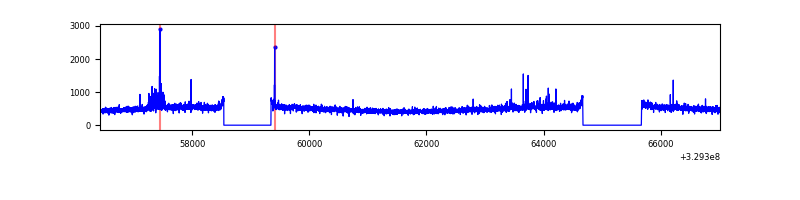 |
| C | 10586 | 8782 | 0 | 0 | 0.00% | 0.00% | 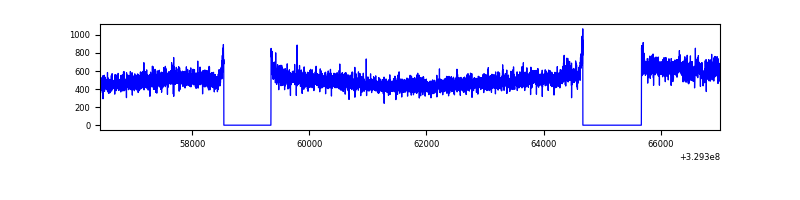 |
| D | 10586 | 8781 | 224 | 224 | 2.12% | 2.55% | 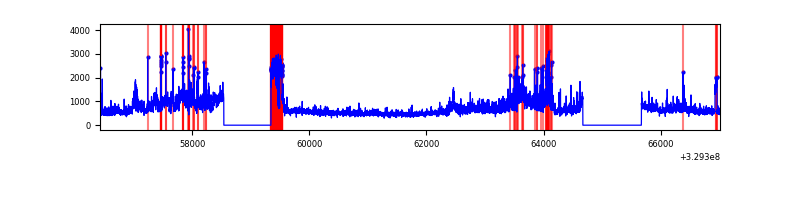 |
Top three noisy pixels from each quadrant. If the there are fewer than three noisy pixels in the level2.evt file, extra rows are filled as -1
| Pixel properties | Quadrant properties | ||||||
|---|---|---|---|---|---|---|---|
| Quadrant | DetID | PixID | Counts | Sigma | Mean | Median | Sigma |
| A | 6 | 16 | 273541 | 1241.78 | 1095 | 1070 | 219.4 |
| A | 15 | 173 | 39159 | 173.59 | 1095 | 1070 | 219.4 |
| A | 13 | 254 | 13080 | 54.74 | 1095 | 1070 | 219.4 |
| B | 0 | 190 | 68440 | 323.54 | 1087 | 1056 | 208.3 |
| B | 12 | 111 | 25767 | 118.65 | 1087 | 1056 | 208.3 |
| B | 0 | 229 | 23501 | 107.77 | 1087 | 1056 | 208.3 |
| C | 14 | 238 | 168514 | 674.45 | 1055 | 1059 | 248.3 |
| C | 7 | 87 | 141478 | 565.56 | 1055 | 1059 | 248.3 |
| C | 7 | 247 | 25209 | 97.27 | 1055 | 1059 | 248.3 |
| D | 1 | 52 | 1338135 | 5229.46 | 1052 | 1024 | 255.7 |
| D | 8 | 195 | 704364 | 2750.77 | 1052 | 1024 | 255.7 |
| D | 7 | 238 | 495156 | 1932.56 | 1052 | 1024 | 255.7 |
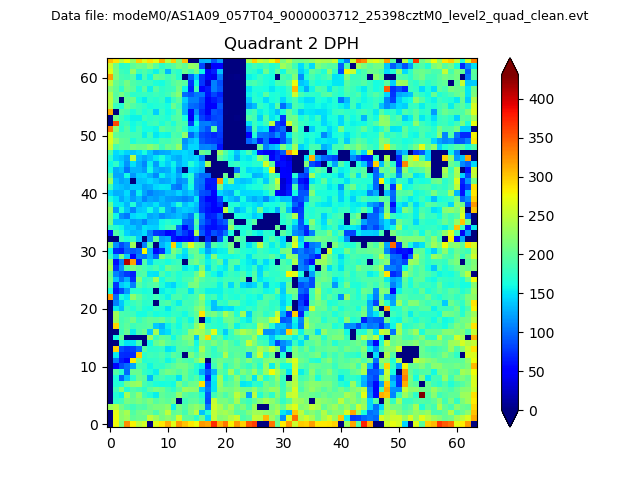
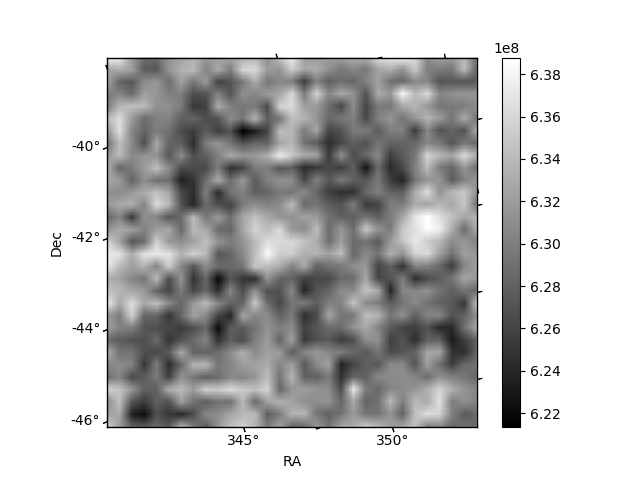
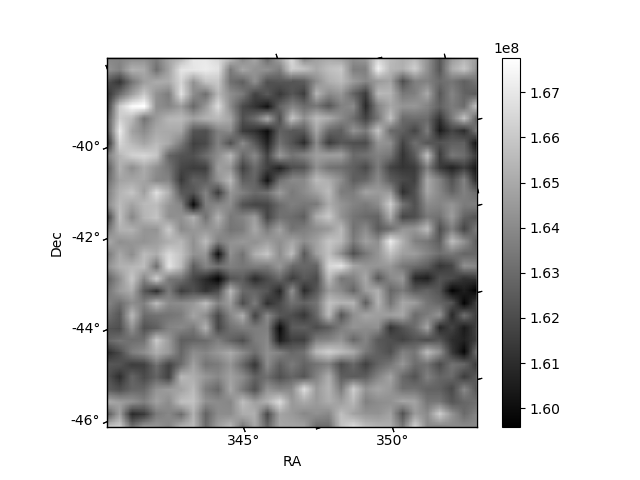
Histogram calculated using DETX and DETY for each event in the final _common_clean file
| Quadrant A | 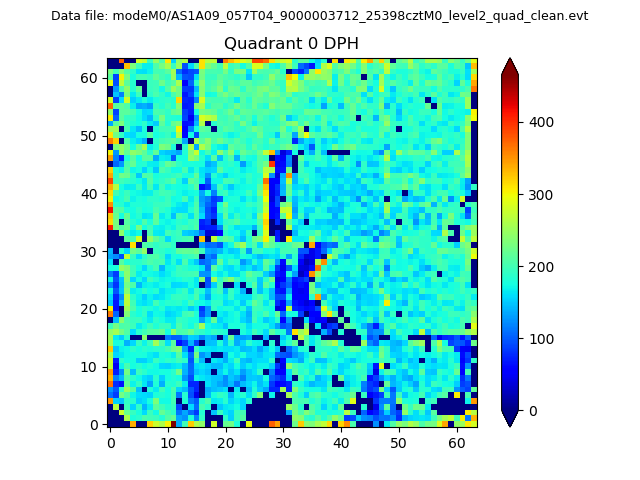 |
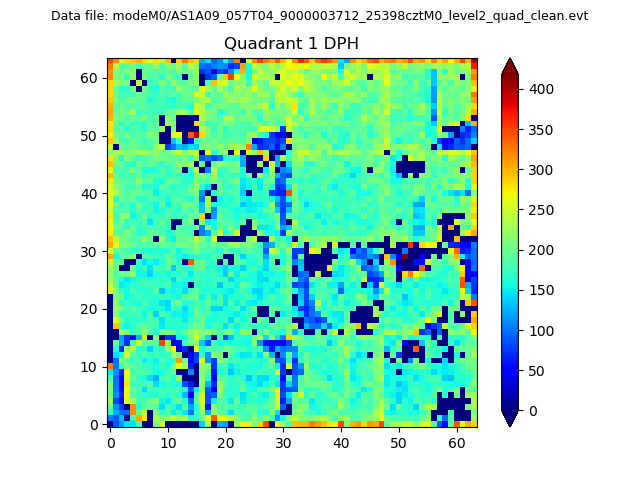 |
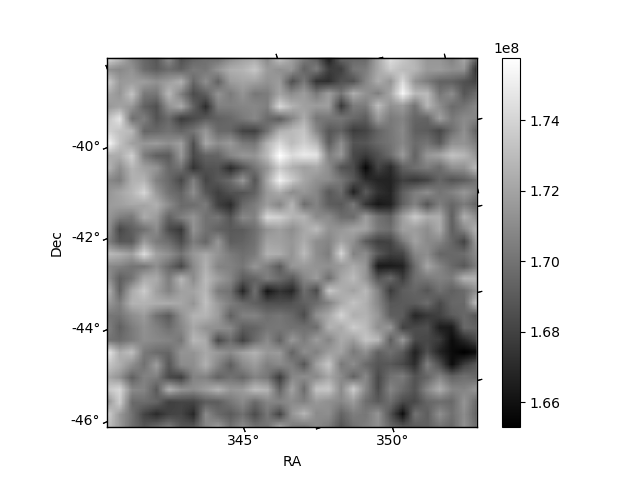
Quadrant B |
|---|---|---|---|
| Quadrant D | 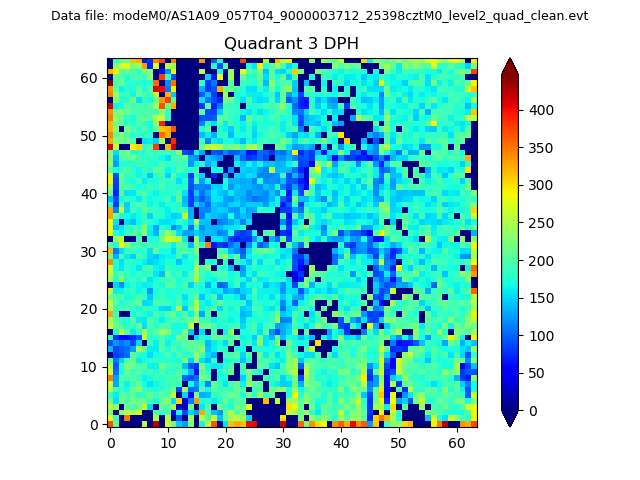 |
 |
Quadrant C |
| Plot type | Count rate plots | Images |
|---|---|---|
| Comparison with Poisson distribution Blue bars denote a histogram of data divided into 1 sec bins. Red curve is a Poisson curve with rate = median count rate of data. |
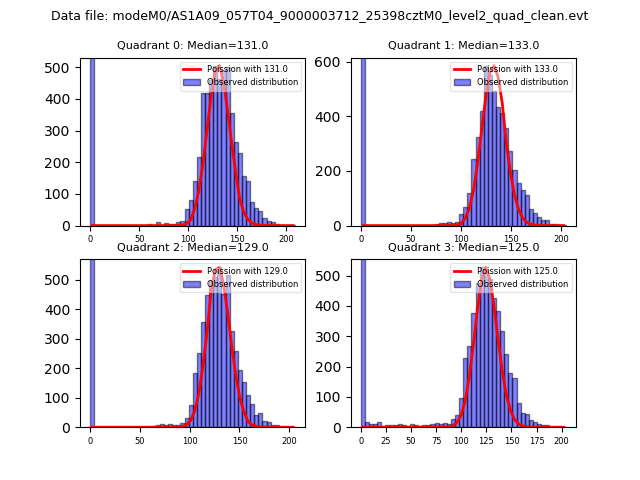 |
 |
| Quadrant-wise count rates Data is divided into 100 sec bins |
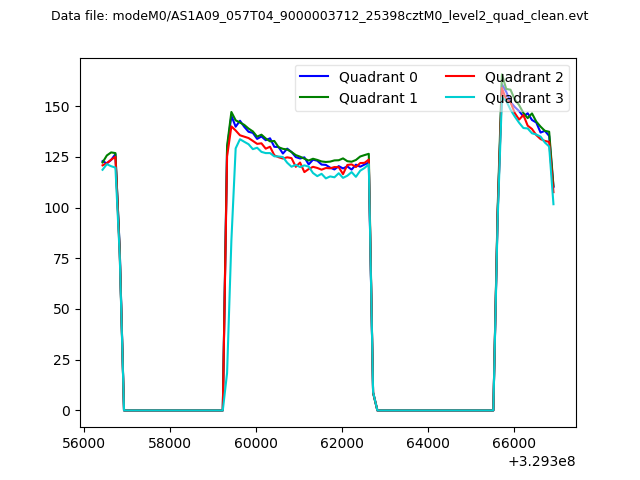 |
|
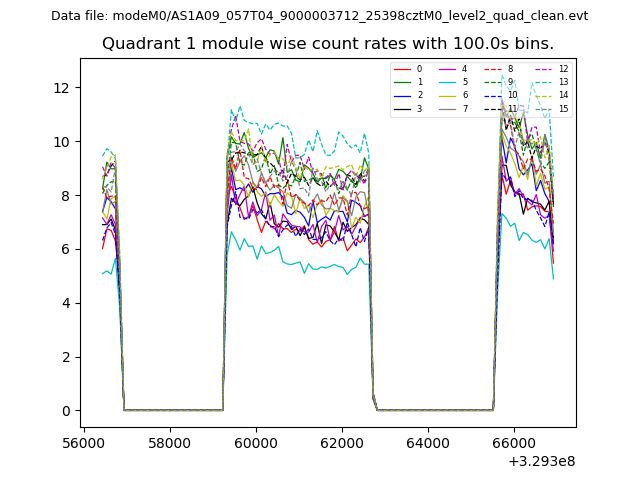
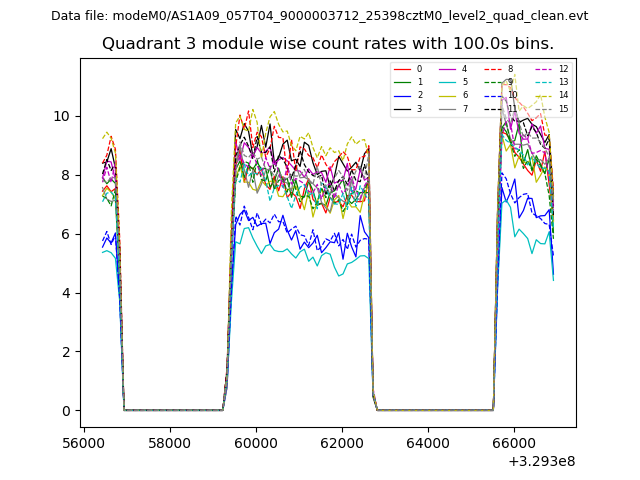
| Module-wise count rates for Quadrant A Data is divided into 100 sec bins |
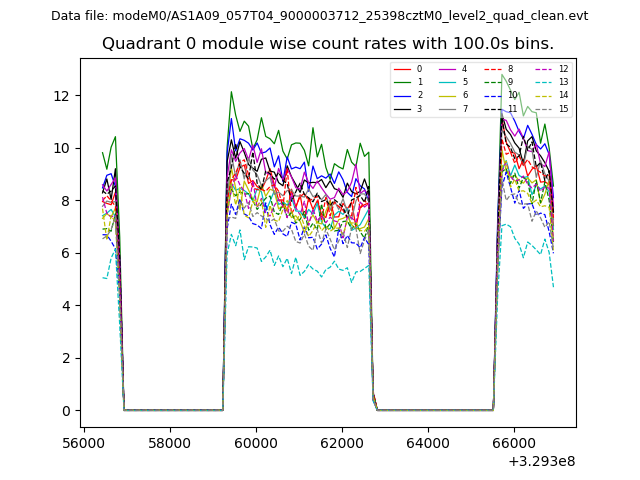 |
 |
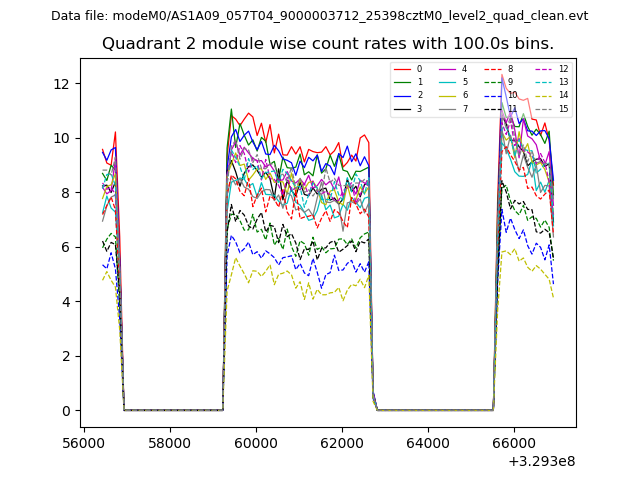
| Module-wise count rates for Quadrant B Data is divided into 100 sec bins |
 |
 |
| Module-wise count rates for Quadrant C Data is divided into 100 sec bins |
 |
 |
| Module-wise count rates for Quadrant D Data is divided into 100 sec bins |
 |
 |
| Parameter | Plot |
|---|---|
| CZT HV Monitor | 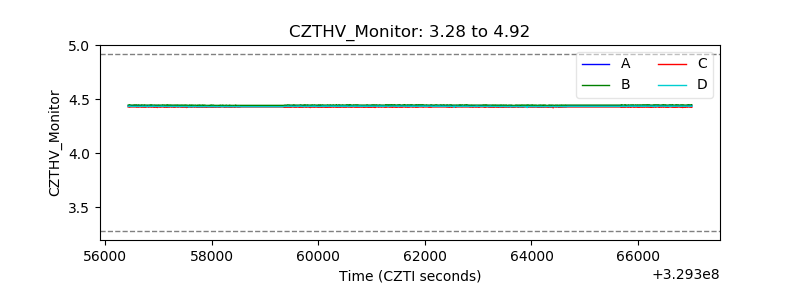 |
| D_VDD | 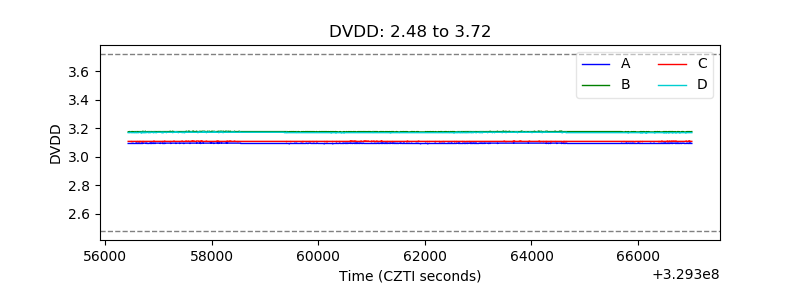 |
| Temperature 1 | 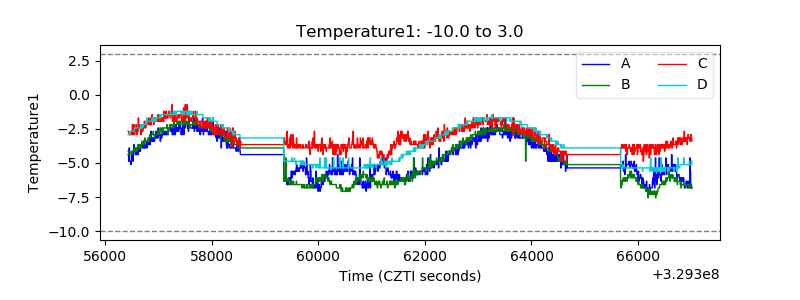 |
| Veto HV Monitor | 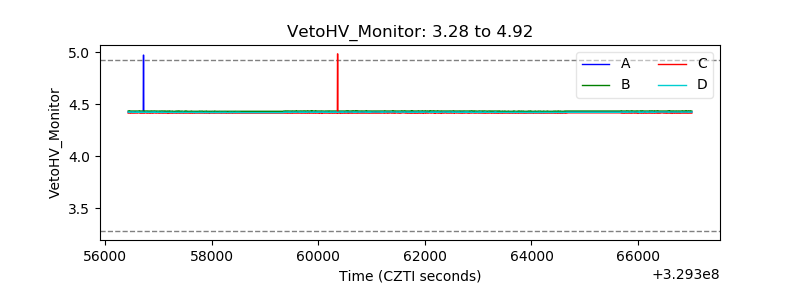 |
| Veto LLD | 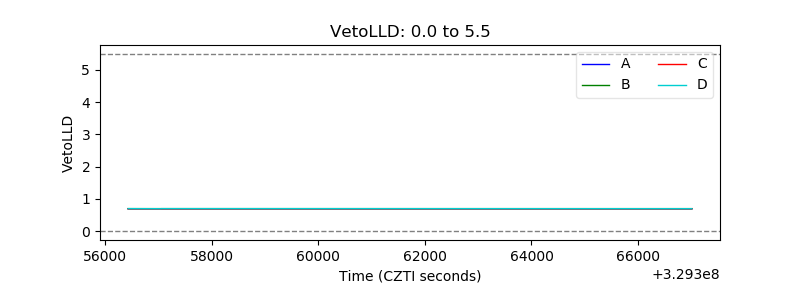 |
| Alpha Counter | 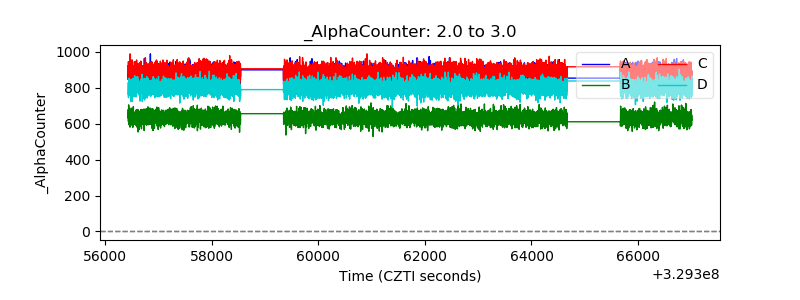 |
| _CPM_Rate | 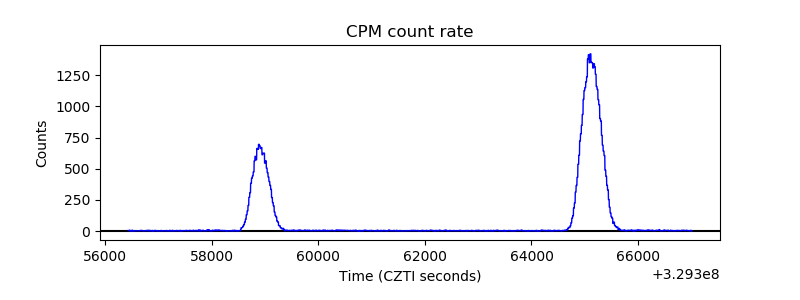 |
| CZT Counter | 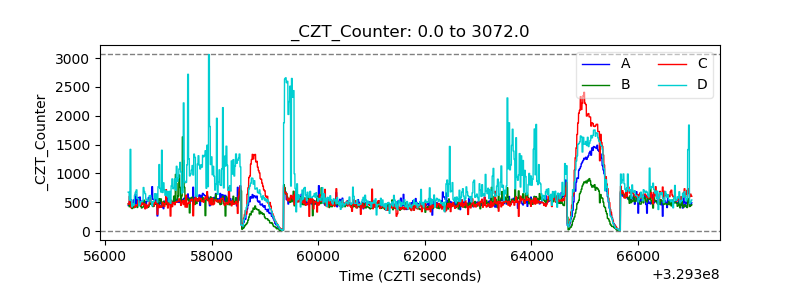 |
| +2.5 Volts monitor |  |
| +5 Volts monitor |  |
| _ROLL_ROT | 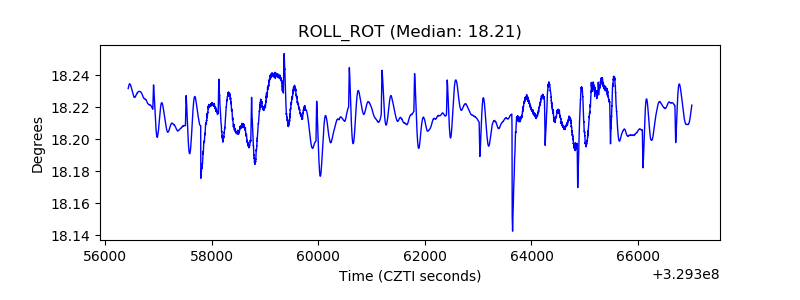 |
| _Roll_DEC | 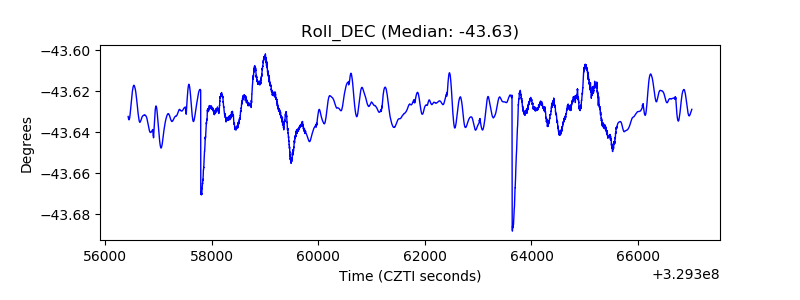 |
| _Roll_RA | 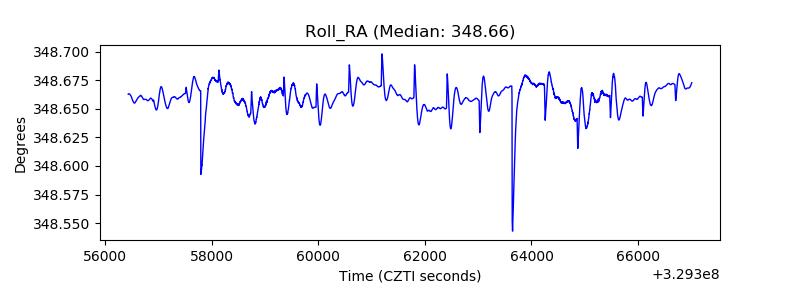 |
| Veto Counter | 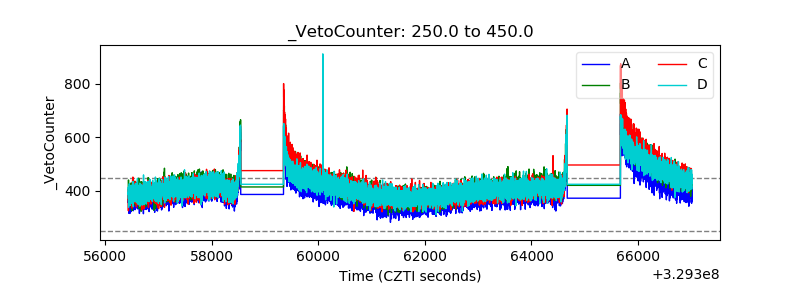 |