| Param | Original file | Final file |
|---|---|---|
| Filename | modeM0/AS1A09_057T04_9000003712_25400cztM0_level2.evt | modeM0/AS1A09_057T04_9000003712_25400cztM0_level2_quad_clean.evt |
| Size (bytes) | 491,400,000 | 97,292,160 |
| Size | 468.6 MB | 92.8 MB |
| Events in quadrant A | 3,267,045 | 629,070 |
| Events in quadrant B | 3,308,344 | 639,484 |
| Events in quadrant C | 3,611,997 | 618,239 |
| Events in quadrant D | 4,255,911 | 608,397 |
| Mode M9 | |||
|---|---|---|---|
| Quadrant | BADHDUFLAG | Total packets | Discarded packets |
| A | 0 | 15 | 0 |
| B | 0 | 16 | 0 |
| C | 0 | 16 | 0 |
| D | 0 | 16 | 0 |
| Mode M0 | |||
|---|---|---|---|
| Quadrant | BADHDUFLAG | Total packets | Discarded packets |
| A | 0 | 13536 | 0 |
| B | 0 | 13791 | 0 |
| C | 0 | 14836 | 0 |
| D | 0 | 17327 | 0 |
| Quadrant | Total seconds | Saturated seconds | Saturation percentage |
|---|---|---|---|
| A | 6468 | 18 | 0.278293% |
| B | 6468 | 34 | 0.525665% |
| C | 6467 | 69 | 1.066955% |
| D | 6467 | 37 | 0.572135% |
Noise dominated data is calculated using 1-second bins in cleaned event files. If a bin has >2000 counts, and if more than 50% of those come from <1% of pixels, then it is considered to be noise-dominated and hence unusable.
| Quadrant | # 1 sec bins | Bins with >0 counts | Bins with >2000 counts | High rate bins dominated by noise | Noise dominated (total time) | Noise dominated (detector-on time) | Marked lightcurve |
|---|---|---|---|---|---|---|---|
| A | 7583 | 6469 | 0 | 0 | 0.00% | 0.00% | 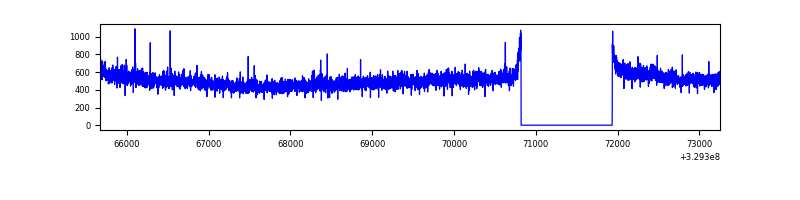 |
| B | 7583 | 6468 | 0 | 0 | 0.00% | 0.00% | 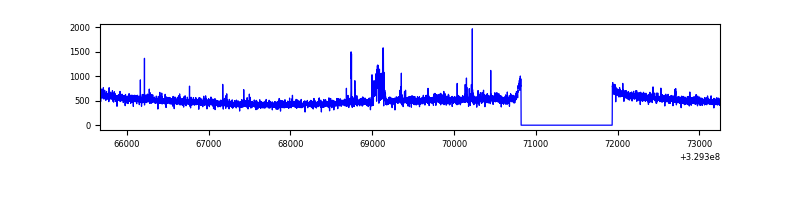 |
| C | 7582 | 6467 | 0 | 0 | 0.00% | 0.00% | 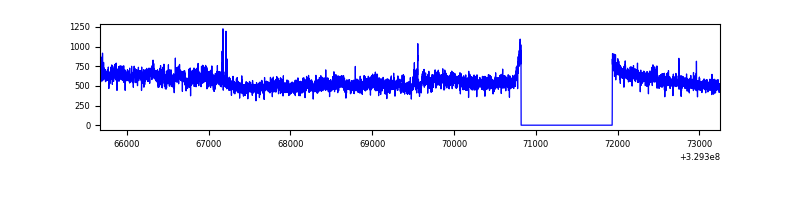 |
| D | 7582 | 6468 | 13 | 13 | 0.17% | 0.20% | 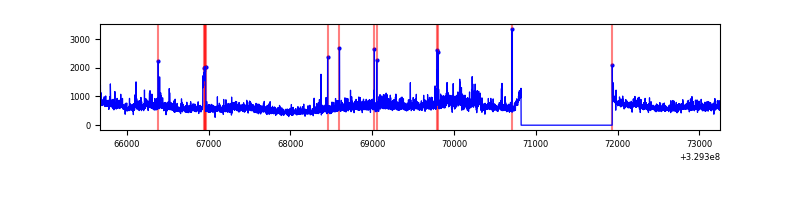 |
Top three noisy pixels from each quadrant. If the there are fewer than three noisy pixels in the level2.evt file, extra rows are filled as -1
| Pixel properties | Quadrant properties | ||||||
|---|---|---|---|---|---|---|---|
| Quadrant | DetID | PixID | Counts | Sigma | Mean | Median | Sigma |
| A | 6 | 16 | 69086 | 416.53 | 823 | 809 | 163.9 |
| A | 15 | 173 | 24737 | 145.97 | 823 | 809 | 163.9 |
| A | 13 | 254 | 8677 | 48.0 | 823 | 809 | 163.9 |
| B | 0 | 190 | 64098 | 410.13 | 816 | 795 | 154.3 |
| B | 0 | 229 | 32568 | 205.85 | 816 | 795 | 154.3 |
| B | 12 | 111 | 18716 | 116.11 | 816 | 795 | 154.3 |
| C | 7 | 87 | 328280 | 1743.42 | 803 | 808 | 187.8 |
| C | 14 | 238 | 129752 | 686.48 | 803 | 808 | 187.8 |
| C | 9 | 54 | 13178 | 65.85 | 803 | 808 | 187.8 |
| D | 1 | 52 | 674457 | 3446.23 | 813 | 791 | 195.5 |
| D | 8 | 195 | 469046 | 2395.42 | 813 | 791 | 195.5 |
| D | 7 | 238 | 31954 | 159.42 | 813 | 791 | 195.5 |
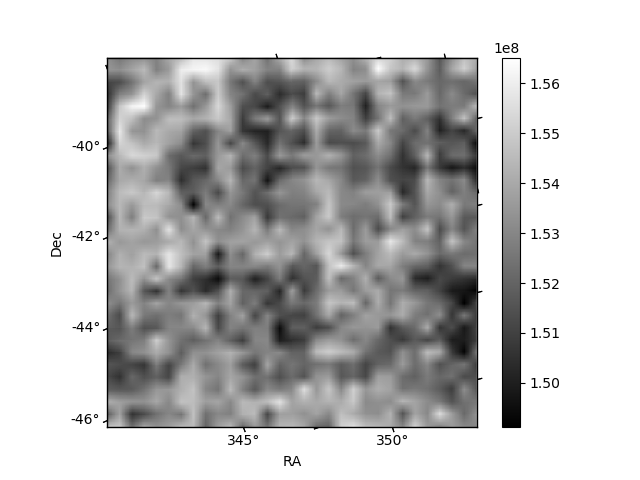
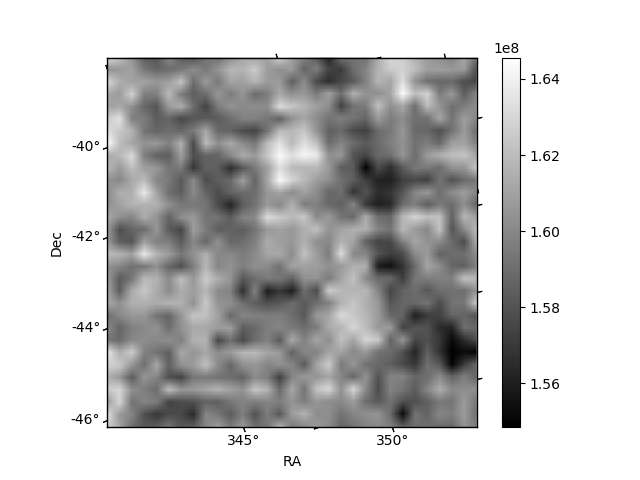
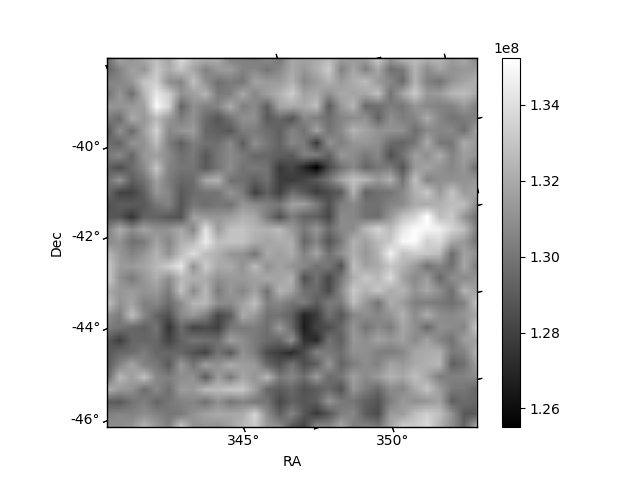
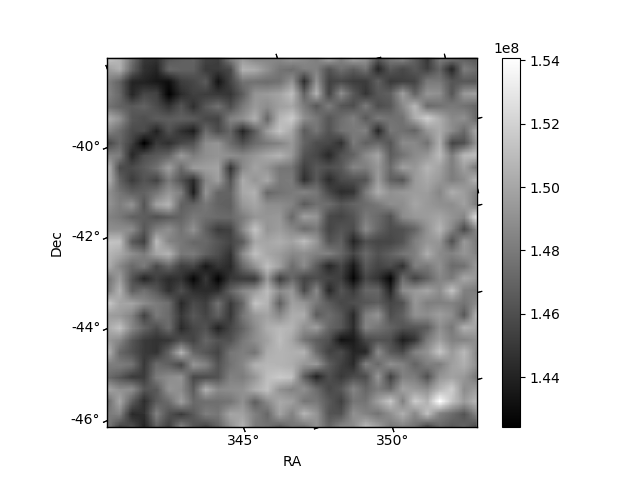
Histogram calculated using DETX and DETY for each event in the final _common_clean file
| Quadrant A | 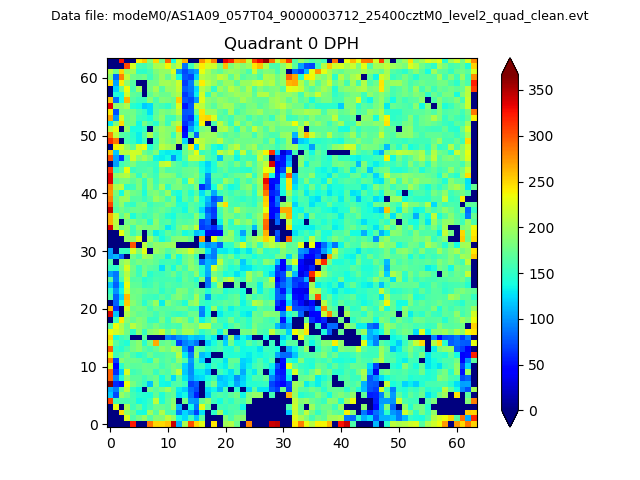 |
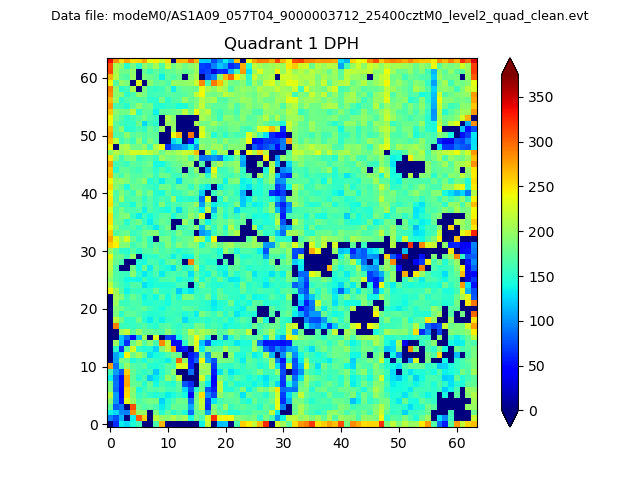 |
Quadrant B |
|---|---|---|---|
| Quadrant D | 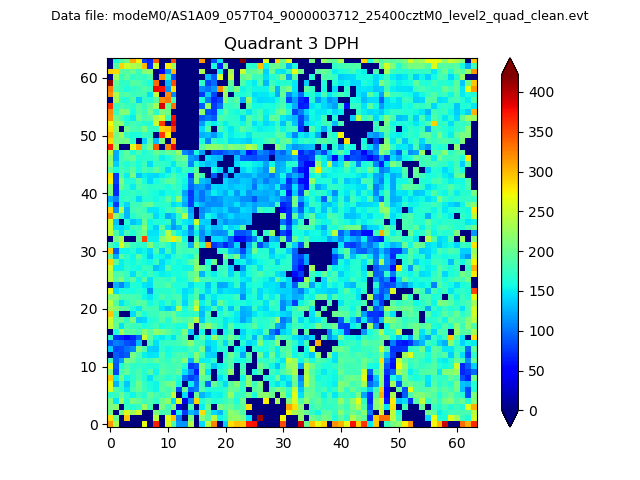 |
 |
Quadrant C |
| Plot type | Count rate plots | Images |
|---|---|---|
| Comparison with Poisson distribution Blue bars denote a histogram of data divided into 1 sec bins. Red curve is a Poisson curve with rate = median count rate of data. |
 |
 |
| Quadrant-wise count rates Data is divided into 100 sec bins |
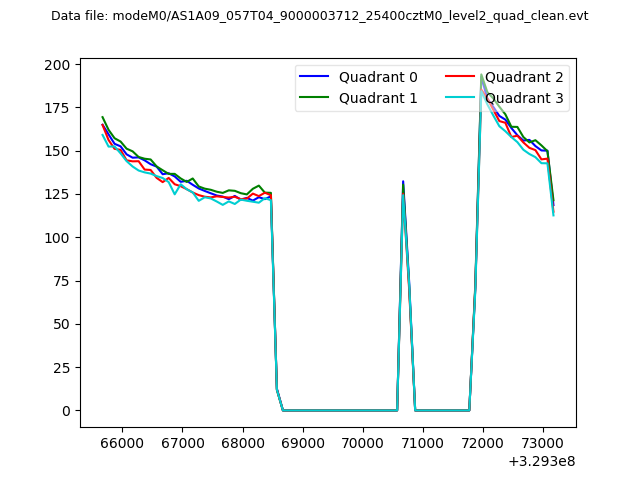 |
|
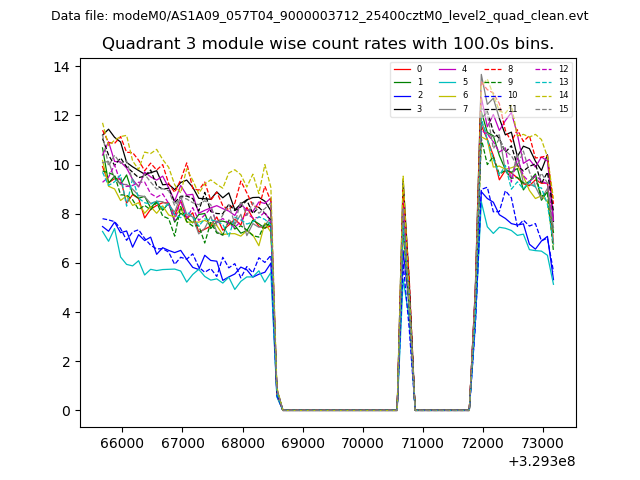
| Module-wise count rates for Quadrant A Data is divided into 100 sec bins |
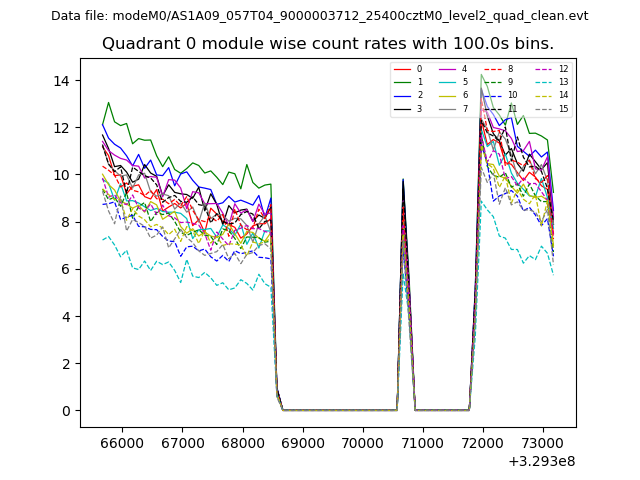 |
 |
| Module-wise count rates for Quadrant B Data is divided into 100 sec bins |
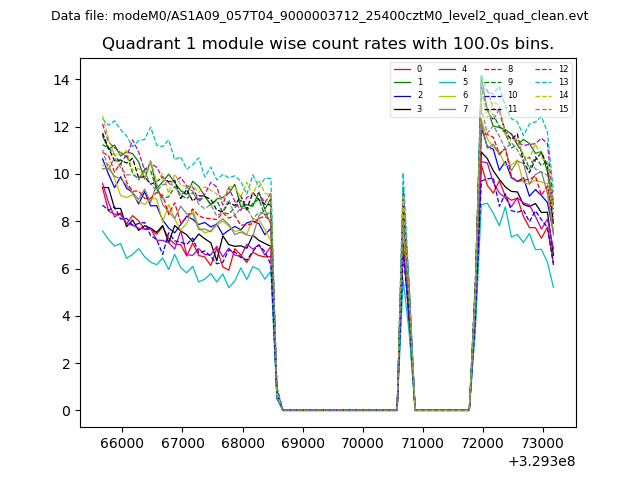 |
 |
| Module-wise count rates for Quadrant C Data is divided into 100 sec bins |
 |
 |
| Module-wise count rates for Quadrant D Data is divided into 100 sec bins |
 |
 |
| Parameter | Plot |
|---|---|
| CZT HV Monitor | 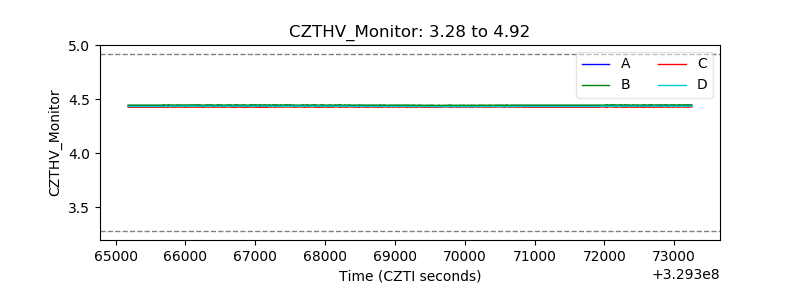 |
| D_VDD | 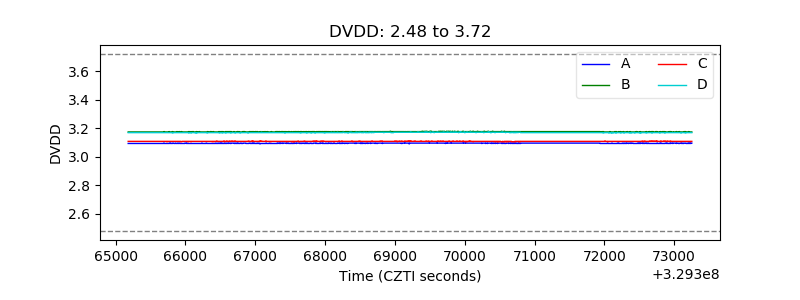 |
| Temperature 1 | 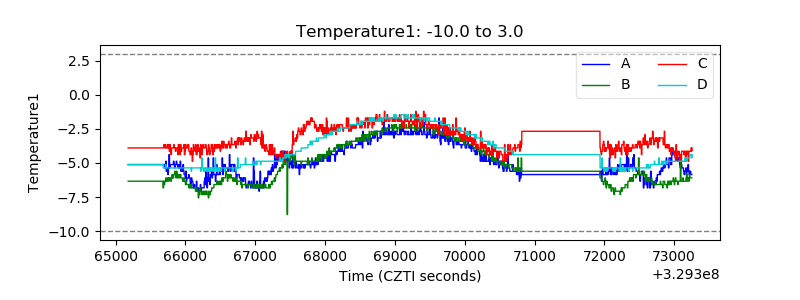 |
| Veto HV Monitor | 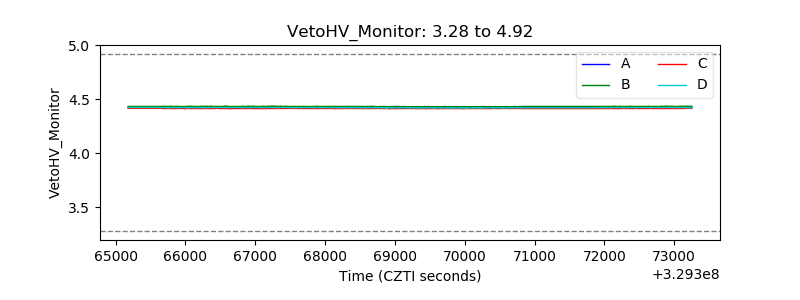 |
| Veto LLD | 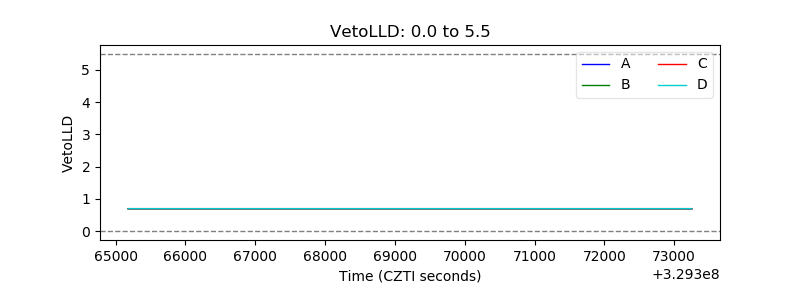 |
| Alpha Counter |  |
| _CPM_Rate | 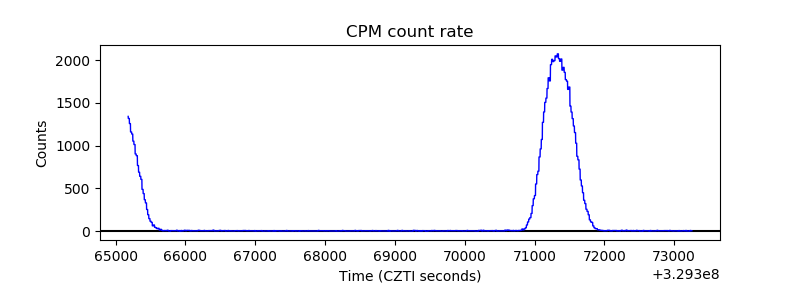 |
| CZT Counter |  |
| +2.5 Volts monitor |  |
| +5 Volts monitor |  |
| _ROLL_ROT | 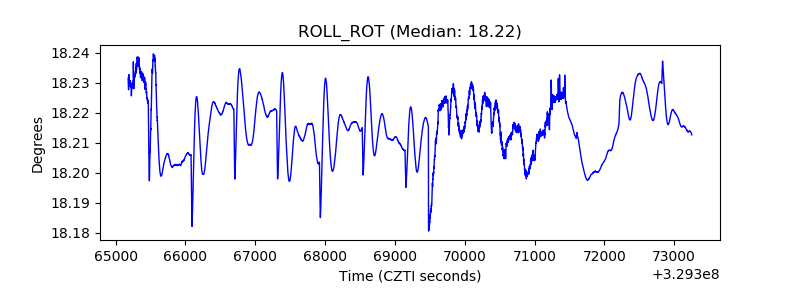 |
| _Roll_DEC | 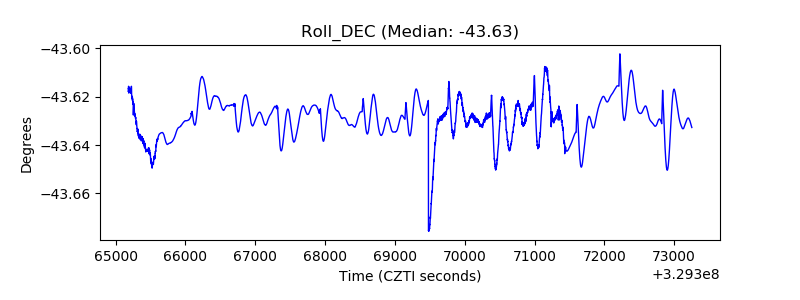 |
| _Roll_RA | 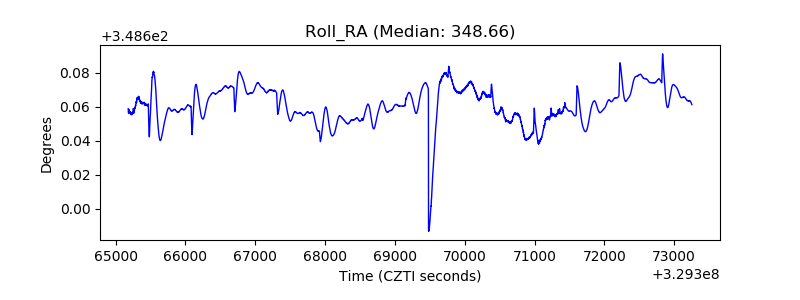 |
| Veto Counter | 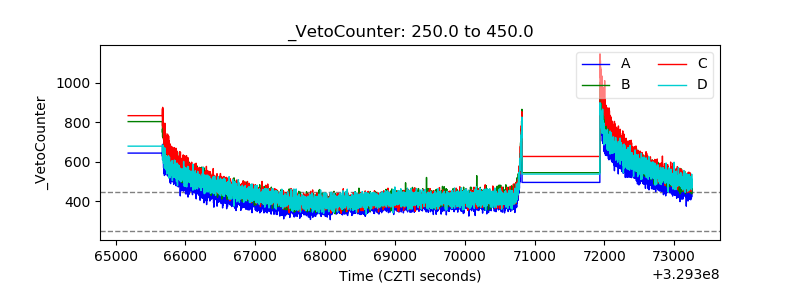 |