| Param | Original file | Final file |
|---|---|---|
| Filename | modeM0/AS1A09_057T04_9000003712_25402cztM0_level2.evt | modeM0/AS1A09_057T04_9000003712_25402cztM0_level2_quad_clean.evt |
| Size (bytes) | 499,538,880 | 100,604,160 |
| Size | 476.4 MB | 95.9 MB |
| Events in quadrant A | 3,387,643 | 668,526 |
| Events in quadrant B | 3,290,661 | 675,566 |
| Events in quadrant C | 3,324,076 | 639,213 |
| Events in quadrant D | 4,708,966 | 633,817 |
| Mode M9 | |||
|---|---|---|---|
| Quadrant | BADHDUFLAG | Total packets | Discarded packets |
| A | 0 | 13 | 0 |
| B | 0 | 13 | 0 |
| C | 0 | 13 | 0 |
| D | 0 | 13 | 0 |
| Mode M0 | |||
|---|---|---|---|
| Quadrant | BADHDUFLAG | Total packets | Discarded packets |
| A | 0 | 13623 | 0 |
| B | 0 | 13312 | 0 |
| C | 0 | 13470 | 0 |
| D | 0 | 18593 | 0 |
| Quadrant | Total seconds | Saturated seconds | Saturation percentage |
|---|---|---|---|
| A | 6152 | 56 | 0.910273% |
| B | 6152 | 61 | 0.991547% |
| C | 6152 | 97 | 1.576723% |
| D | 6152 | 122 | 1.983095% |
Noise dominated data is calculated using 1-second bins in cleaned event files. If a bin has >2000 counts, and if more than 50% of those come from <1% of pixels, then it is considered to be noise-dominated and hence unusable.
| Quadrant | # 1 sec bins | Bins with >0 counts | Bins with >2000 counts | High rate bins dominated by noise | Noise dominated (total time) | Noise dominated (detector-on time) | Marked lightcurve |
|---|---|---|---|---|---|---|---|
| A | 7447 | 6152 | 0 | 0 | 0.00% | 0.00% | 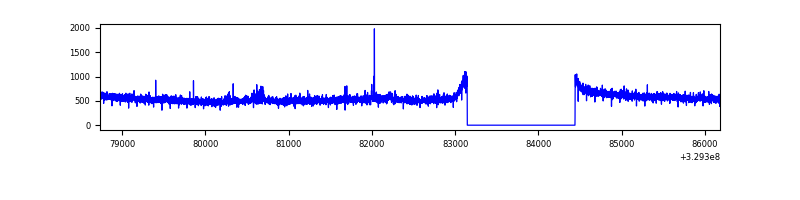 |
| B | 7447 | 6152 | 1 | 1 | 0.01% | 0.02% | 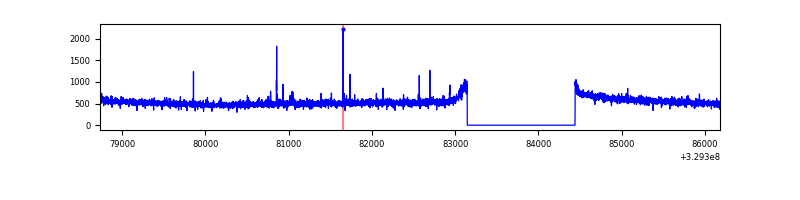 |
| C | 7447 | 6152 | 0 | 0 | 0.00% | 0.00% | 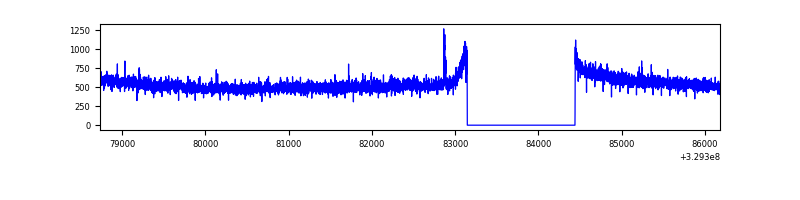 |
| D | 7447 | 6152 | 47 | 47 | 0.63% | 0.76% | 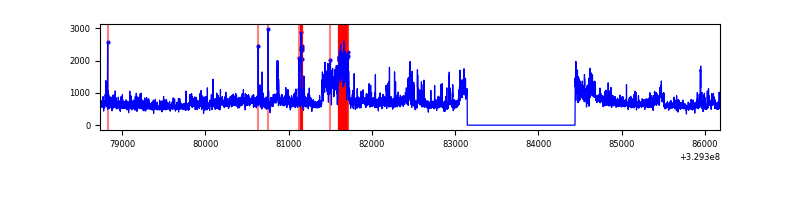 |
Top three noisy pixels from each quadrant. If the there are fewer than three noisy pixels in the level2.evt file, extra rows are filled as -1
| Pixel properties | Quadrant properties | ||||||
|---|---|---|---|---|---|---|---|
| Quadrant | DetID | PixID | Counts | Sigma | Mean | Median | Sigma |
| A | 6 | 16 | 76525 | 450.95 | 853 | 839 | 167.8 |
| A | 15 | 173 | 21962 | 125.85 | 853 | 839 | 167.8 |
| A | 13 | 254 | 8056 | 43.0 | 853 | 839 | 167.8 |
| B | 12 | 111 | 18045 | 111.07 | 830 | 811 | 155.2 |
| B | 11 | 111 | 16484 | 101.01 | 830 | 811 | 155.2 |
| B | 0 | 190 | 15713 | 96.04 | 830 | 811 | 155.2 |
| C | 14 | 238 | 132412 | 697.48 | 811 | 819 | 188.7 |
| C | 7 | 87 | 12045 | 59.5 | 811 | 819 | 188.7 |
| C | 7 | 247 | 11217 | 55.11 | 811 | 819 | 188.7 |
| D | 8 | 195 | 982898 | 4955.29 | 834 | 815 | 198.2 |
| D | 1 | 52 | 423533 | 2132.9 | 834 | 815 | 198.2 |
| D | 7 | 238 | 93698 | 468.66 | 834 | 815 | 198.2 |
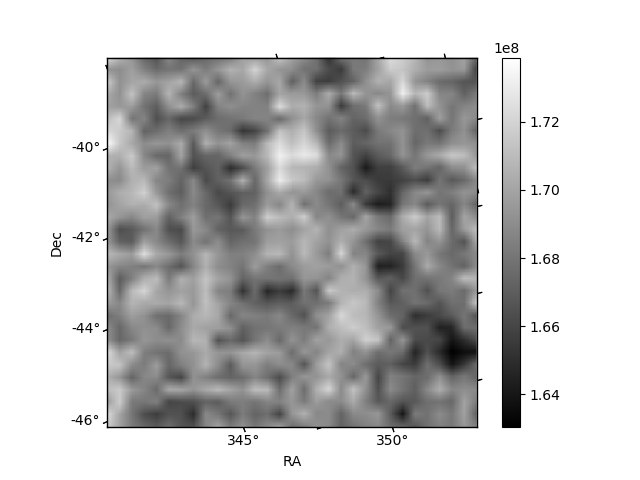
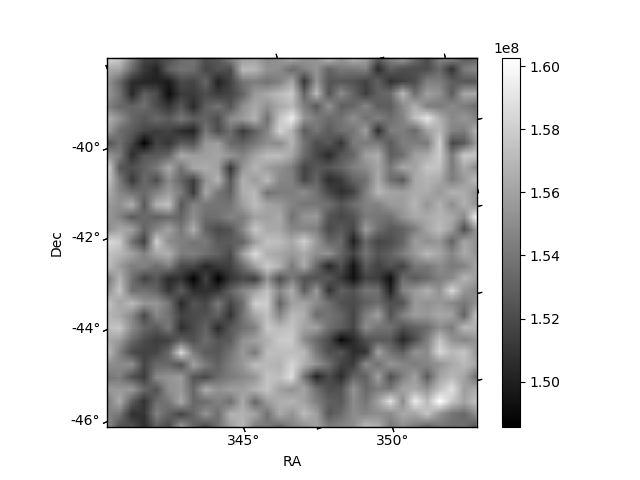
Histogram calculated using DETX and DETY for each event in the final _common_clean file
| Quadrant A | 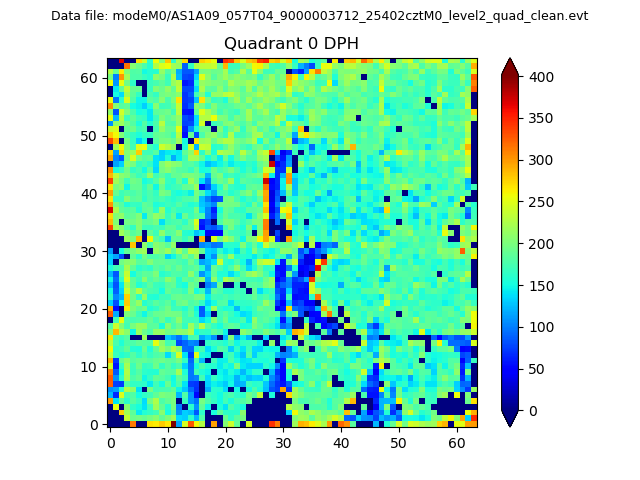 |
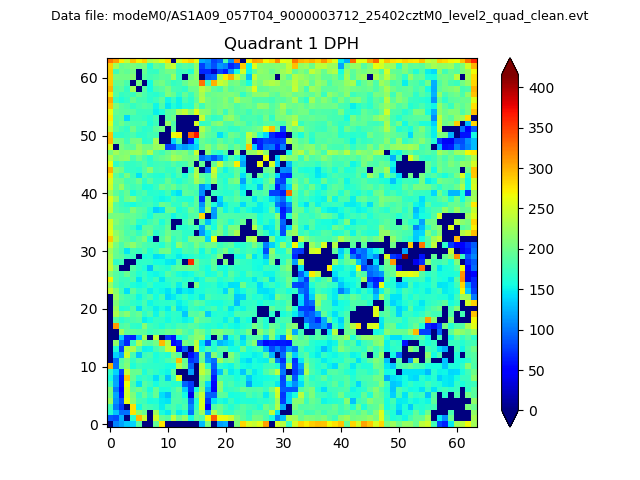 |
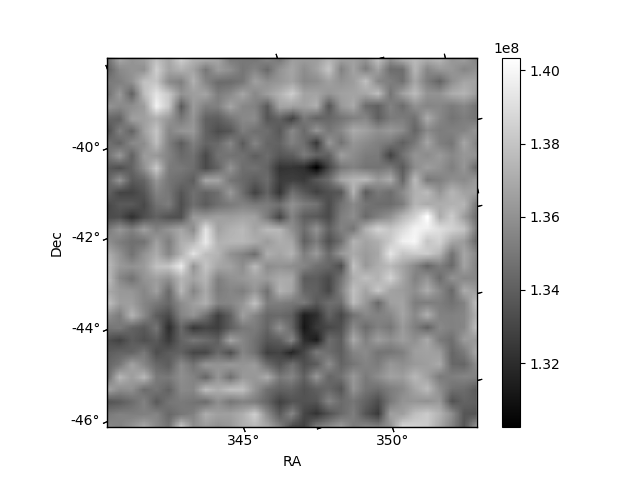
Quadrant B |
|---|---|---|---|
| Quadrant D | 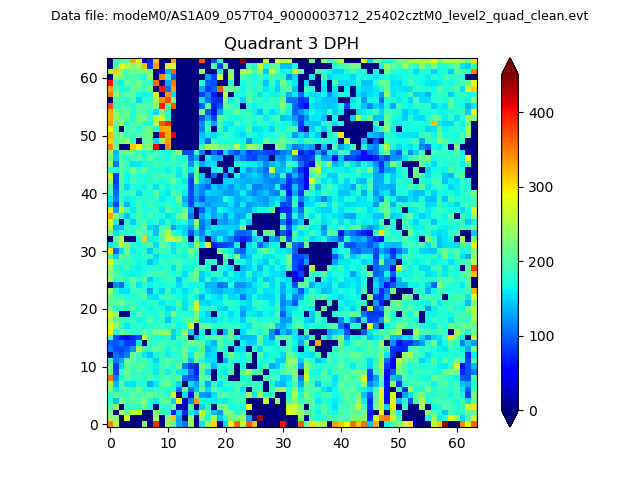 |
 |
Quadrant C |
| Plot type | Count rate plots | Images |
|---|---|---|
| Comparison with Poisson distribution Blue bars denote a histogram of data divided into 1 sec bins. Red curve is a Poisson curve with rate = median count rate of data. |
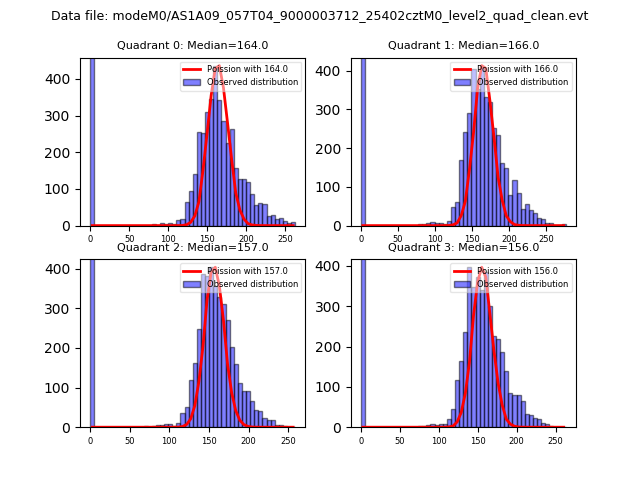 |
 |
| Quadrant-wise count rates Data is divided into 100 sec bins |
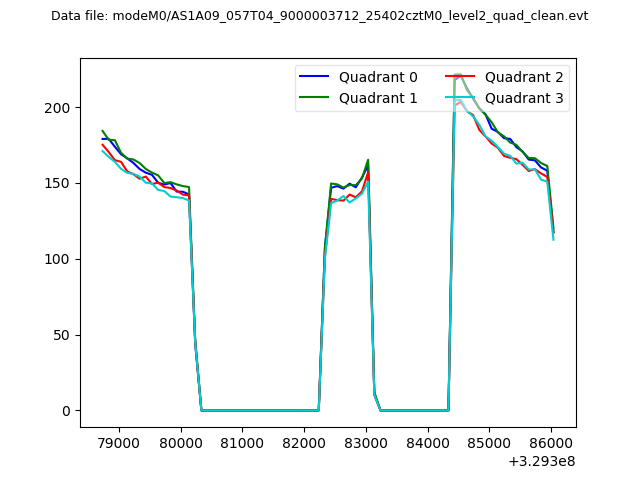 |
|
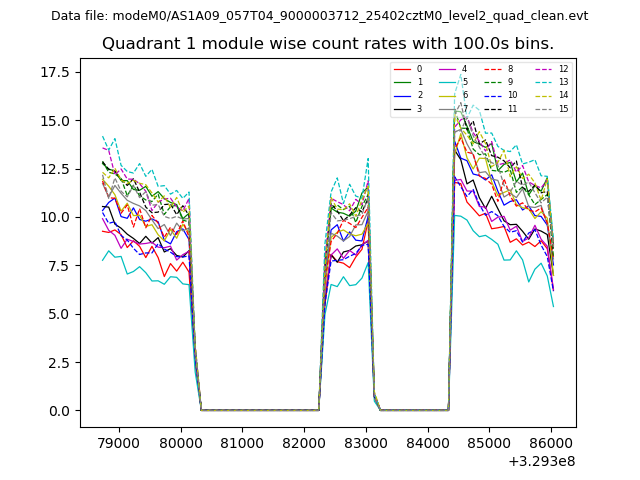
| Module-wise count rates for Quadrant A Data is divided into 100 sec bins |
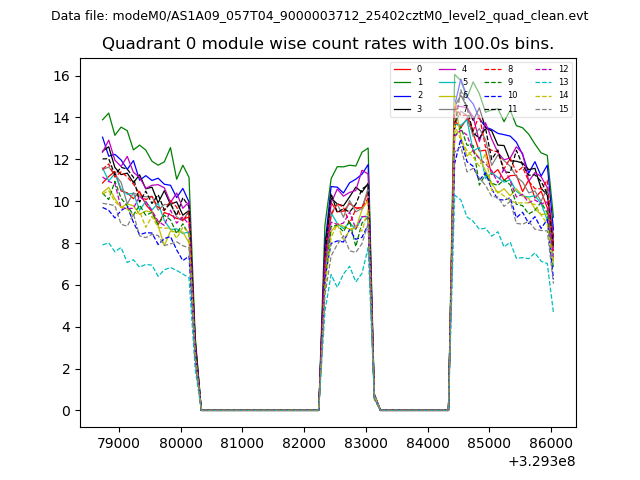 |
 |
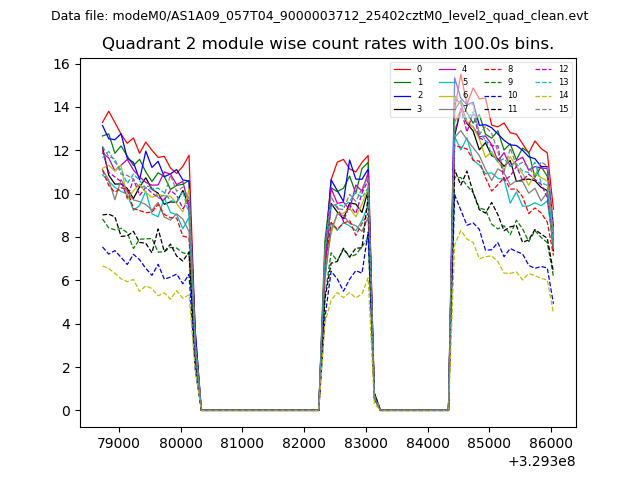
| Module-wise count rates for Quadrant B Data is divided into 100 sec bins |
 |
 |
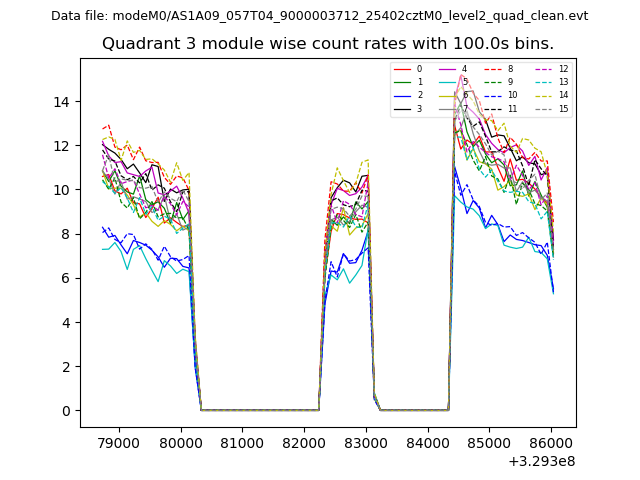
| Module-wise count rates for Quadrant C Data is divided into 100 sec bins |
 |
 |
| Module-wise count rates for Quadrant D Data is divided into 100 sec bins |
 |
 |
| Parameter | Plot |
|---|---|
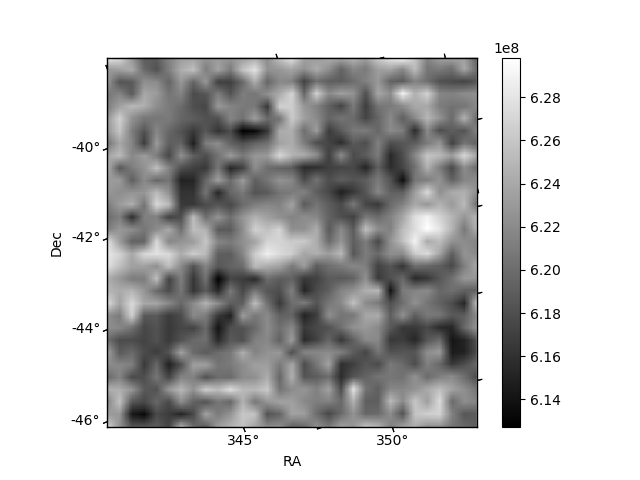
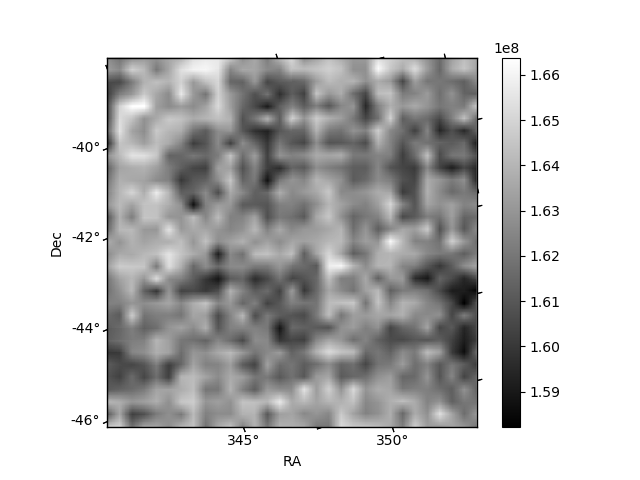
| CZT HV Monitor | 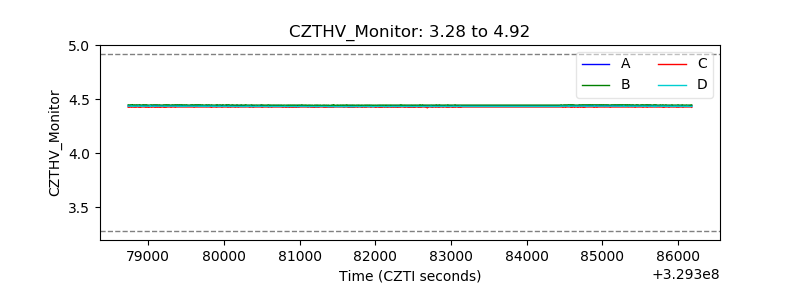 |
| D_VDD | 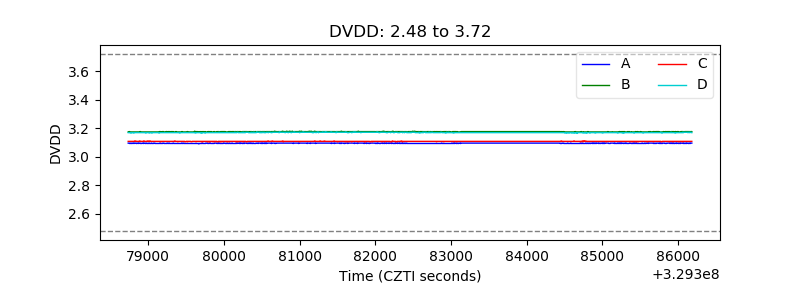 |
| Temperature 1 | 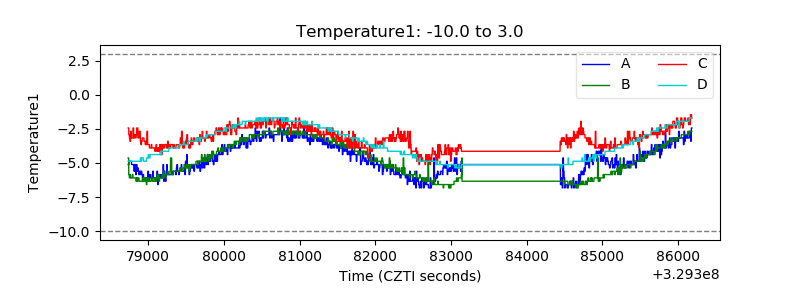 |
| Veto HV Monitor | 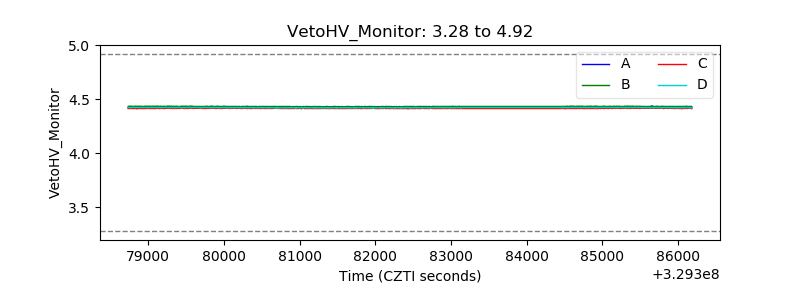 |
| Veto LLD | 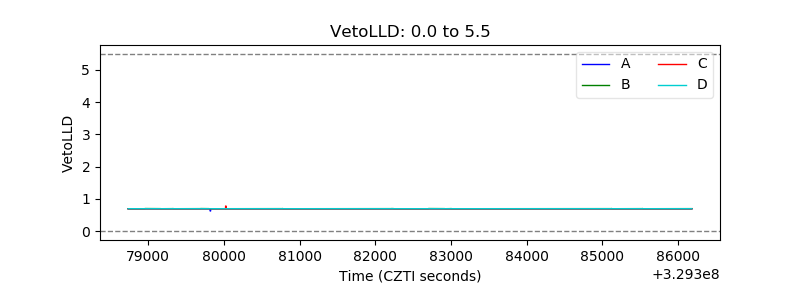 |
| Alpha Counter | 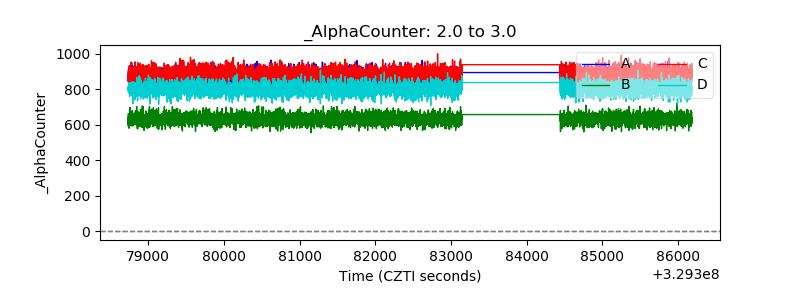 |
| _CPM_Rate | 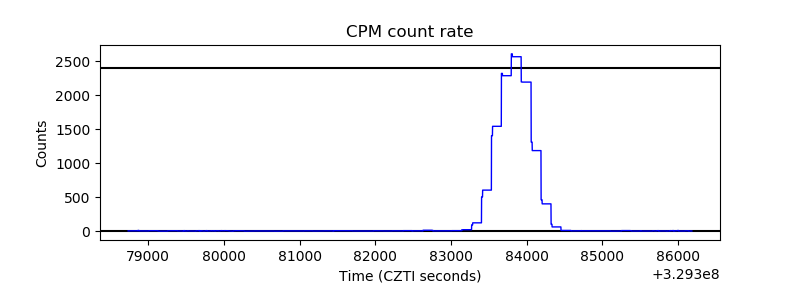 |
| CZT Counter | 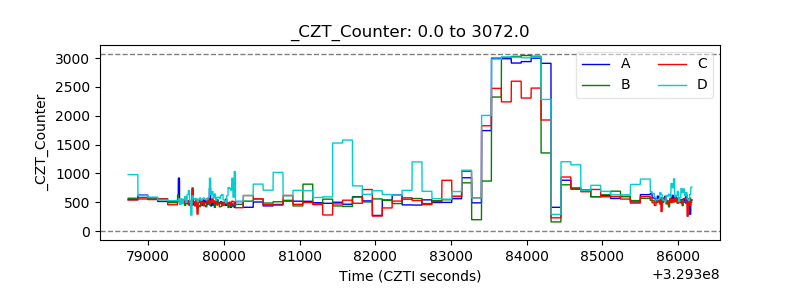 |
| +2.5 Volts monitor | 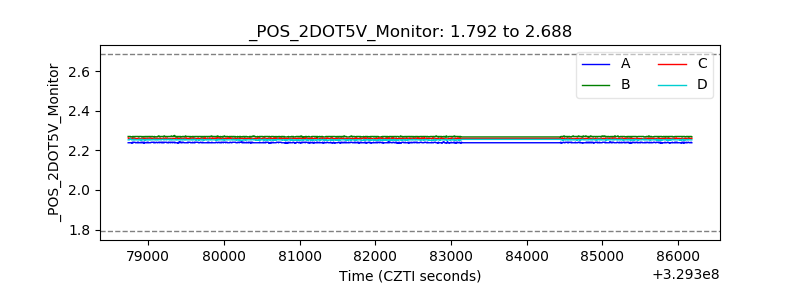 |
| +5 Volts monitor | 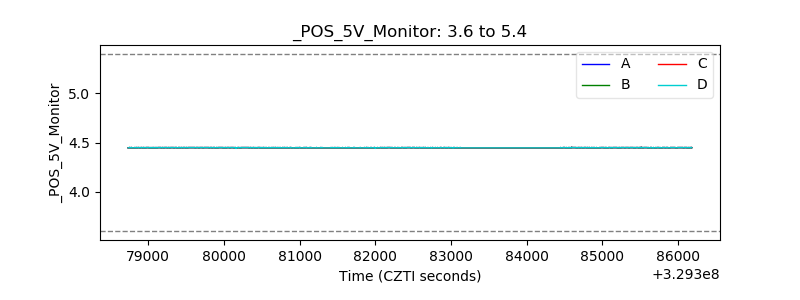 |
| _ROLL_ROT | 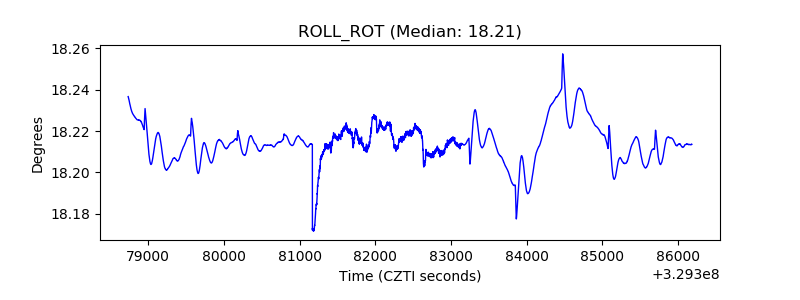 |
| _Roll_DEC | 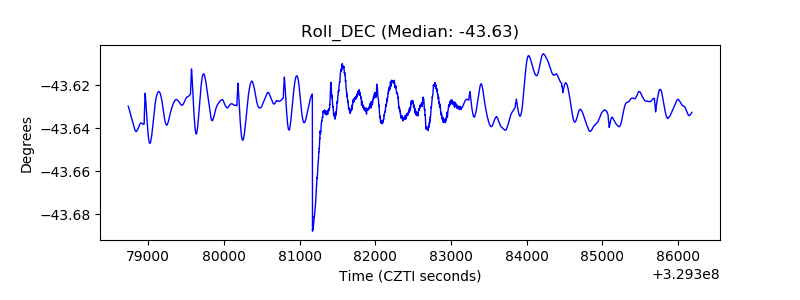 |
| _Roll_RA | 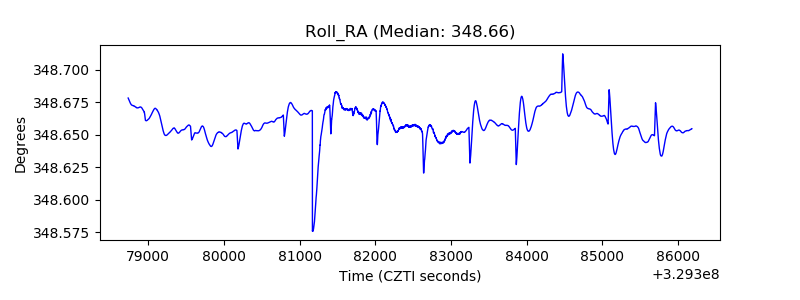 |
| Veto Counter | 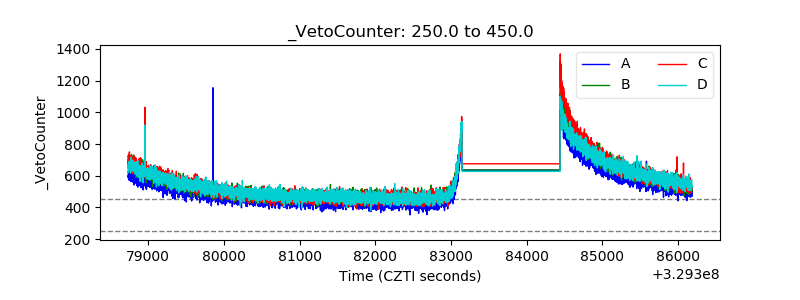 |