| Param | Original file | Final file |
|---|---|---|
| Filename | modeM0/AS1A09_057T04_9000003712_25403cztM0_level2.evt | modeM0/AS1A09_057T04_9000003712_25403cztM0_level2_quad_clean.evt |
| Size (bytes) | 457,801,920 | 80,651,520 |
| Size | 436.6 MB | 76.9 MB |
| Events in quadrant A | 3,133,346 | 529,768 |
| Events in quadrant B | 3,087,957 | 530,796 |
| Events in quadrant C | 3,008,962 | 499,682 |
| Events in quadrant D | 4,261,143 | 496,977 |
| Mode M9 | |||
|---|---|---|---|
| Quadrant | BADHDUFLAG | Total packets | Discarded packets |
| A | 0 | 14 | 0 |
| B | 0 | 14 | 0 |
| C | 0 | 14 | 0 |
| D | 0 | 14 | 0 |
| Mode M0 | |||
|---|---|---|---|
| Quadrant | BADHDUFLAG | Total packets | Discarded packets |
| A | 0 | 12537 | 0 |
| B | 0 | 12263 | 0 |
| C | 0 | 12073 | 0 |
| D | 0 | 16887 | 0 |
| Quadrant | Total seconds | Saturated seconds | Saturation percentage |
|---|---|---|---|
| A | 5509 | 70 | 1.270648% |
| B | 5509 | 108 | 1.960428% |
| C | 5509 | 102 | 1.851516% |
| D | 5509 | 155 | 2.813578% |
Noise dominated data is calculated using 1-second bins in cleaned event files. If a bin has >2000 counts, and if more than 50% of those come from <1% of pixels, then it is considered to be noise-dominated and hence unusable.
| Quadrant | # 1 sec bins | Bins with >0 counts | Bins with >2000 counts | High rate bins dominated by noise | Noise dominated (total time) | Noise dominated (detector-on time) | Marked lightcurve |
|---|---|---|---|---|---|---|---|
| A | 6854 | 5509 | 0 | 0 | 0.00% | 0.00% | 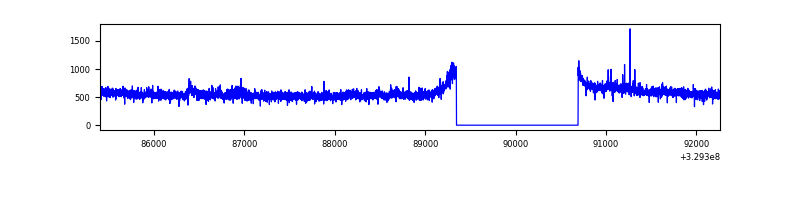 |
| B | 6854 | 5509 | 25 | 25 | 0.36% | 0.45% | 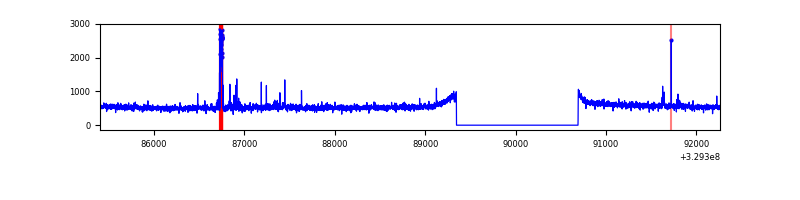 |
| C | 6854 | 5509 | 0 | 0 | 0.00% | 0.00% | 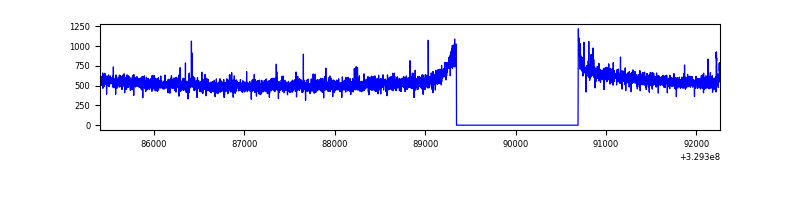 |
| D | 6854 | 5509 | 80 | 80 | 1.17% | 1.45% | 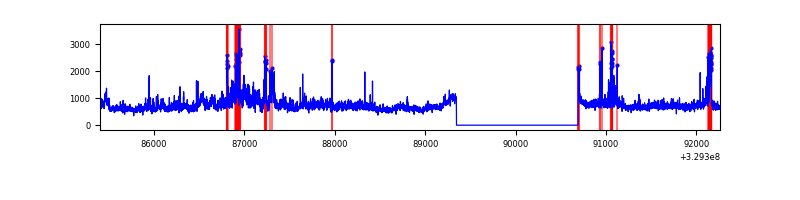 |
Top three noisy pixels from each quadrant. If the there are fewer than three noisy pixels in the level2.evt file, extra rows are filled as -1
| Pixel properties | Quadrant properties | ||||||
|---|---|---|---|---|---|---|---|
| Quadrant | DetID | PixID | Counts | Sigma | Mean | Median | Sigma |
| A | 6 | 16 | 109753 | 711.96 | 779 | 767 | 153.1 |
| A | 15 | 173 | 20145 | 126.59 | 779 | 767 | 153.1 |
| A | 13 | 254 | 7518 | 44.1 | 779 | 767 | 153.1 |
| B | 15 | 32 | 76911 | 543.81 | 753 | 737 | 140.1 |
| B | 0 | 229 | 33779 | 235.89 | 753 | 737 | 140.1 |
| B | 12 | 111 | 16537 | 112.8 | 753 | 737 | 140.1 |
| C | 14 | 238 | 120530 | 714.0 | 729 | 737 | 167.8 |
| C | 5 | 112 | 18608 | 106.52 | 729 | 737 | 167.8 |
| C | 7 | 247 | 9085 | 49.76 | 729 | 737 | 167.8 |
| D | 8 | 195 | 722980 | 3984.54 | 754 | 734 | 181.3 |
| D | 1 | 52 | 396490 | 2183.34 | 754 | 734 | 181.3 |
| D | 7 | 238 | 218203 | 1199.75 | 754 | 734 | 181.3 |
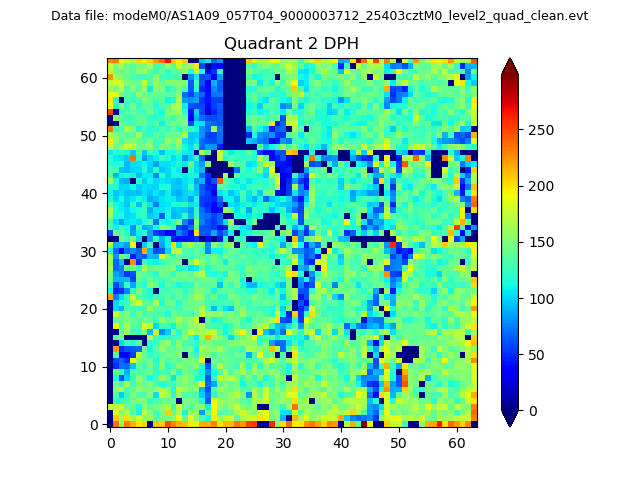
Histogram calculated using DETX and DETY for each event in the final _common_clean file
| Quadrant A | 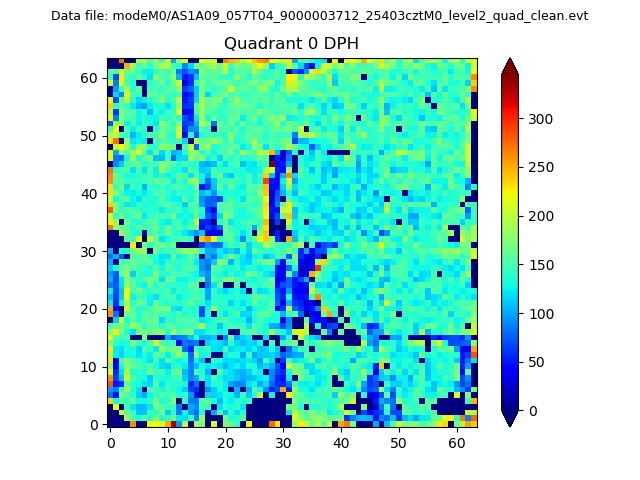 |
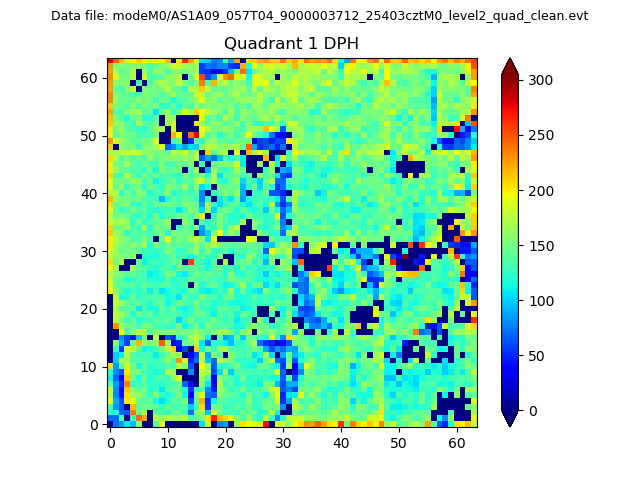 |
Quadrant B |
|---|---|---|---|
| Quadrant D | 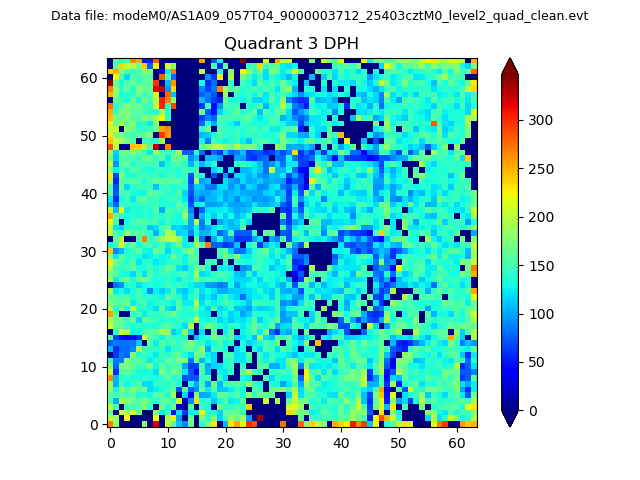 |
 |
Quadrant C |
| Plot type | Count rate plots | Images |
|---|---|---|
| Comparison with Poisson distribution Blue bars denote a histogram of data divided into 1 sec bins. Red curve is a Poisson curve with rate = median count rate of data. |
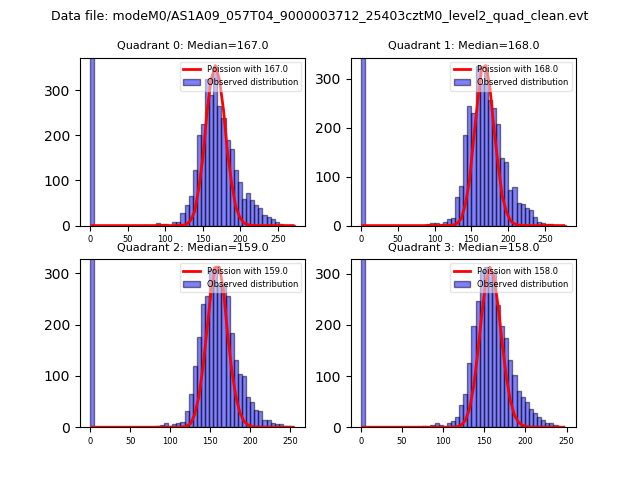 |
 |
| Quadrant-wise count rates Data is divided into 100 sec bins |
 |
|
| Module-wise count rates for Quadrant A Data is divided into 100 sec bins |
 |
 |
| Module-wise count rates for Quadrant B Data is divided into 100 sec bins |
 |
 |
| Module-wise count rates for Quadrant C Data is divided into 100 sec bins |
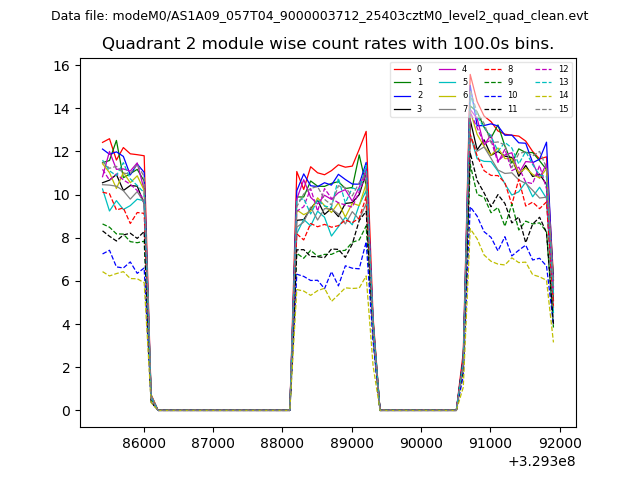 |
 |
| Module-wise count rates for Quadrant D Data is divided into 100 sec bins |
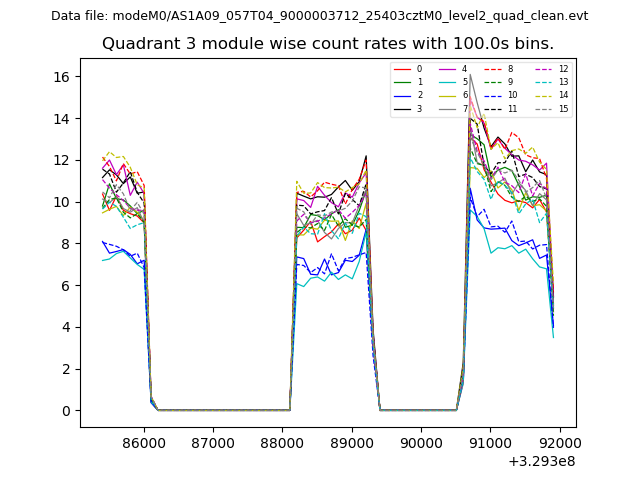 |
 |
| Parameter | Plot |
|---|---|
| CZT HV Monitor | 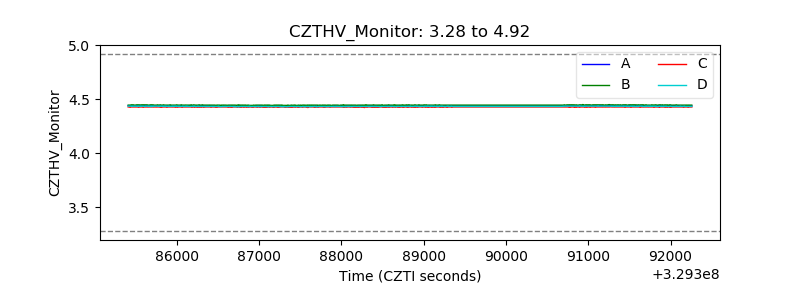 |
| D_VDD | 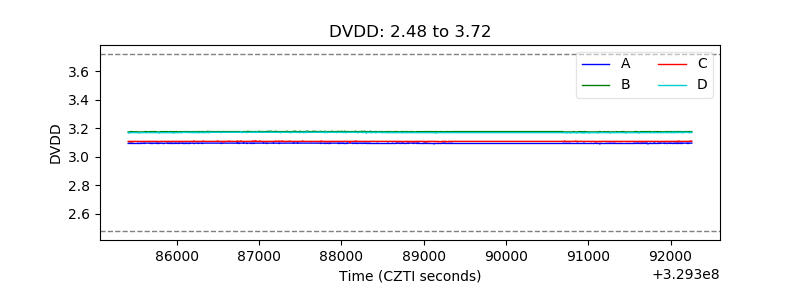 |
| Temperature 1 | 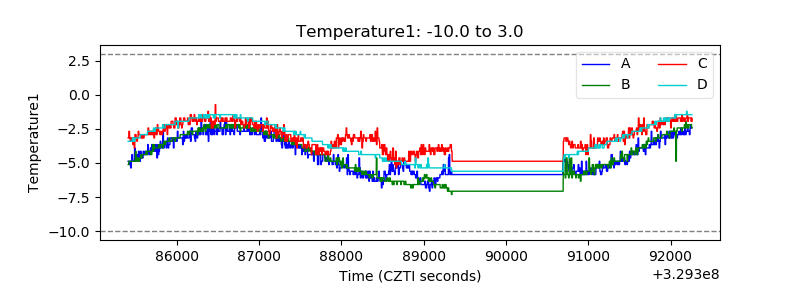 |
| Veto HV Monitor | 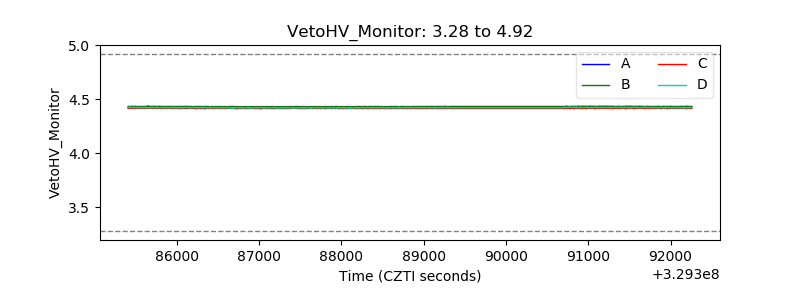 |
| Veto LLD | 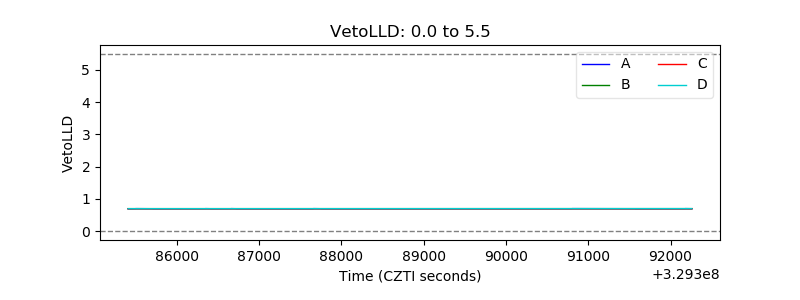 |
| Alpha Counter | 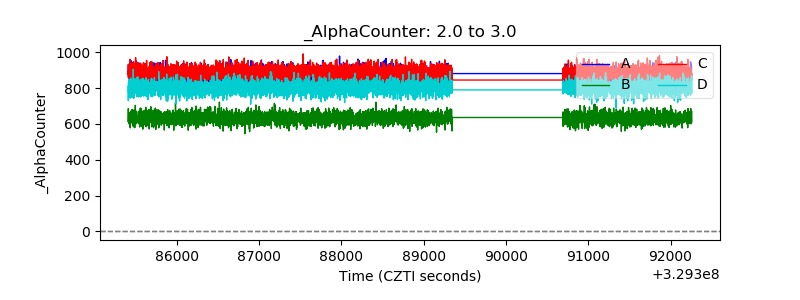 |
| _CPM_Rate | 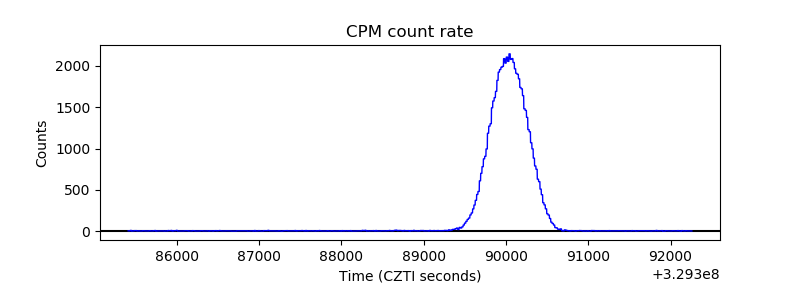 |
| CZT Counter | 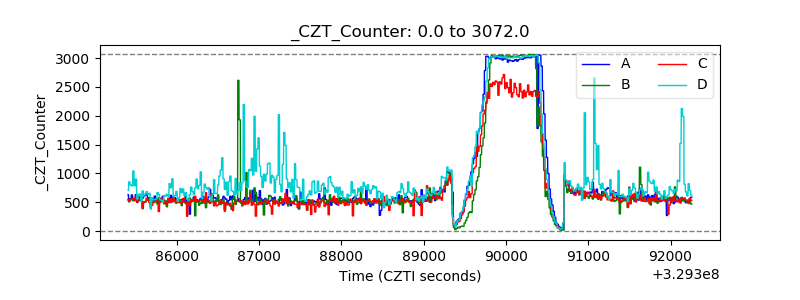 |
| +2.5 Volts monitor |  |
| +5 Volts monitor |  |
| _ROLL_ROT |  |
| _Roll_DEC | 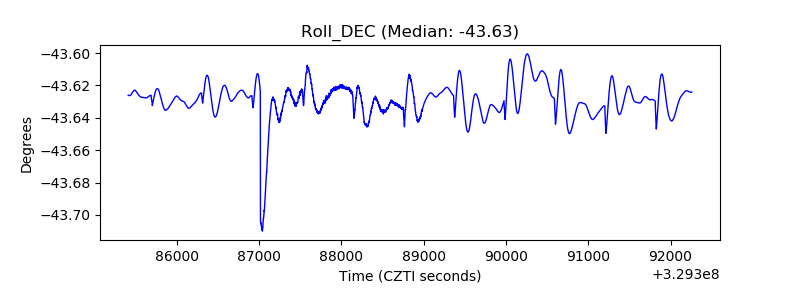 |
| _Roll_RA | 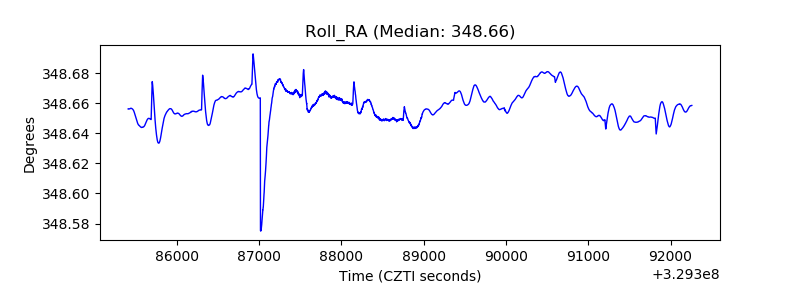 |
| Veto Counter |  |