| Param | Original file | Final file |
|---|---|---|
| Filename | modeM0/AS1A09_057T04_9000003712_25404cztM0_level2.evt | modeM0/AS1A09_057T04_9000003712_25404cztM0_level2_quad_clean.evt |
| Size (bytes) | 1,681,957,440 | 288,616,320 |
| Size | 1.6 GB | 275.2 MB |
| Events in quadrant A | 11,372,539 | 1,878,781 |
| Events in quadrant B | 11,127,151 | 1,892,115 |
| Events in quadrant C | 11,190,809 | 1,787,752 |
| Events in quadrant D | 15,856,162 | 1,761,052 |
| Mode M9 | |||
|---|---|---|---|
| Quadrant | BADHDUFLAG | Total packets | Discarded packets |
| A | 0 | 53 | 0 |
| B | 0 | 53 | 0 |
| C | 0 | 53 | 0 |
| D | 0 | 53 | 0 |
| Mode M0 | |||
|---|---|---|---|
| Quadrant | BADHDUFLAG | Total packets | Discarded packets |
| A | 0 | 45726 | 0 |
| B | 0 | 45024 | 0 |
| C | 0 | 45575 | 0 |
| D | 0 | 62349 | 0 |
| Quadrant | Total seconds | Saturated seconds | Saturation percentage |
|---|---|---|---|
| A | 20660 | 247 | 1.195547% |
| B | 20660 | 301 | 1.456922% |
| C | 20659 | 387 | 1.873276% |
| D | 20660 | 676 | 3.272023% |
Noise dominated data is calculated using 1-second bins in cleaned event files. If a bin has >2000 counts, and if more than 50% of those come from <1% of pixels, then it is considered to be noise-dominated and hence unusable.
| Quadrant | # 1 sec bins | Bins with >0 counts | Bins with >2000 counts | High rate bins dominated by noise | Noise dominated (total time) | Noise dominated (detector-on time) | Marked lightcurve |
|---|---|---|---|---|---|---|---|
| A | 25840 | 20660 | 0 | 0 | 0.00% | 0.00% | 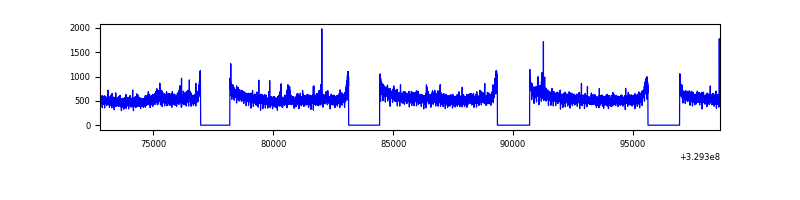 |
| B | 25840 | 20660 | 26 | 26 | 0.10% | 0.13% | 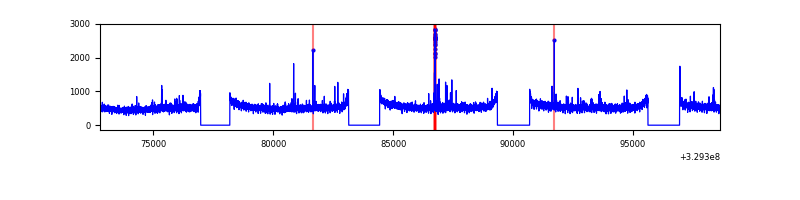 |
| C | 25840 | 20660 | 0 | 0 | 0.00% | 0.00% | 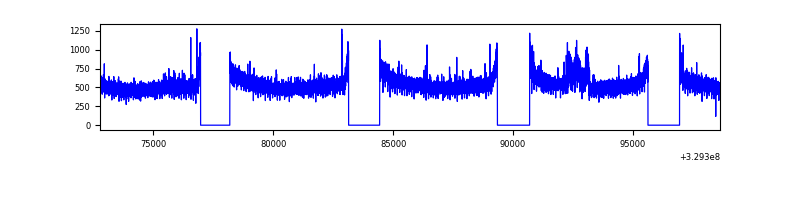 |
| D | 25840 | 20660 | 404 | 404 | 1.56% | 1.96% | 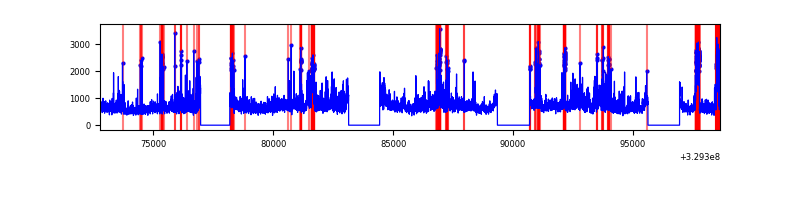 |
Top three noisy pixels from each quadrant. If the there are fewer than three noisy pixels in the level2.evt file, extra rows are filled as -1
| Pixel properties | Quadrant properties | ||||||
|---|---|---|---|---|---|---|---|
| Quadrant | DetID | PixID | Counts | Sigma | Mean | Median | Sigma |
| A | 6 | 16 | 329392 | 583.58 | 2845 | 2796 | 559.6 |
| A | 15 | 173 | 81496 | 140.63 | 2845 | 2796 | 559.6 |
| A | 13 | 254 | 27653 | 44.42 | 2845 | 2796 | 559.6 |
| B | 0 | 229 | 94250 | 179.42 | 2767 | 2704 | 510.2 |
| B | 15 | 32 | 83757 | 158.85 | 2767 | 2704 | 510.2 |
| B | 12 | 111 | 61265 | 114.77 | 2767 | 2704 | 510.2 |
| C | 14 | 238 | 439573 | 710.22 | 2683 | 2710 | 615.1 |
| C | 7 | 87 | 206569 | 331.42 | 2683 | 2710 | 615.1 |
| C | 7 | 247 | 36338 | 54.67 | 2683 | 2710 | 615.1 |
| D | 8 | 195 | 2420697 | 3729.57 | 2750 | 2680 | 648.3 |
| D | 1 | 52 | 1699713 | 2617.52 | 2750 | 2680 | 648.3 |
| D | 7 | 238 | 1101042 | 1694.12 | 2750 | 2680 | 648.3 |
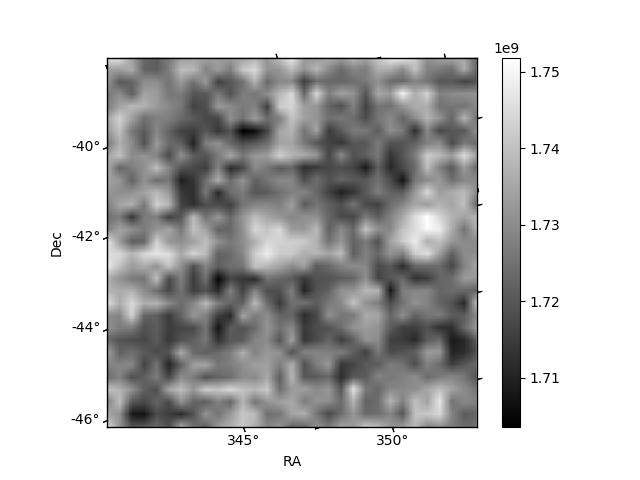
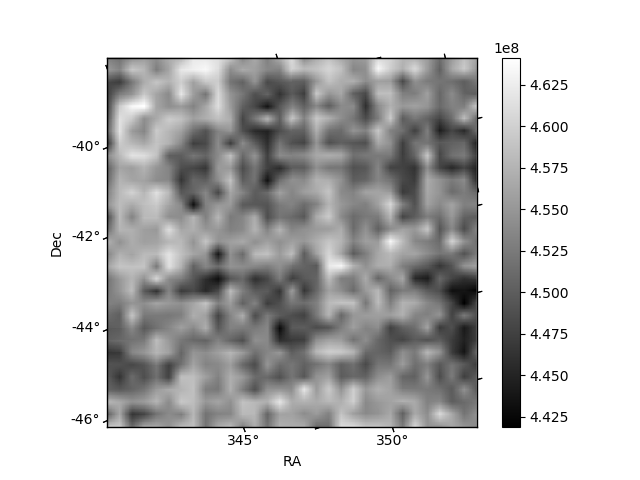
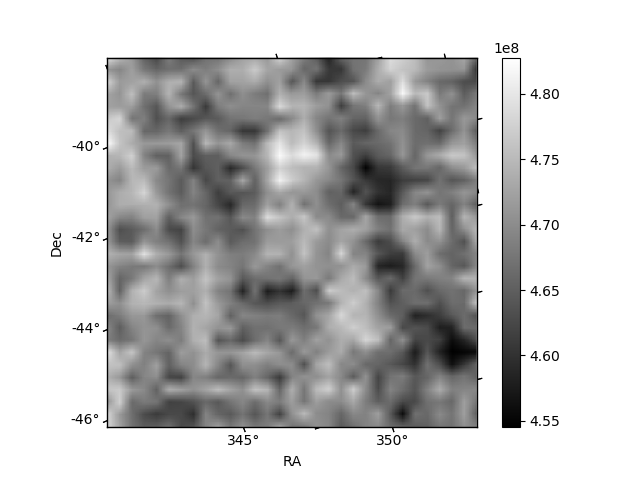
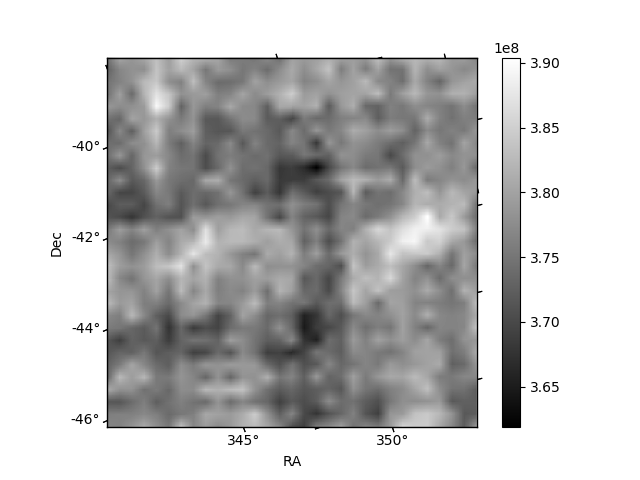
Histogram calculated using DETX and DETY for each event in the final _common_clean file
| Quadrant A | 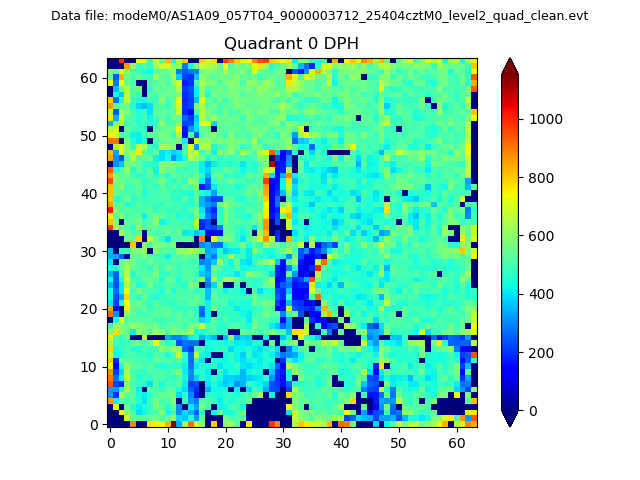 |
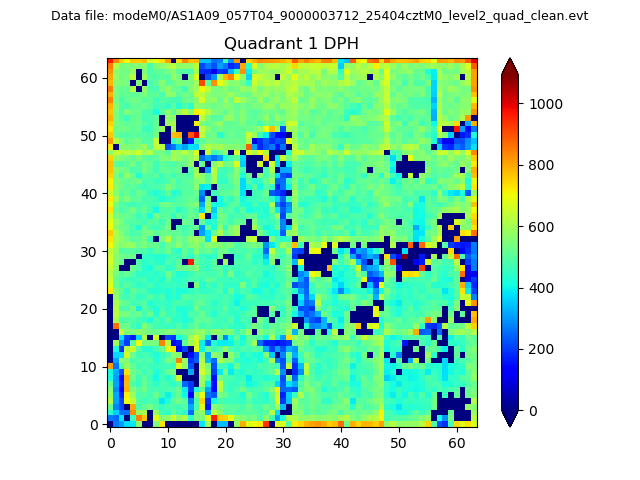 |
Quadrant B |
|---|---|---|---|
| Quadrant D | 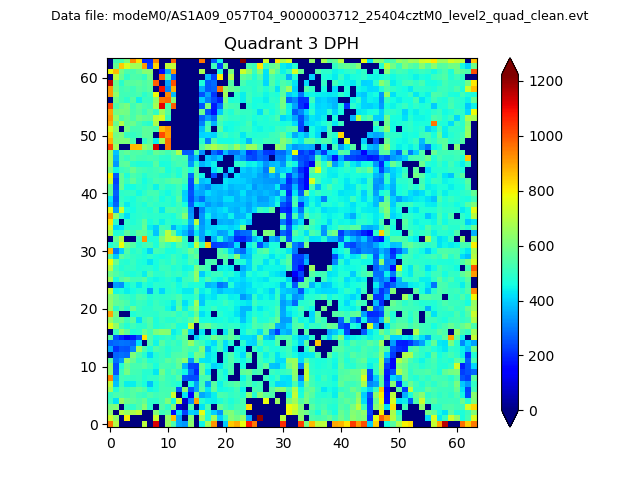 |
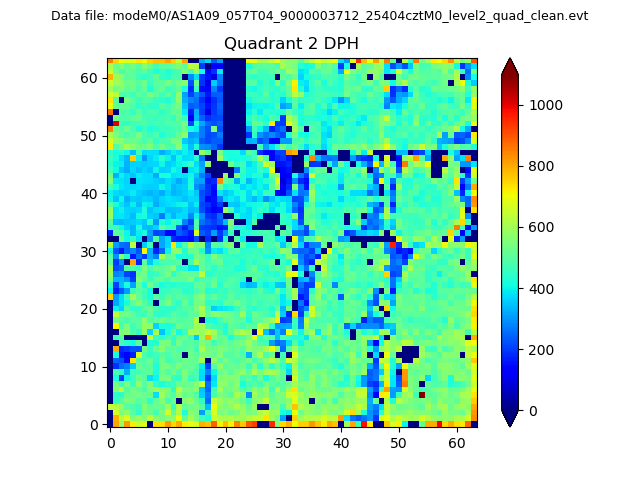 |
Quadrant C |
| Plot type | Count rate plots | Images |
|---|---|---|
| Comparison with Poisson distribution Blue bars denote a histogram of data divided into 1 sec bins. Red curve is a Poisson curve with rate = median count rate of data. |
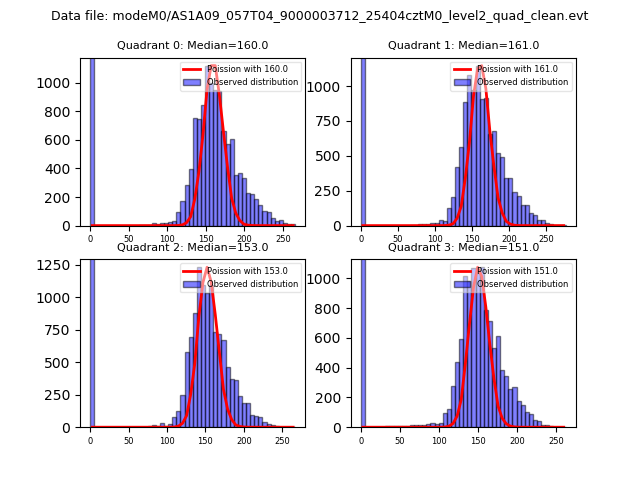 |
 |
| Quadrant-wise count rates Data is divided into 100 sec bins |
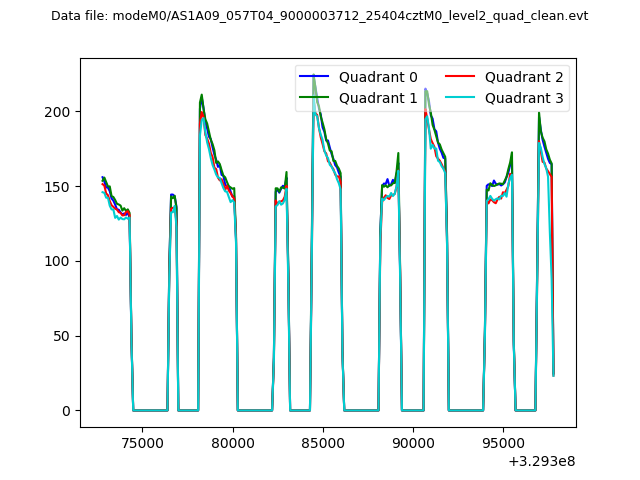 |
|
| Module-wise count rates for Quadrant A Data is divided into 100 sec bins |
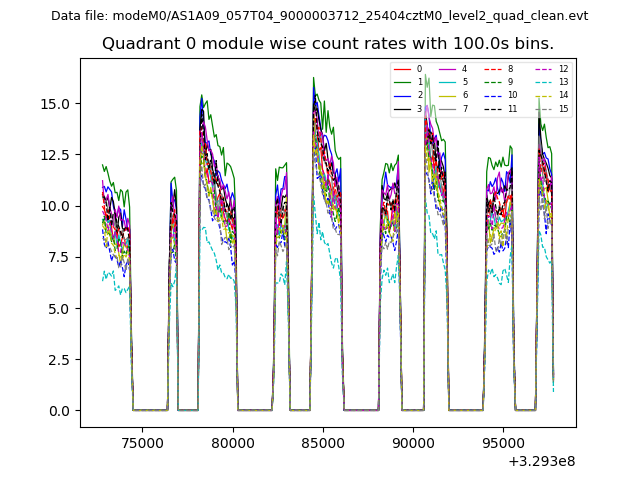 |
 |
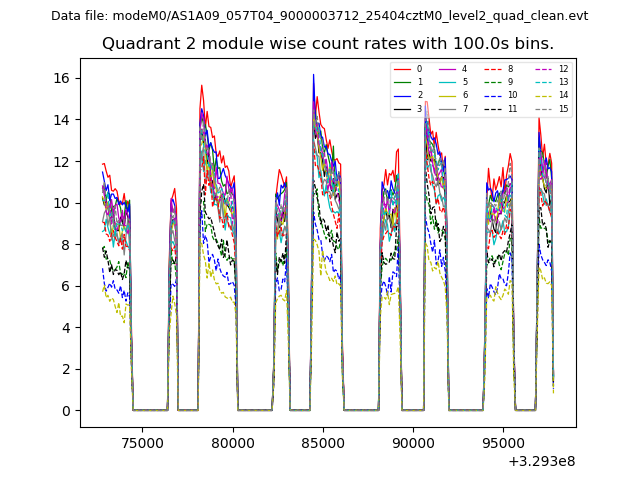
| Module-wise count rates for Quadrant B Data is divided into 100 sec bins |
 |
 |
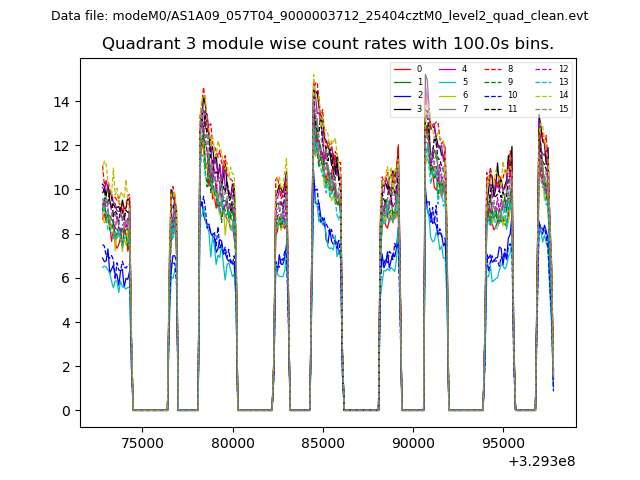
| Module-wise count rates for Quadrant C Data is divided into 100 sec bins |
 |
 |
| Module-wise count rates for Quadrant D Data is divided into 100 sec bins |
 |
 |
| Parameter | Plot |
|---|---|
| CZT HV Monitor | 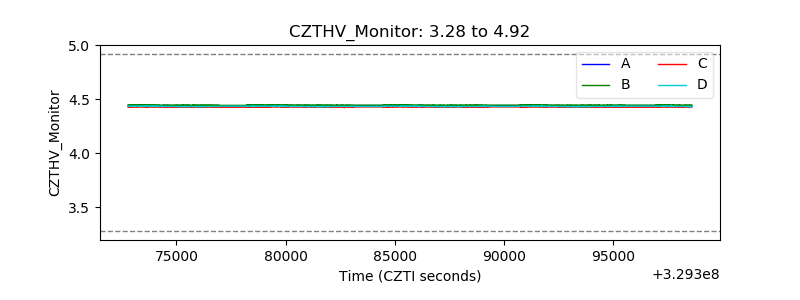 |
| D_VDD | 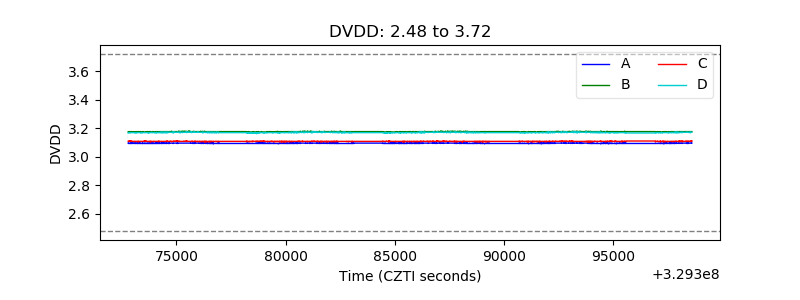 |
| Temperature 1 | 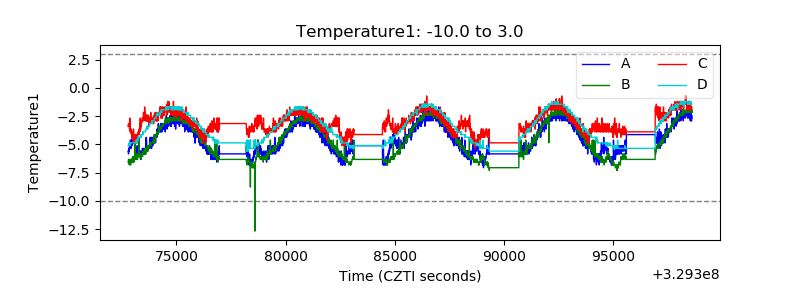 |
| Veto HV Monitor | 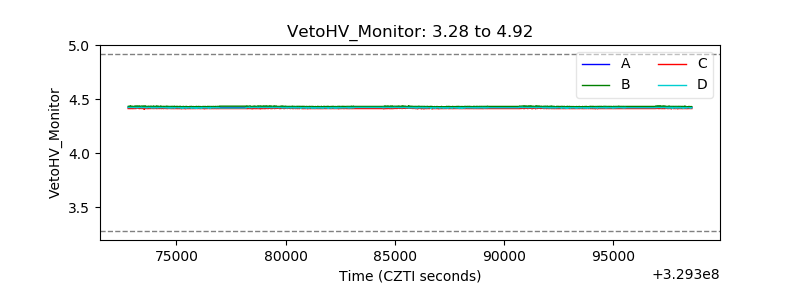 |
| Veto LLD | 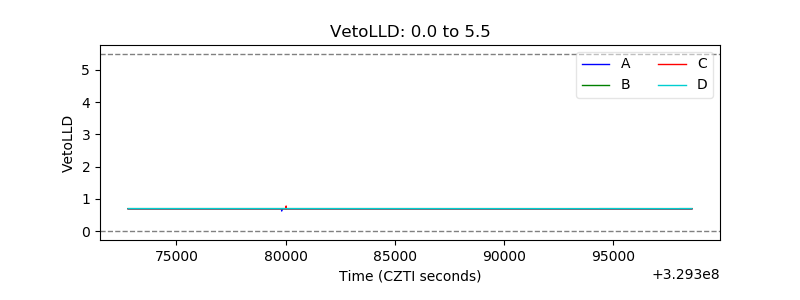 |
| Alpha Counter | 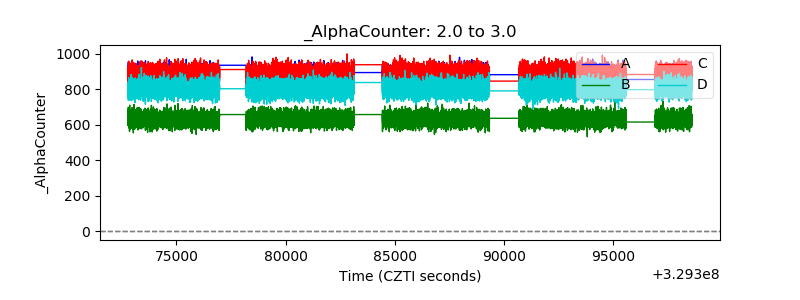 |
| _CPM_Rate | 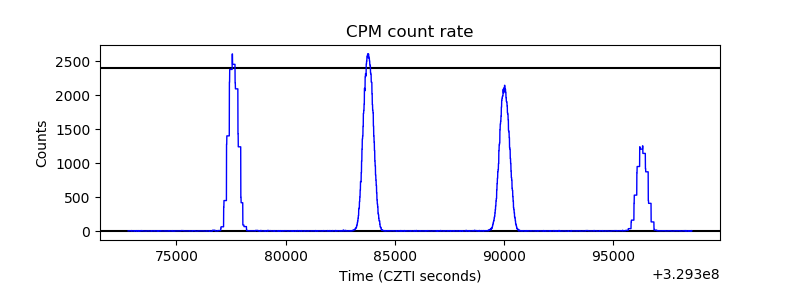 |
| CZT Counter | 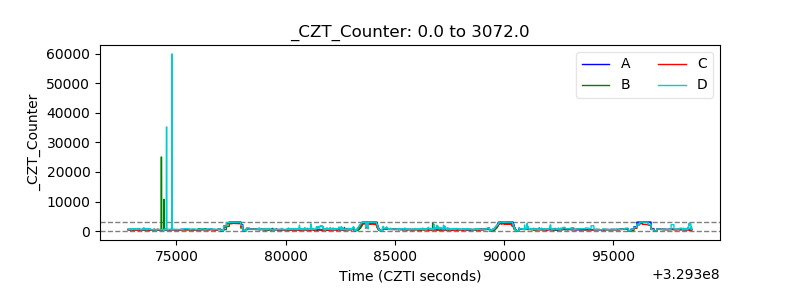 |
| +2.5 Volts monitor | 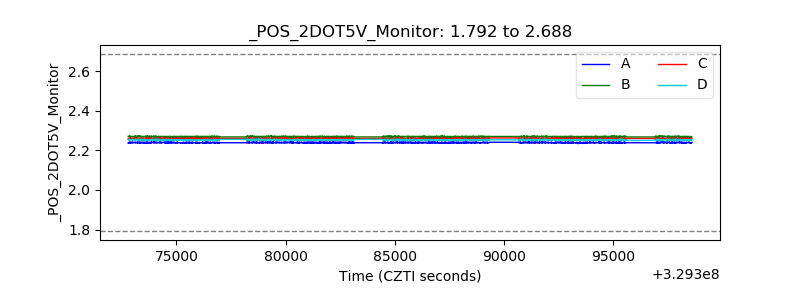 |
| +5 Volts monitor |  |
| _ROLL_ROT | 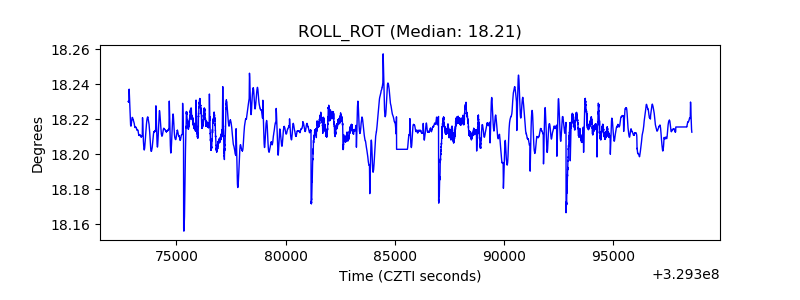 |
| _Roll_DEC | 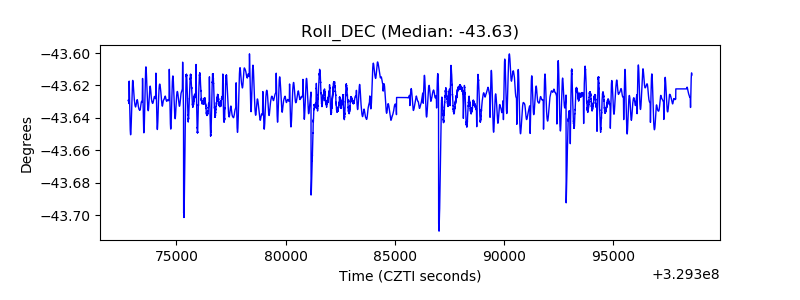 |
| _Roll_RA | 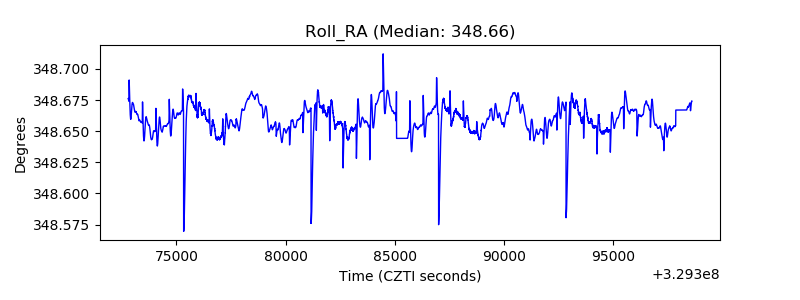 |
| Veto Counter | 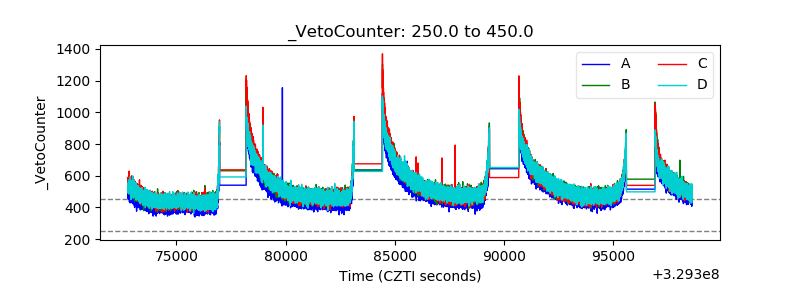 |