| Param | Original file | Final file |
|---|---|---|
| Filename | modeM0/AS1A09_057T04_9000003712_25405cztM0_level2.evt | modeM0/AS1A09_057T04_9000003712_25405cztM0_level2_quad_clean.evt |
| Size (bytes) | 503,058,240 | 75,746,880 |
| Size | 479.8 MB | 72.2 MB |
| Events in quadrant A | 3,299,479 | 480,771 |
| Events in quadrant B | 3,330,404 | 483,101 |
| Events in quadrant C | 3,284,453 | 453,216 |
| Events in quadrant D | 4,892,247 | 435,528 |
| Mode M9 | |||
|---|---|---|---|
| Quadrant | BADHDUFLAG | Total packets | Discarded packets |
| A | 0 | 12 | 0 |
| B | 0 | 12 | 0 |
| C | 0 | 12 | 0 |
| D | 0 | 12 | 0 |
| Mode M0 | |||
|---|---|---|---|
| Quadrant | BADHDUFLAG | Total packets | Discarded packets |
| A | 0 | 13324 | 0 |
| B | 0 | 13434 | 0 |
| C | 0 | 13346 | 0 |
| D | 0 | 18683 | 0 |
| Quadrant | Total seconds | Saturated seconds | Saturation percentage |
|---|---|---|---|
| A | 6318 | 86 | 1.361190% |
| B | 6319 | 102 | 1.614179% |
| C | 6319 | 108 | 1.709131% |
| D | 6319 | 425 | 6.725748% |
Noise dominated data is calculated using 1-second bins in cleaned event files. If a bin has >2000 counts, and if more than 50% of those come from <1% of pixels, then it is considered to be noise-dominated and hence unusable.
| Quadrant | # 1 sec bins | Bins with >0 counts | Bins with >2000 counts | High rate bins dominated by noise | Noise dominated (total time) | Noise dominated (detector-on time) | Marked lightcurve |
|---|---|---|---|---|---|---|---|
| A | 7478 | 6318 | 0 | 0 | 0.00% | 0.00% | 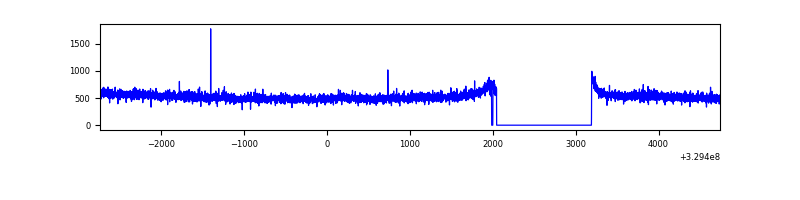 |
| B | 7479 | 6319 | 0 | 0 | 0.00% | 0.00% | 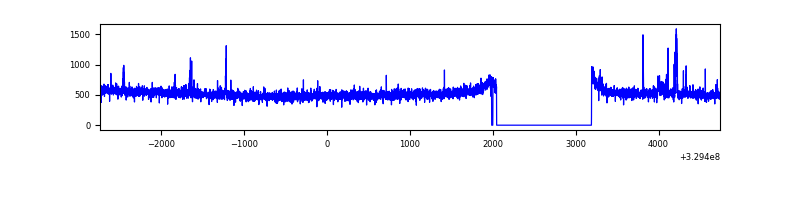 |
| C | 7479 | 6320 | 0 | 0 | 0.00% | 0.00% | 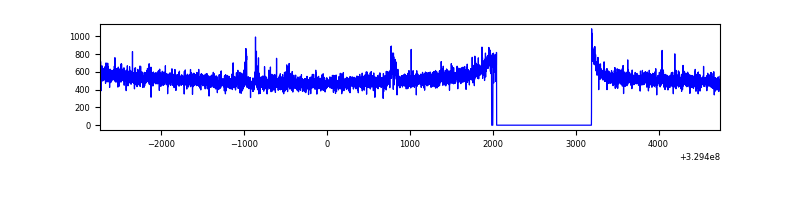 |
| D | 7479 | 6320 | 301 | 301 | 4.02% | 4.76% | 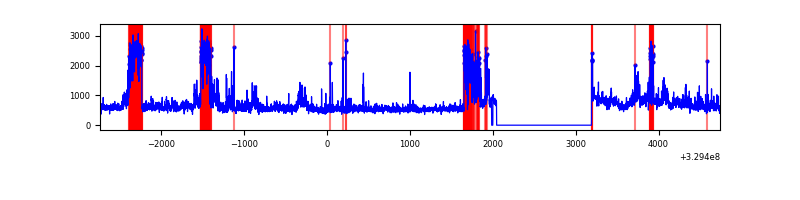 |
Top three noisy pixels from each quadrant. If the there are fewer than three noisy pixels in the level2.evt file, extra rows are filled as -1
| Pixel properties | Quadrant properties | ||||||
|---|---|---|---|---|---|---|---|
| Quadrant | DetID | PixID | Counts | Sigma | Mean | Median | Sigma |
| A | 15 | 173 | 22175 | 127.54 | 847 | 831 | 167.3 |
| A | 6 | 16 | 12277 | 68.4 | 847 | 831 | 167.3 |
| A | 13 | 254 | 8676 | 46.88 | 847 | 831 | 167.3 |
| B | 0 | 190 | 34677 | 214.89 | 828 | 807 | 157.6 |
| B | 3 | 112 | 24526 | 150.49 | 828 | 807 | 157.6 |
| B | 0 | 229 | 23541 | 144.24 | 828 | 807 | 157.6 |
| C | 14 | 238 | 129635 | 702.44 | 794 | 802 | 183.4 |
| C | 7 | 247 | 49731 | 266.78 | 794 | 802 | 183.4 |
| C | 3 | 233 | 7390 | 35.92 | 794 | 802 | 183.4 |
| D | 1 | 52 | 684838 | 3577.04 | 802 | 781 | 191.2 |
| D | 7 | 238 | 649544 | 3392.48 | 802 | 781 | 191.2 |
| D | 8 | 195 | 407455 | 2126.56 | 802 | 781 | 191.2 |
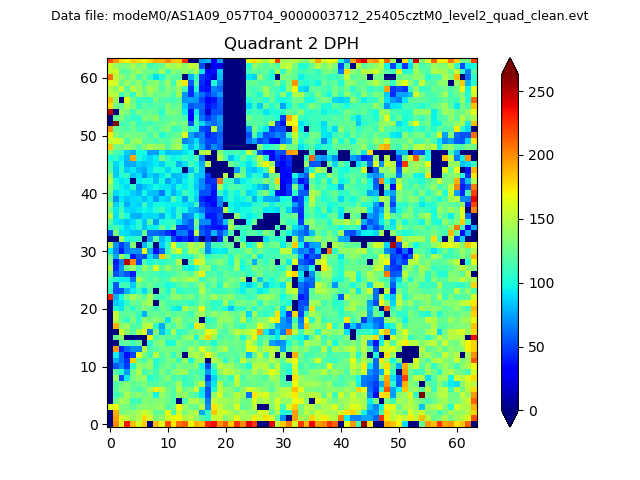
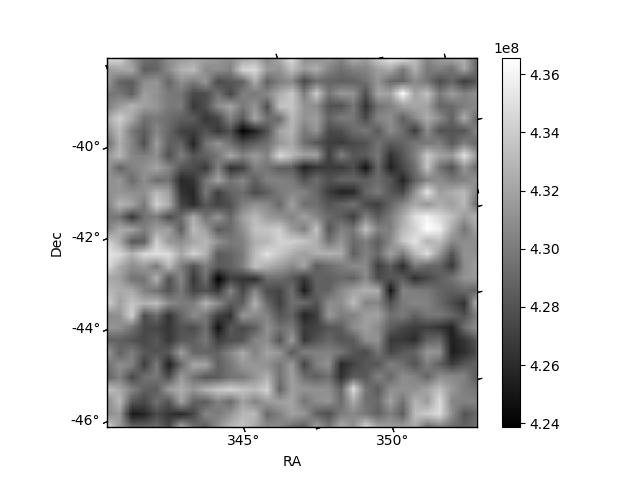
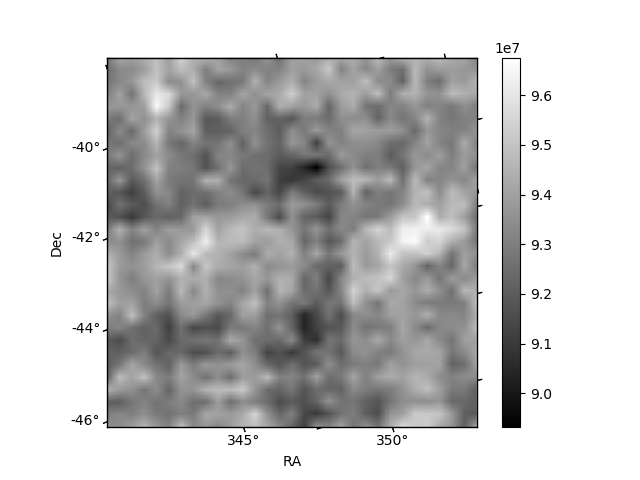
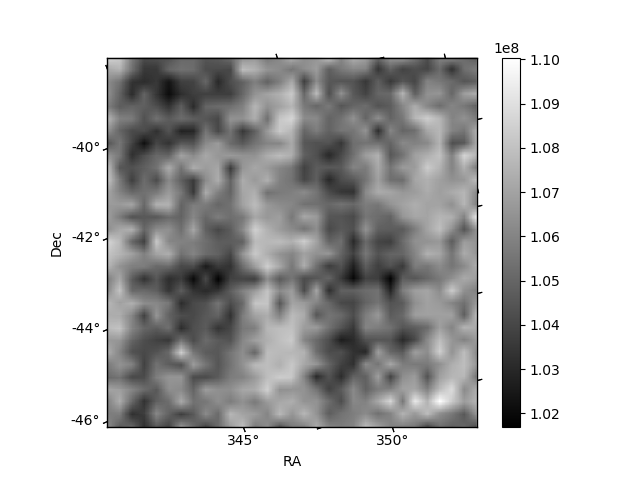
Histogram calculated using DETX and DETY for each event in the final _common_clean file
| Quadrant A | 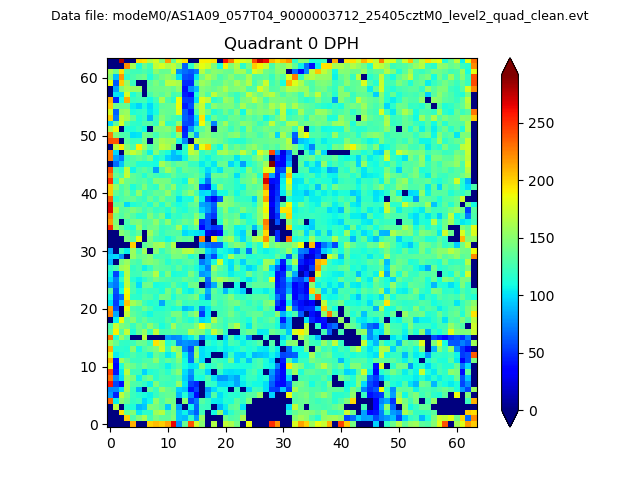 |
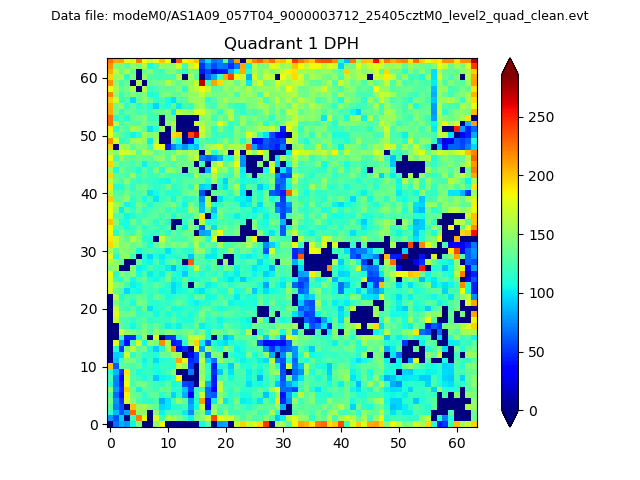 |
Quadrant B |
|---|---|---|---|
| Quadrant D | 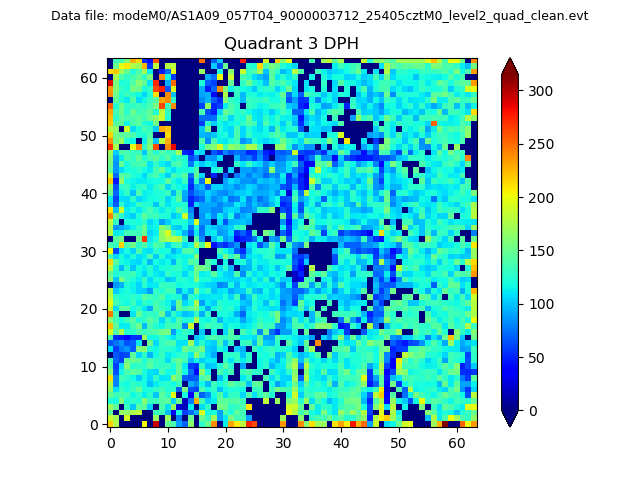 |
 |
Quadrant C |
| Plot type | Count rate plots | Images |
|---|---|---|
| Comparison with Poisson distribution Blue bars denote a histogram of data divided into 1 sec bins. Red curve is a Poisson curve with rate = median count rate of data. |
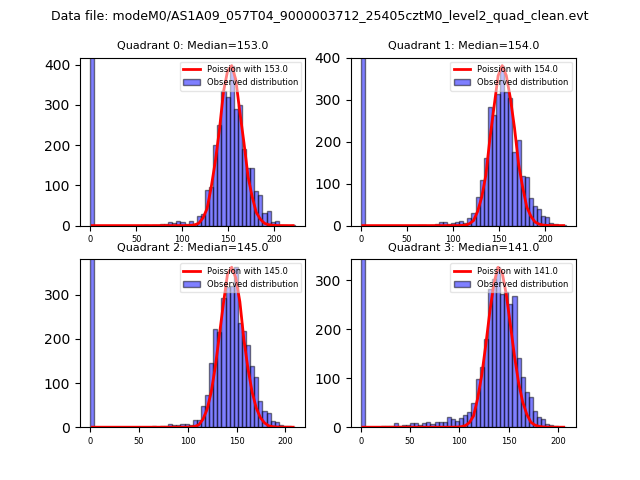 |
 |
| Quadrant-wise count rates Data is divided into 100 sec bins |
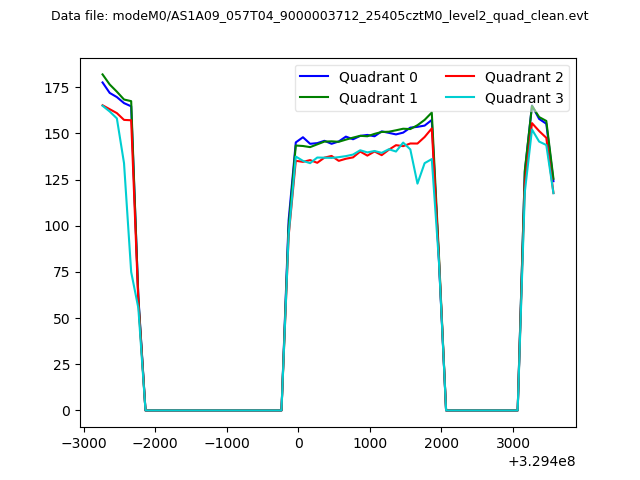 |
|
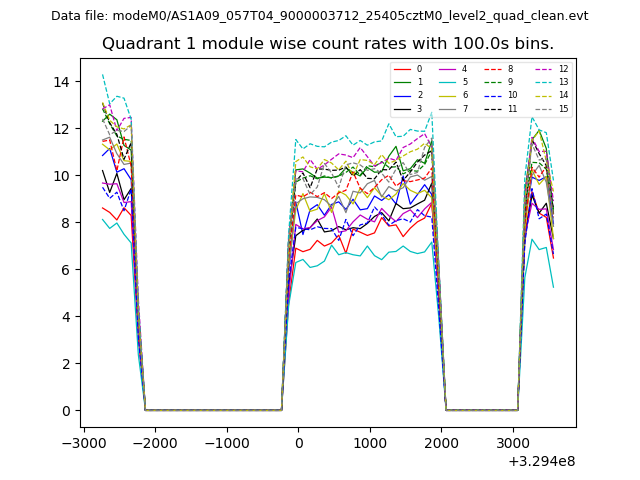
| Module-wise count rates for Quadrant A Data is divided into 100 sec bins |
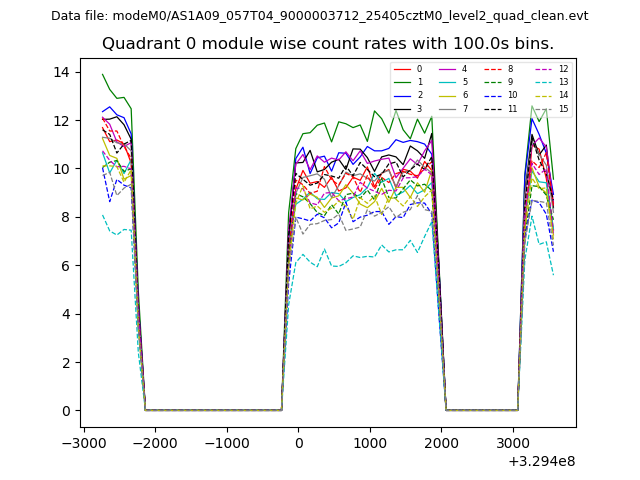 |
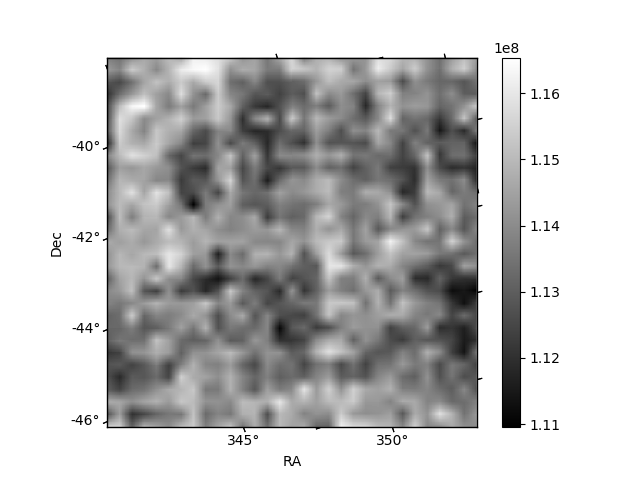 |
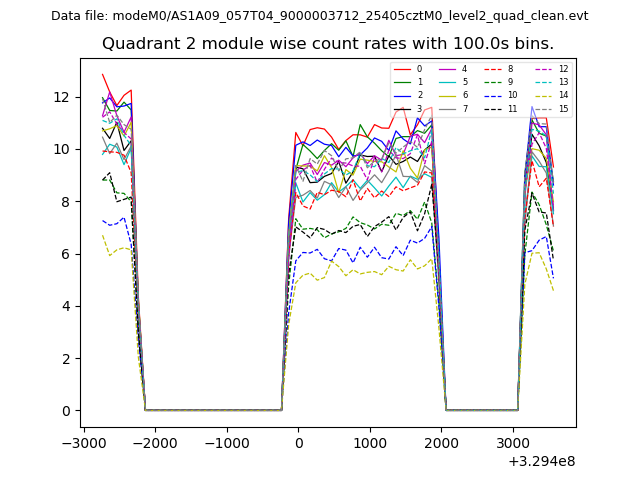
| Module-wise count rates for Quadrant B Data is divided into 100 sec bins |
 |
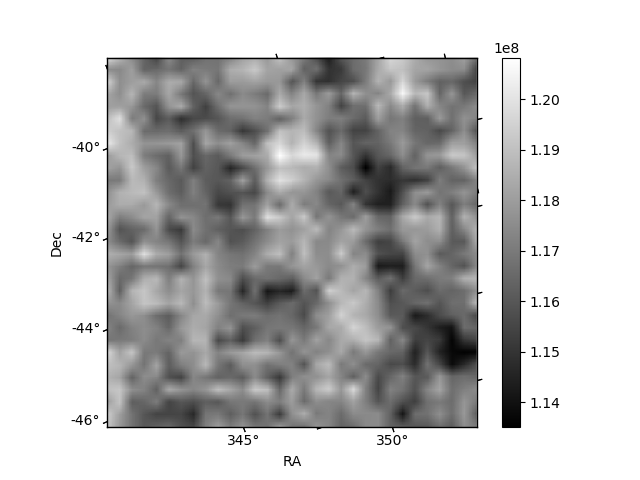 |
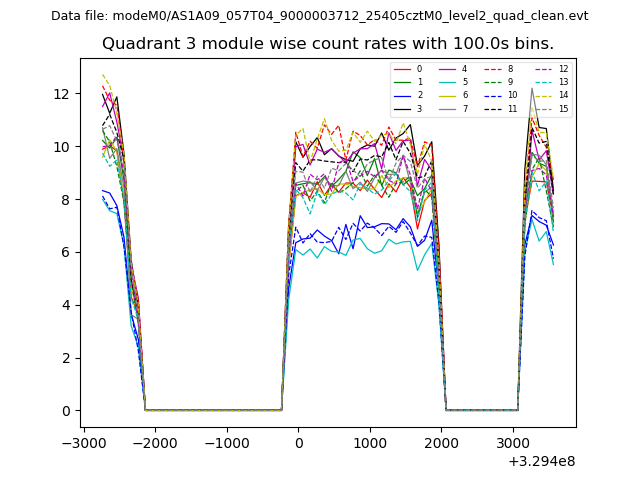
| Module-wise count rates for Quadrant C Data is divided into 100 sec bins |
 |
 |
| Module-wise count rates for Quadrant D Data is divided into 100 sec bins |
 |
 |
| Parameter | Plot |
|---|---|
| CZT HV Monitor | 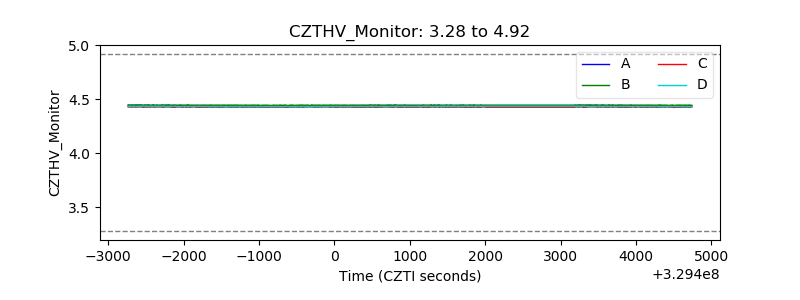 |
| D_VDD | 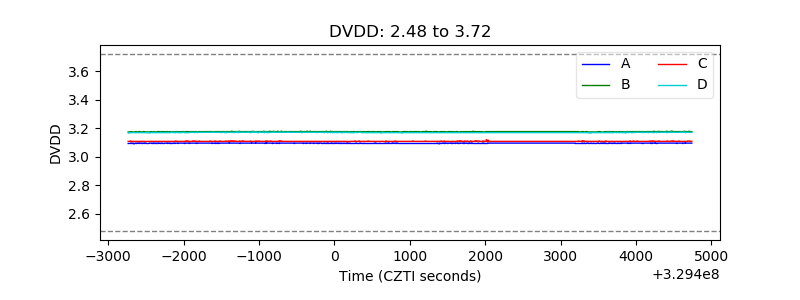 |
| Temperature 1 | 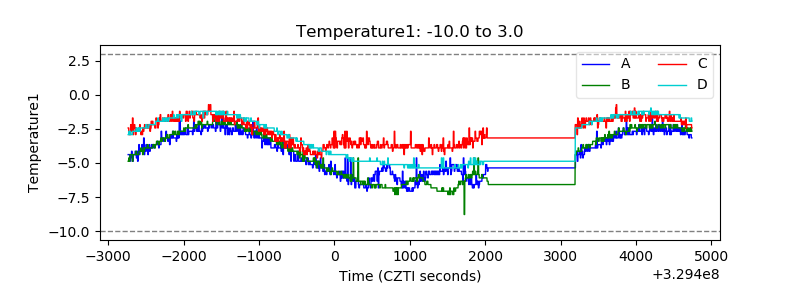 |
| Veto HV Monitor |  |
| Veto LLD | 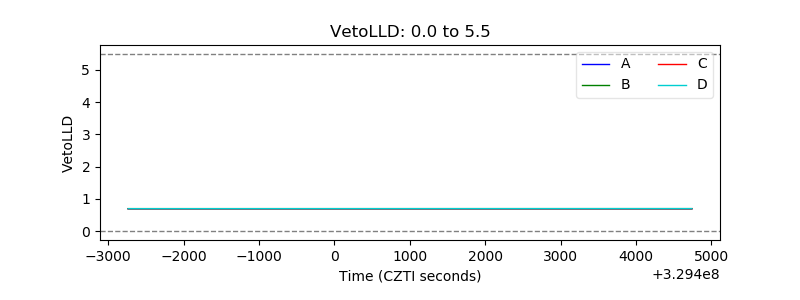 |
| Alpha Counter | 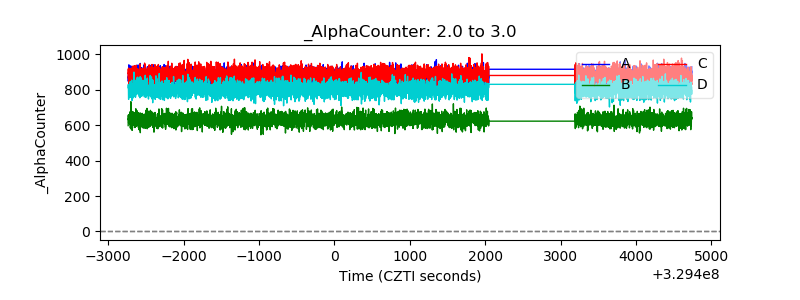 |
| _CPM_Rate | 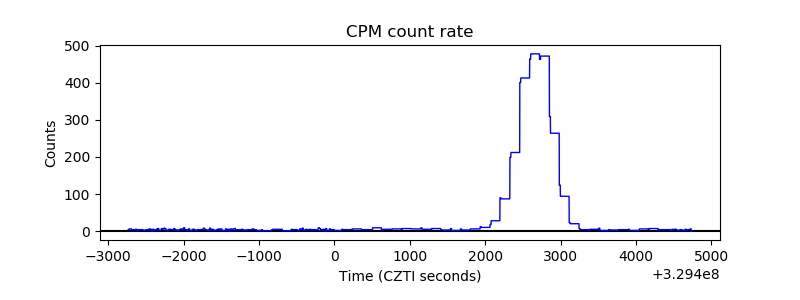 |
| CZT Counter | 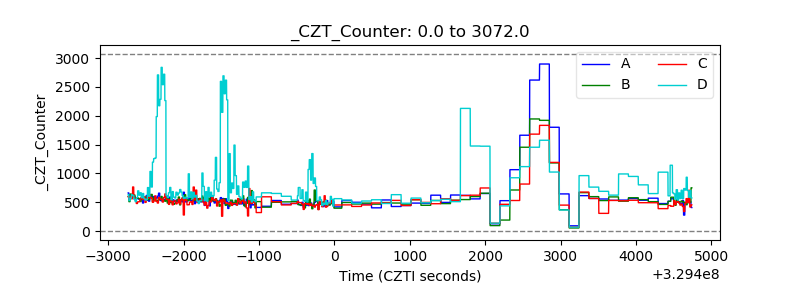 |
| +2.5 Volts monitor |  |
| +5 Volts monitor | 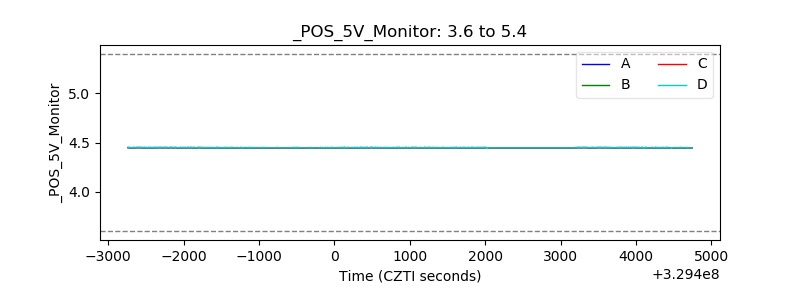 |
| _ROLL_ROT | 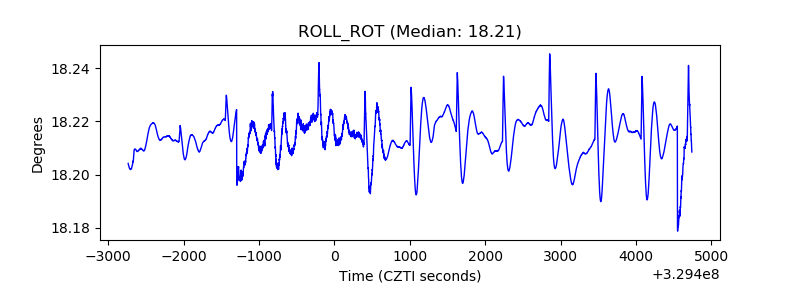 |
| _Roll_DEC | 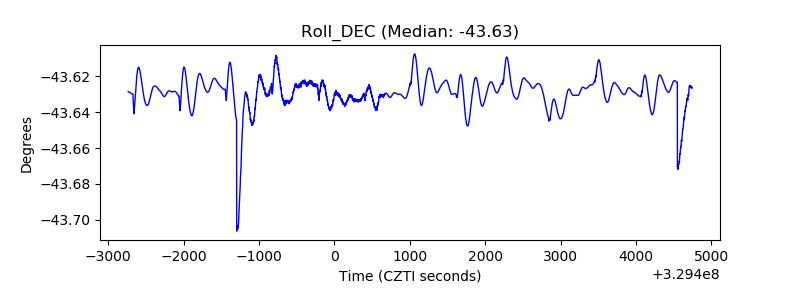 |
| _Roll_RA | 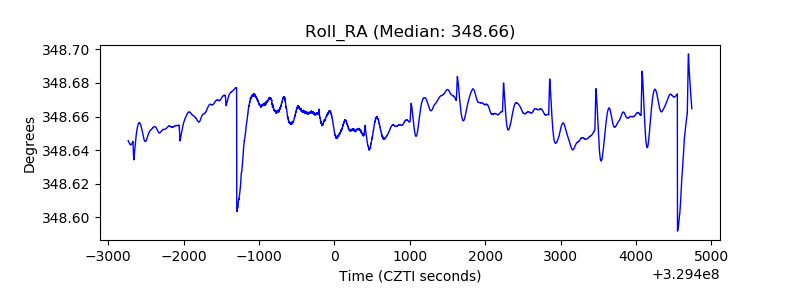 |
| Veto Counter | 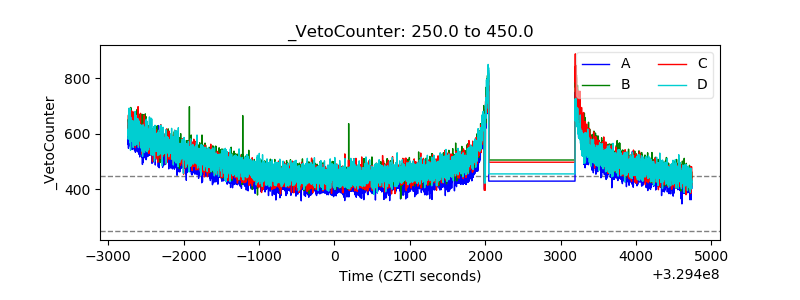 |