| Param | Original file | Final file |
|---|---|---|
| Filename | modeM0/AS1A09_057T04_9000003712_25406cztM0_level2.evt | modeM0/AS1A09_057T04_9000003712_25406cztM0_level2_quad_clean.evt |
| Size (bytes) | 541,823,040 | 77,544,000 |
| Size | 516.7 MB | 74.0 MB |
| Events in quadrant A | 3,466,736 | 489,395 |
| Events in quadrant B | 3,531,652 | 488,746 |
| Events in quadrant C | 3,434,032 | 463,595 |
| Events in quadrant D | 5,513,674 | 430,200 |
| Mode M9 | |||
|---|---|---|---|
| Quadrant | BADHDUFLAG | Total packets | Discarded packets |
| A | 0 | 10 | 0 |
| B | 0 | 11 | 0 |
| C | 0 | 11 | 0 |
| D | 0 | 11 | 0 |
| Mode M0 | |||
|---|---|---|---|
| Quadrant | BADHDUFLAG | Total packets | Discarded packets |
| A | 0 | 14244 | 0 |
| B | 0 | 14416 | 0 |
| C | 0 | 14215 | 0 |
| D | 0 | 20953 | 0 |
| Quadrant | Total seconds | Saturated seconds | Saturation percentage |
|---|---|---|---|
| A | 6832 | 84 | 1.229508% |
| B | 6832 | 103 | 1.507611% |
| C | 6832 | 100 | 1.463700% |
| D | 6832 | 414 | 6.059719% |
Noise dominated data is calculated using 1-second bins in cleaned event files. If a bin has >2000 counts, and if more than 50% of those come from <1% of pixels, then it is considered to be noise-dominated and hence unusable.
| Quadrant | # 1 sec bins | Bins with >0 counts | Bins with >2000 counts | High rate bins dominated by noise | Noise dominated (total time) | Noise dominated (detector-on time) | Marked lightcurve |
|---|---|---|---|---|---|---|---|
| A | 7647 | 6833 | 0 | 0 | 0.00% | 0.00% | 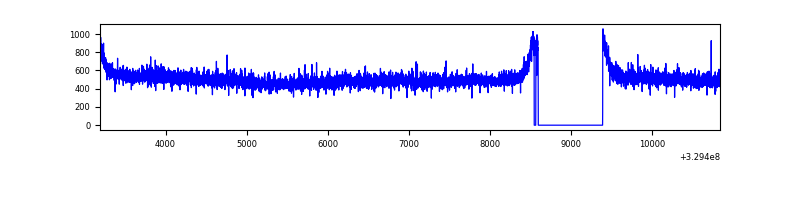 |
| B | 7647 | 6832 | 1 | 1 | 0.01% | 0.01% | 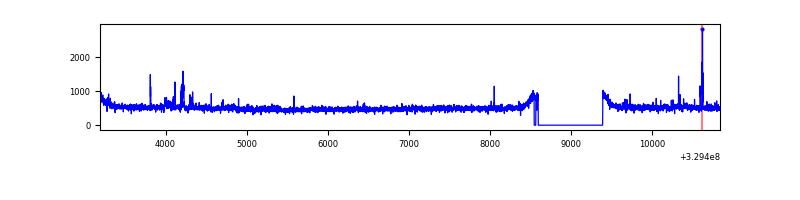 |
| C | 7647 | 6833 | 0 | 0 | 0.00% | 0.00% | 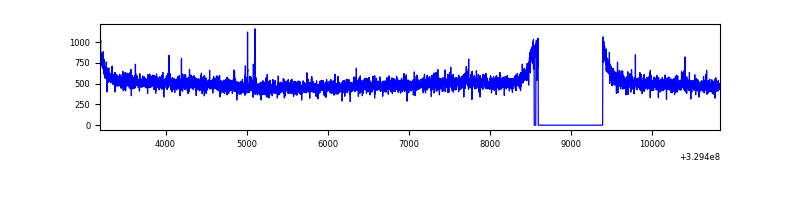 |
| D | 7647 | 6832 | 329 | 329 | 4.30% | 4.82% | 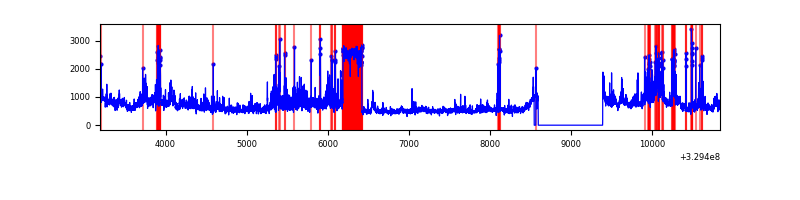 |
Top three noisy pixels from each quadrant. If the there are fewer than three noisy pixels in the level2.evt file, extra rows are filled as -1
| Pixel properties | Quadrant properties | ||||||
|---|---|---|---|---|---|---|---|
| Quadrant | DetID | PixID | Counts | Sigma | Mean | Median | Sigma |
| A | 6 | 16 | 37494 | 206.69 | 886 | 869 | 177.2 |
| A | 15 | 173 | 10995 | 57.14 | 886 | 869 | 177.2 |
| A | 13 | 254 | 9750 | 50.12 | 886 | 869 | 177.2 |
| B | 3 | 112 | 46942 | 278.2 | 870 | 850 | 165.7 |
| B | 0 | 229 | 39206 | 231.5 | 870 | 850 | 165.7 |
| B | 0 | 190 | 30270 | 177.57 | 870 | 850 | 165.7 |
| C | 14 | 238 | 135135 | 687.47 | 839 | 846 | 195.3 |
| C | 7 | 247 | 23477 | 115.86 | 839 | 846 | 195.3 |
| C | 13 | 61 | 5861 | 25.67 | 839 | 846 | 195.3 |
| D | 7 | 238 | 1211814 | 6081.56 | 830 | 807 | 199.1 |
| D | 1 | 52 | 506276 | 2538.42 | 830 | 807 | 199.1 |
| D | 8 | 195 | 293092 | 1467.83 | 830 | 807 | 199.1 |
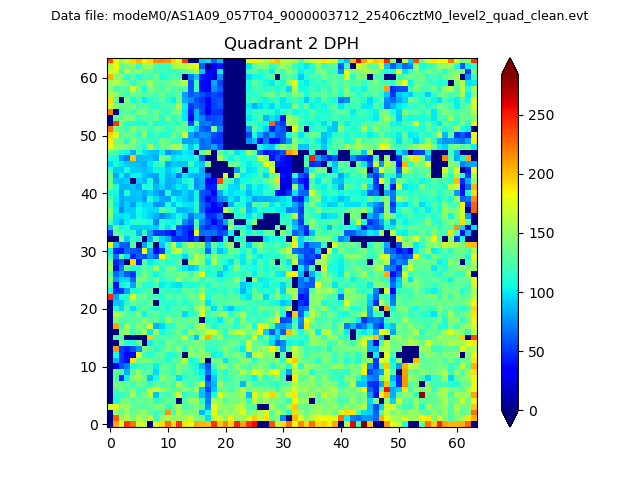
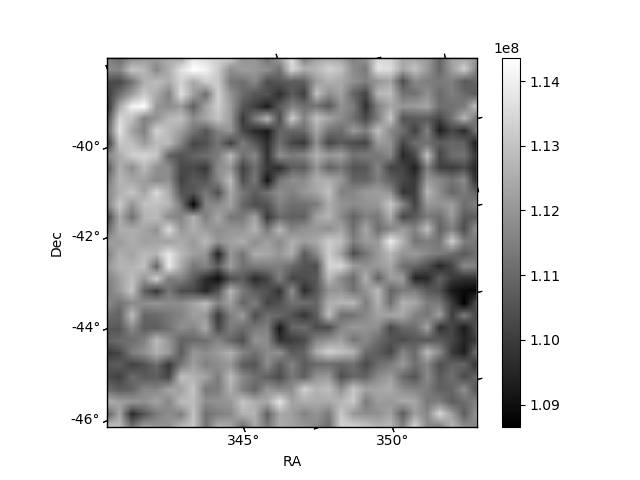
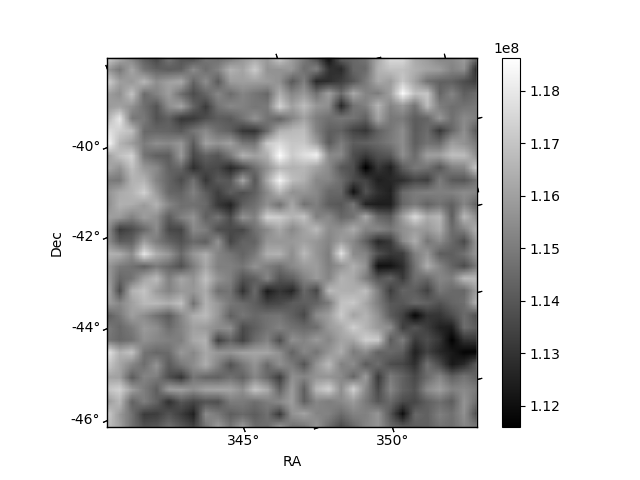
Histogram calculated using DETX and DETY for each event in the final _common_clean file
| Quadrant A |  |
 |
Quadrant B |
|---|---|---|---|
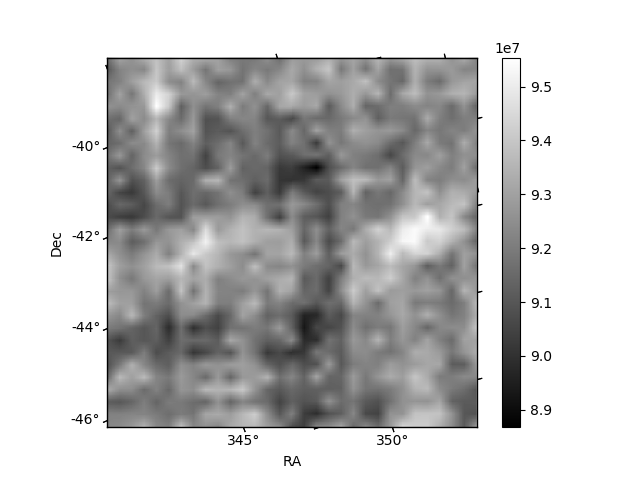
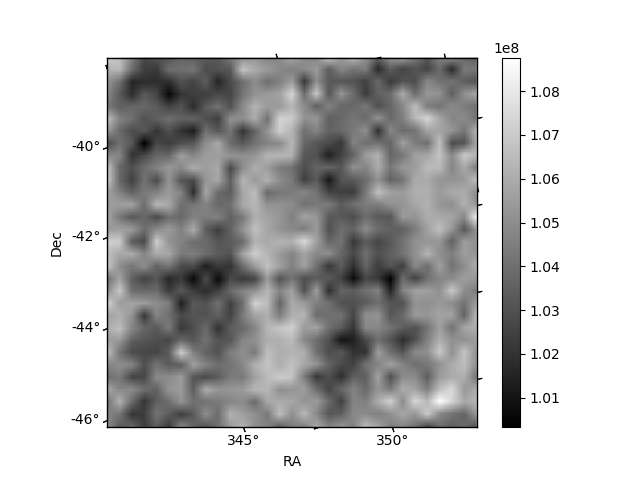
| Quadrant D | 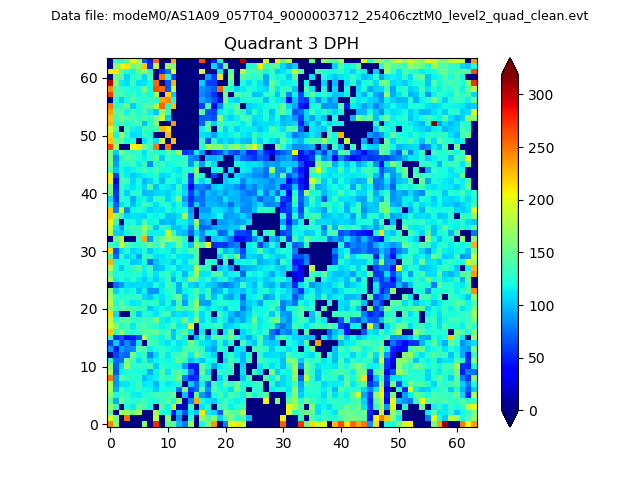 |
 |
Quadrant C |
| Plot type | Count rate plots | Images |
|---|---|---|
| Comparison with Poisson distribution Blue bars denote a histogram of data divided into 1 sec bins. Red curve is a Poisson curve with rate = median count rate of data. |
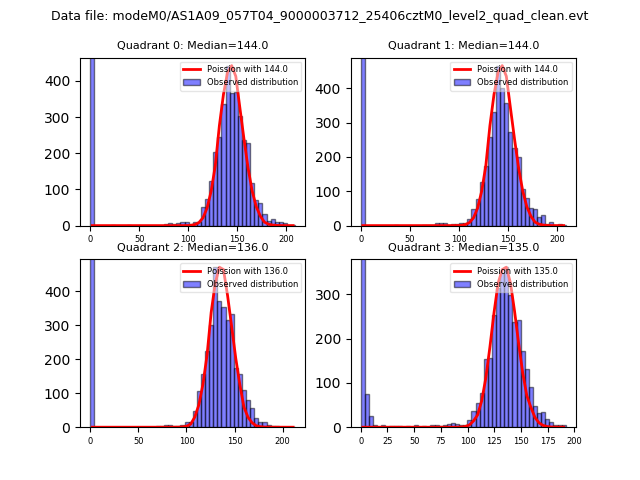 |
 |
| Quadrant-wise count rates Data is divided into 100 sec bins |
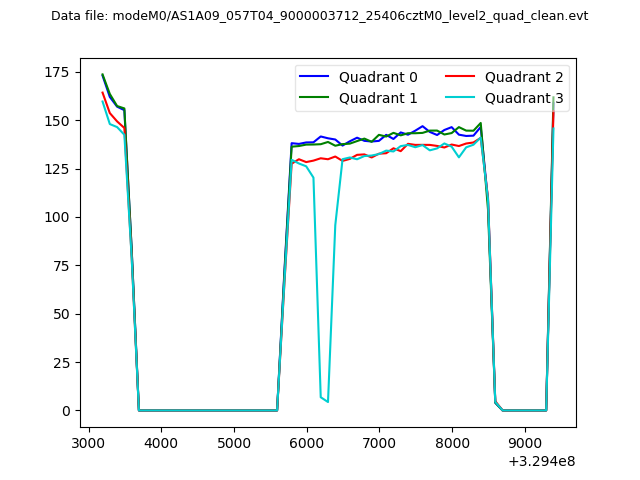 |
|
| Module-wise count rates for Quadrant A Data is divided into 100 sec bins |
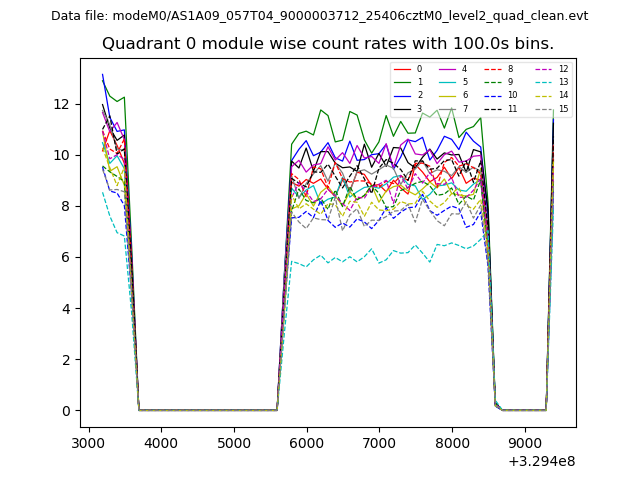 |
 |
| Module-wise count rates for Quadrant B Data is divided into 100 sec bins |
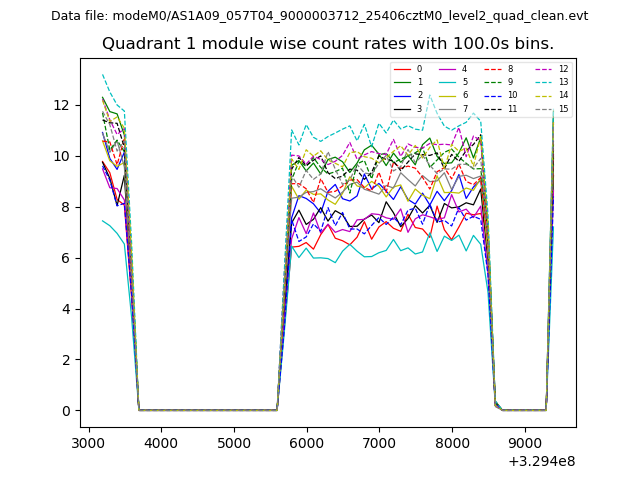 |
 |
| Module-wise count rates for Quadrant C Data is divided into 100 sec bins |
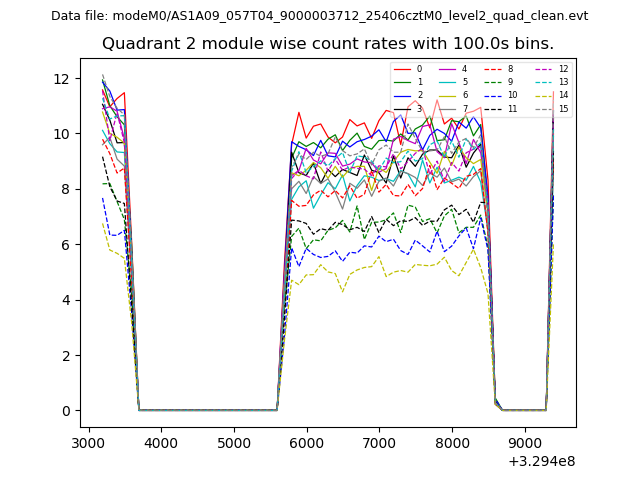 |
 |
| Module-wise count rates for Quadrant D Data is divided into 100 sec bins |
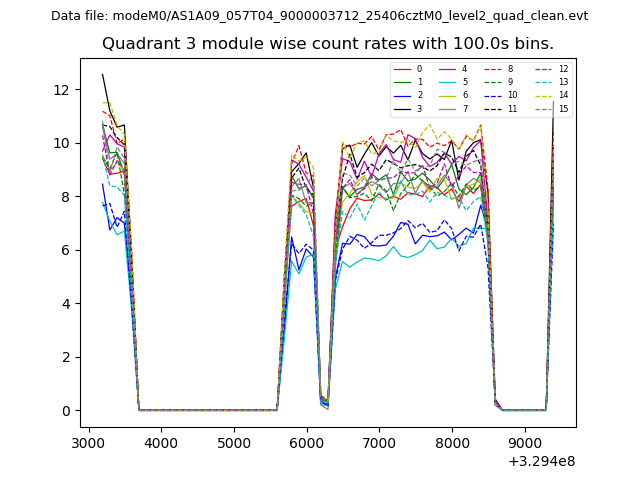 |
 |
| Parameter | Plot |
|---|---|
| CZT HV Monitor | 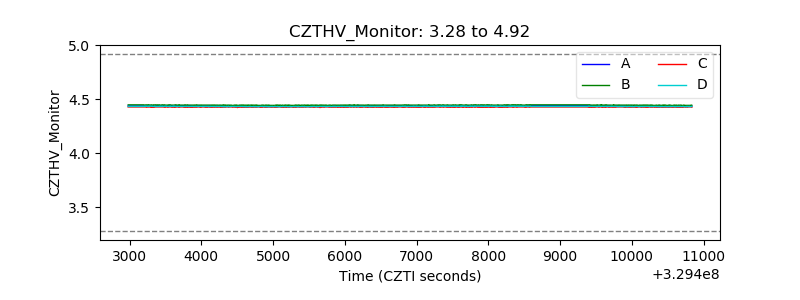 |
| D_VDD | 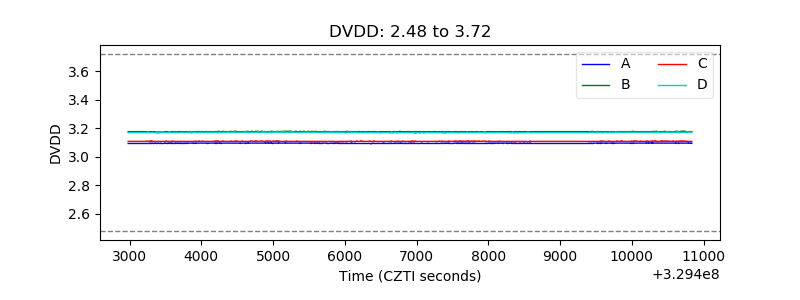 |
| Temperature 1 | 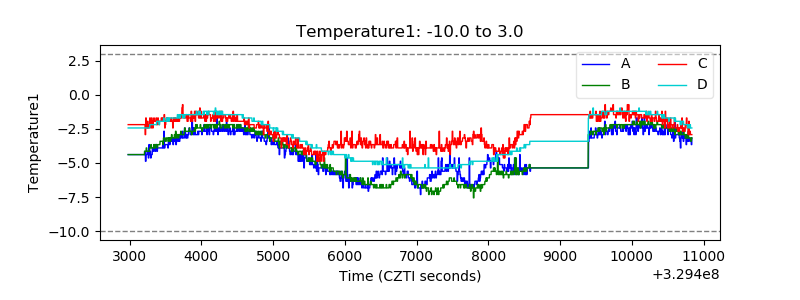 |
| Veto HV Monitor |  |
| Veto LLD | 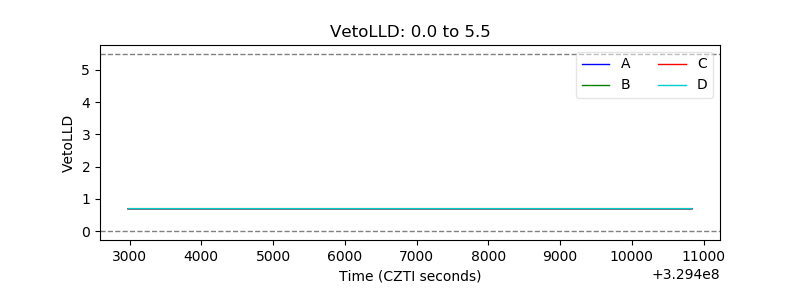 |
| Alpha Counter | 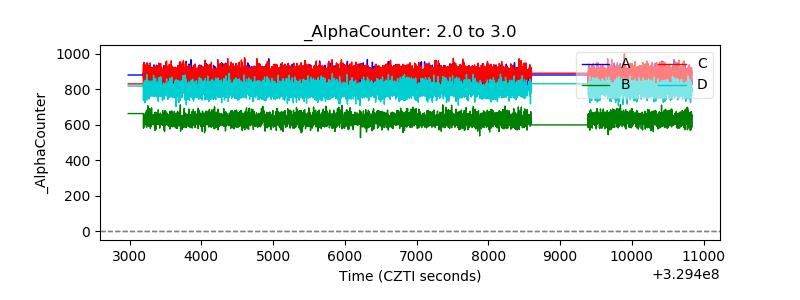 |
| _CPM_Rate | 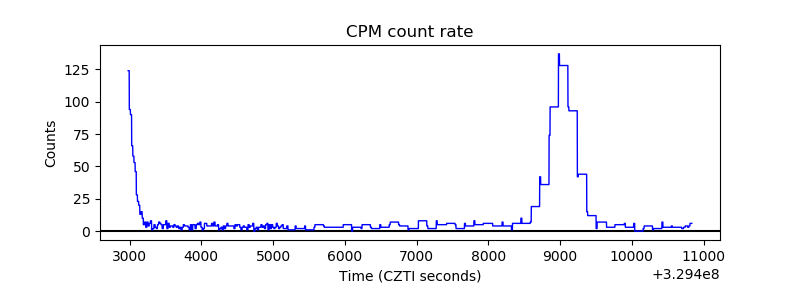 |
| CZT Counter | 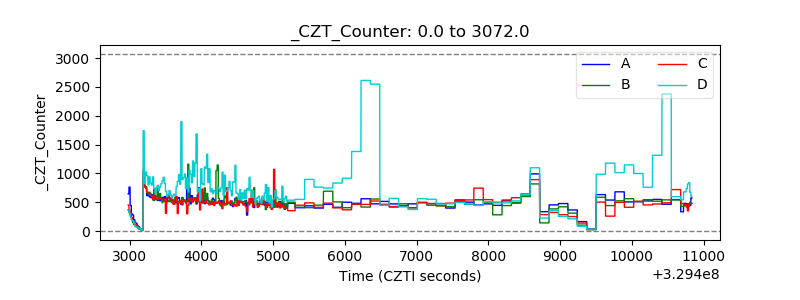 |
| +2.5 Volts monitor | 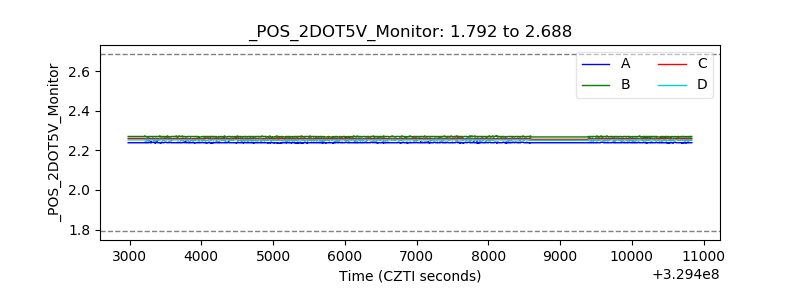 |
| +5 Volts monitor | 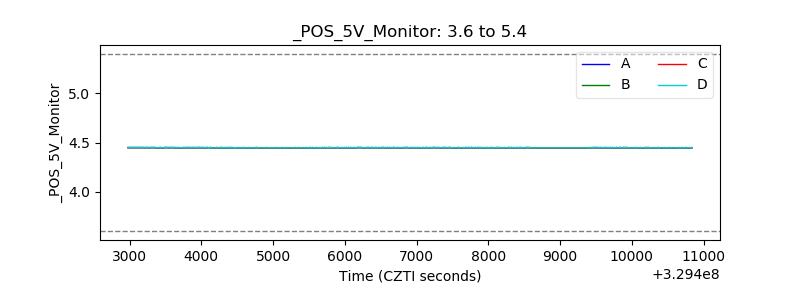 |
| _ROLL_ROT | 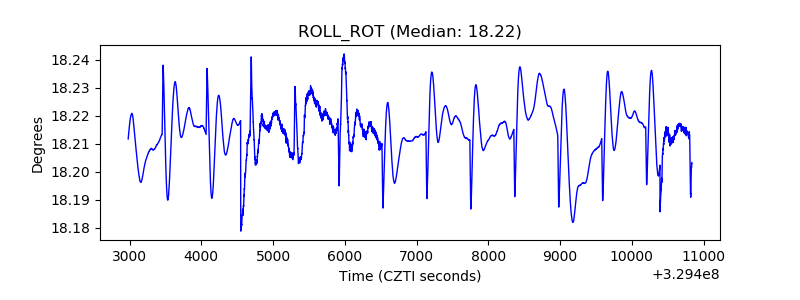 |
| _Roll_DEC | 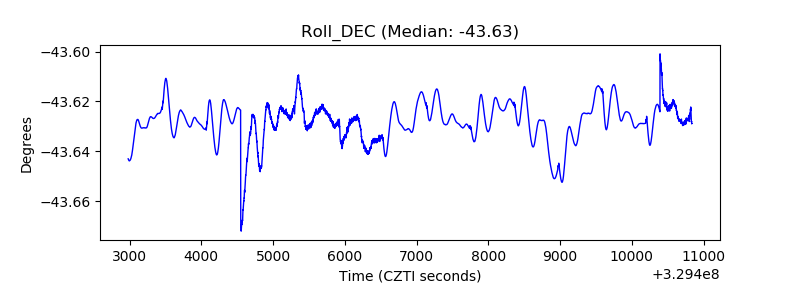 |
| _Roll_RA |  |
| Veto Counter | 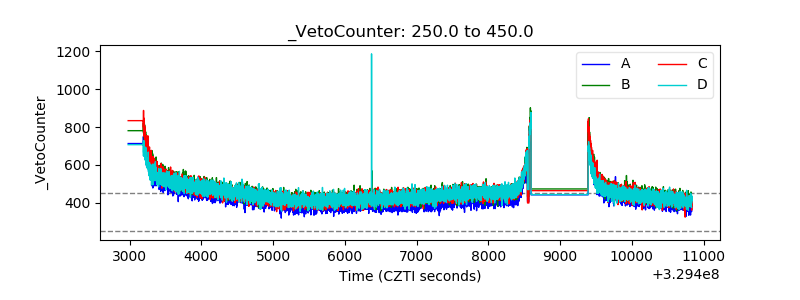 |