| Param | Original file | Final file |
|---|---|---|
| Filename | modeM0/AS1A09_057T04_9000003712_25407cztM0_level2.evt | modeM0/AS1A09_057T04_9000003712_25407cztM0_level2_quad_clean.evt |
| Size (bytes) | 263,350,080 | 31,167,360 |
| Size | 251.2 MB | 29.7 MB |
| Events in quadrant A | 1,603,214 | 182,350 |
| Events in quadrant B | 1,705,711 | 179,676 |
| Events in quadrant C | 1,578,036 | 171,535 |
| Events in quadrant D | 2,856,782 | 168,888 |
| Mode M0 | |||
|---|---|---|---|
| Quadrant | BADHDUFLAG | Total packets | Discarded packets |
| A | 0 | 6847 | 0 |
| B | 0 | 7088 | 0 |
| C | 0 | 6838 | 0 |
| D | 0 | 10932 | 0 |
| Quadrant | Total seconds | Saturated seconds | Saturation percentage |
|---|---|---|---|
| A | 3392 | 2 | 0.058962% |
| B | 3392 | 18 | 0.530660% |
| C | 3393 | 13 | 0.383142% |
| D | 3393 | 88 | 2.593575% |
Noise dominated data is calculated using 1-second bins in cleaned event files. If a bin has >2000 counts, and if more than 50% of those come from <1% of pixels, then it is considered to be noise-dominated and hence unusable.
| Quadrant | # 1 sec bins | Bins with >0 counts | Bins with >2000 counts | High rate bins dominated by noise | Noise dominated (total time) | Noise dominated (detector-on time) | Marked lightcurve |
|---|---|---|---|---|---|---|---|
| A | 3392 | 3392 | 0 | 0 | 0.00% | 0.00% |  |
| B | 3392 | 3392 | 13 | 13 | 0.38% | 0.38% |  |
| C | 3393 | 3393 | 0 | 0 | 0.00% | 0.00% |  |
| D | 3393 | 3393 | 80 | 80 | 2.36% | 2.36% | 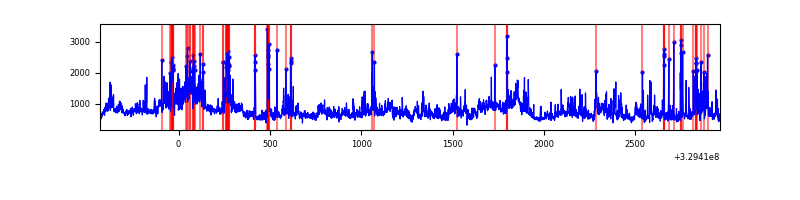 |
Top three noisy pixels from each quadrant. If the there are fewer than three noisy pixels in the level2.evt file, extra rows are filled as -1
| Pixel properties | Quadrant properties | ||||||
|---|---|---|---|---|---|---|---|
| Quadrant | DetID | PixID | Counts | Sigma | Mean | Median | Sigma |
| A | 6 | 16 | 32079 | 383.74 | 406 | 397 | 82.6 |
| A | 13 | 254 | 5567 | 62.62 | 406 | 397 | 82.6 |
| A | 3 | 137 | 3723 | 40.28 | 406 | 397 | 82.6 |
| B | 3 | 112 | 96753 | 1246.07 | 399 | 390 | 77.3 |
| B | 0 | 229 | 31398 | 400.96 | 399 | 390 | 77.3 |
| B | 12 | 111 | 9162 | 113.43 | 399 | 390 | 77.3 |
| C | 14 | 238 | 62041 | 679.09 | 384 | 386 | 90.8 |
| C | 7 | 247 | 10251 | 108.66 | 384 | 386 | 90.8 |
| C | 3 | 233 | 5943 | 61.21 | 384 | 386 | 90.8 |
| D | 2 | 72 | 349694 | 3701.06 | 388 | 376 | 94.4 |
| D | 1 | 52 | 334546 | 3540.57 | 388 | 376 | 94.4 |
| D | 7 | 238 | 315666 | 3340.53 | 388 | 376 | 94.4 |
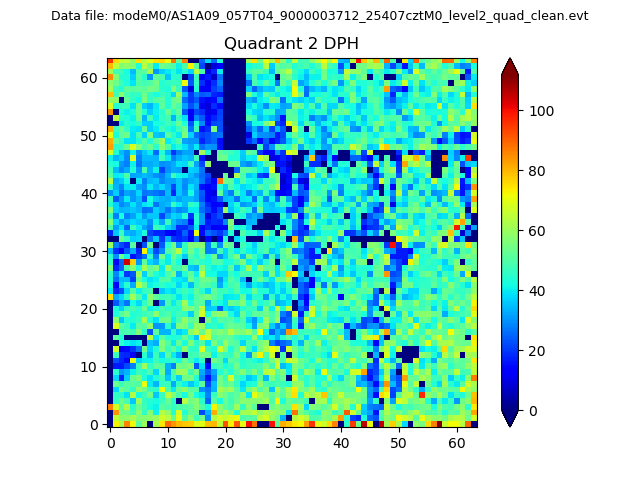
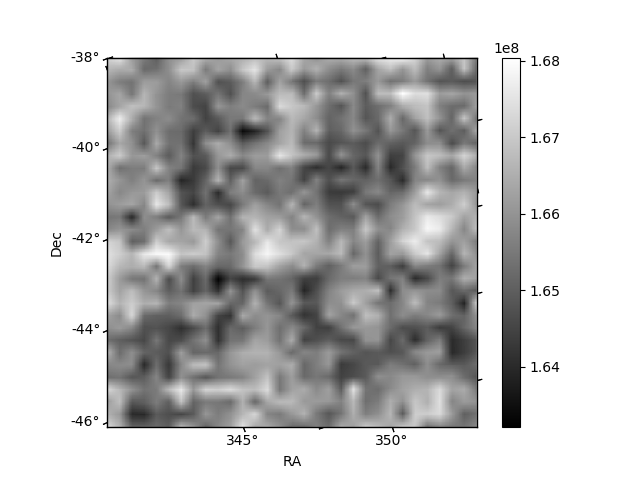
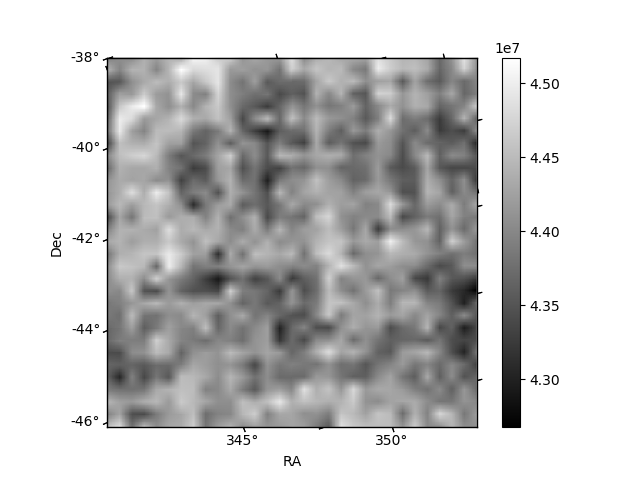
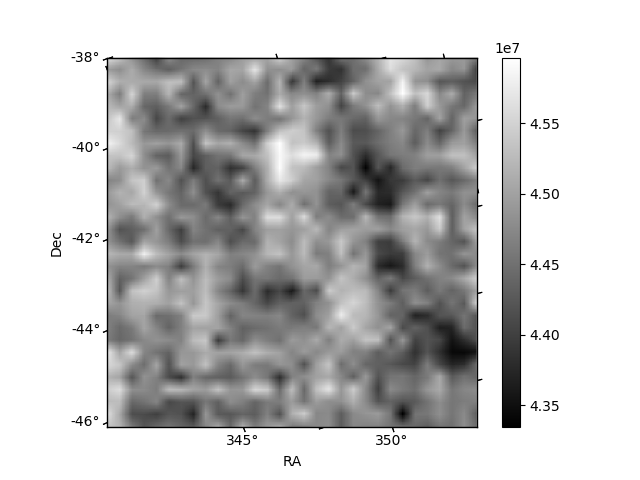
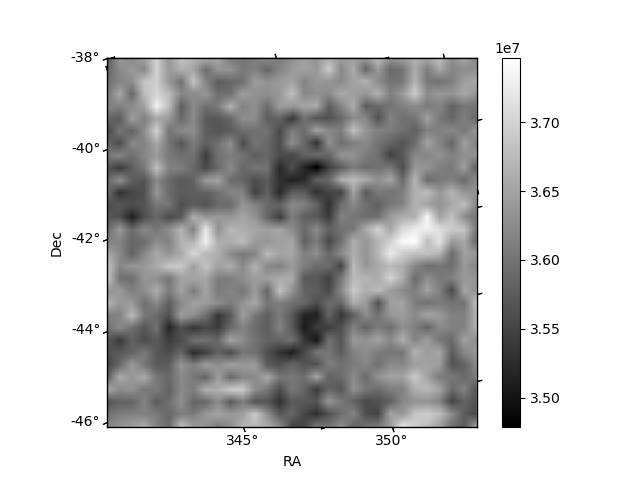
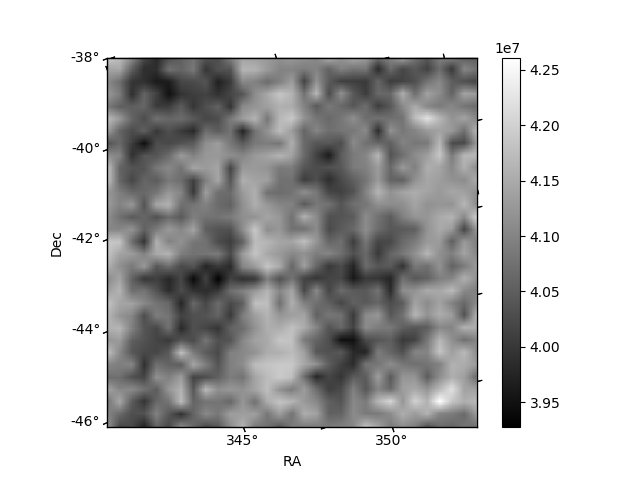
Histogram calculated using DETX and DETY for each event in the final _common_clean file
| Quadrant A | 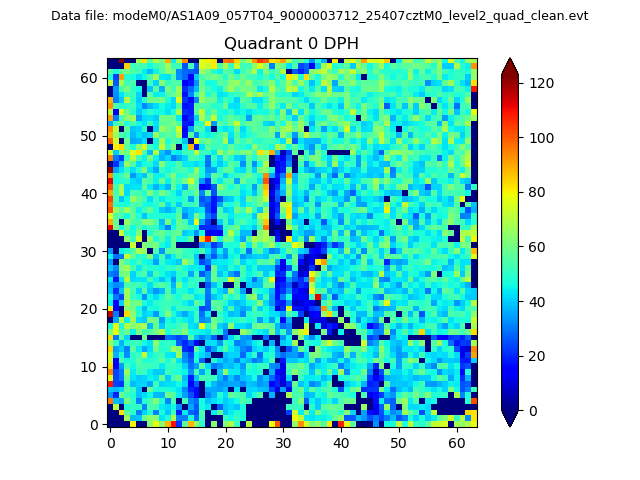 |
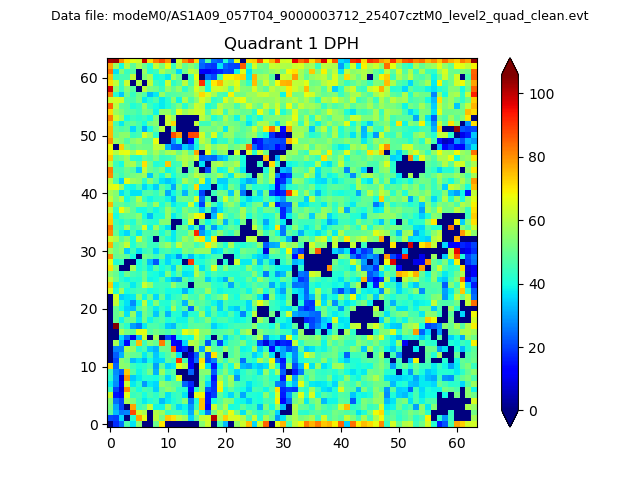 |
Quadrant B |
|---|---|---|---|
| Quadrant D | 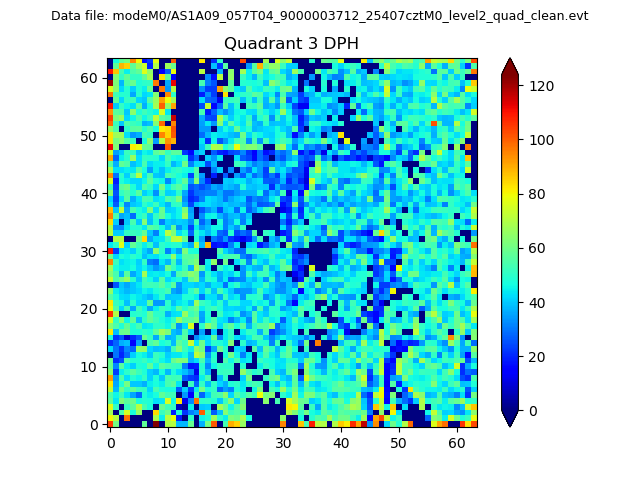 |
 |
Quadrant C |
| Plot type | Count rate plots | Images |
|---|---|---|
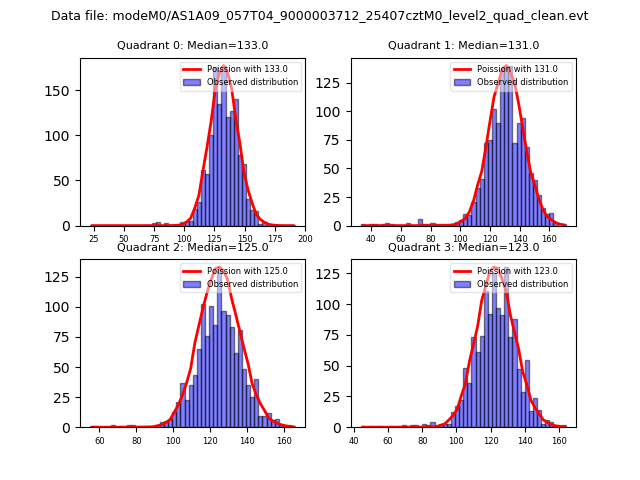
| Comparison with Poisson distribution Blue bars denote a histogram of data divided into 1 sec bins. Red curve is a Poisson curve with rate = median count rate of data. |
 |
 |
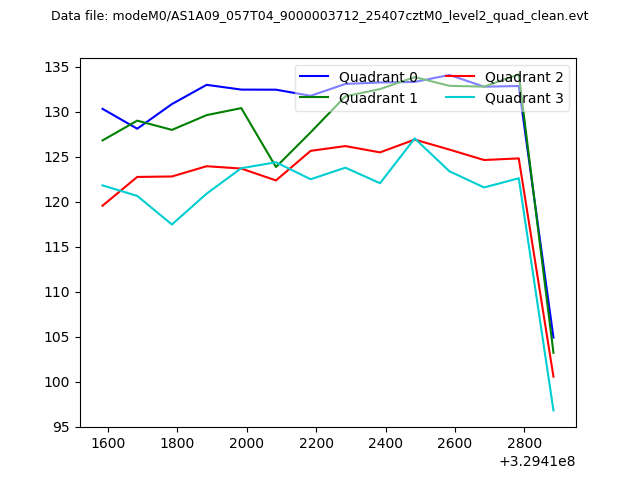
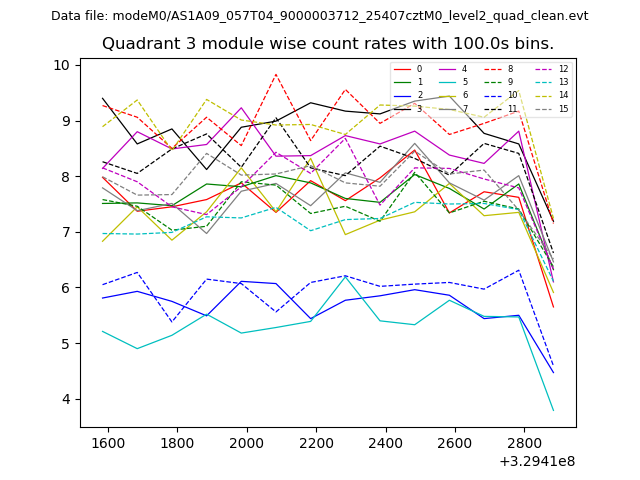
| Quadrant-wise count rates Data is divided into 100 sec bins |
 |
|
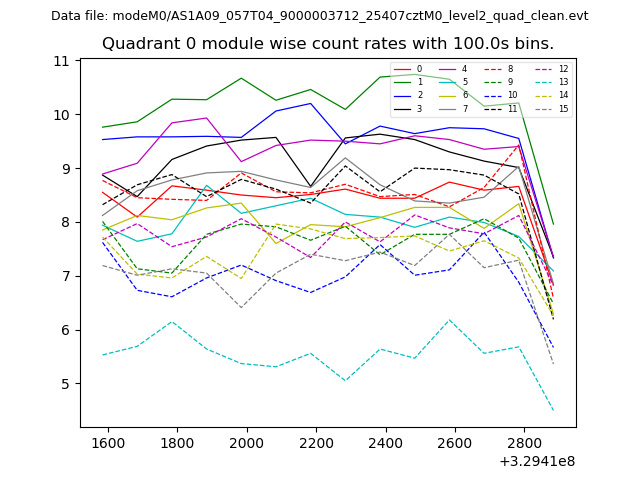
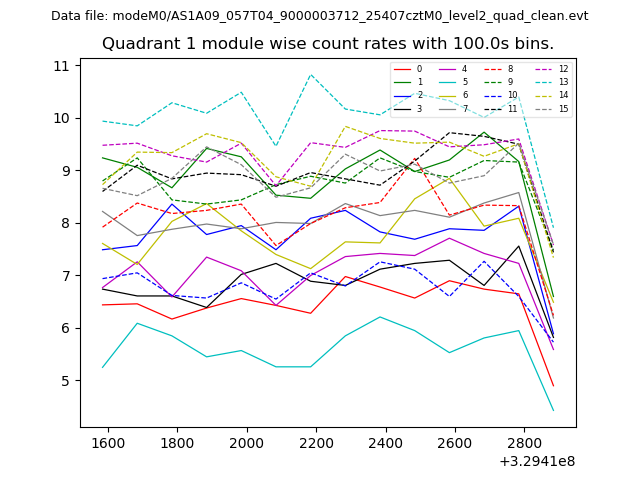
| Module-wise count rates for Quadrant A Data is divided into 100 sec bins |
 |
 |
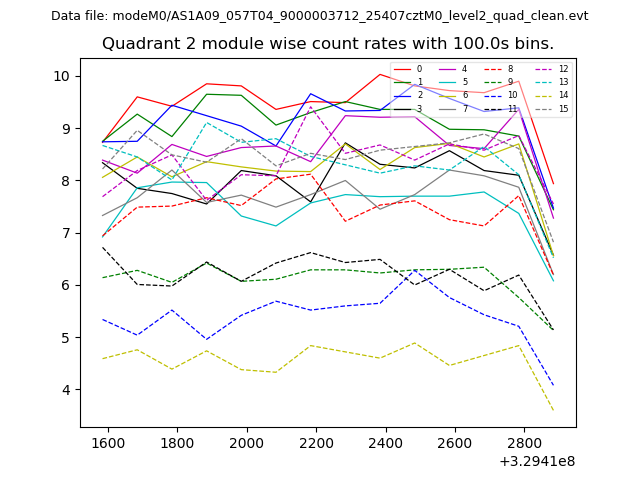
| Module-wise count rates for Quadrant B Data is divided into 100 sec bins |
 |
 |
| Module-wise count rates for Quadrant C Data is divided into 100 sec bins |
 |
 |
| Module-wise count rates for Quadrant D Data is divided into 100 sec bins |
 |
 |
| Parameter | Plot |
|---|---|
| CZT HV Monitor | 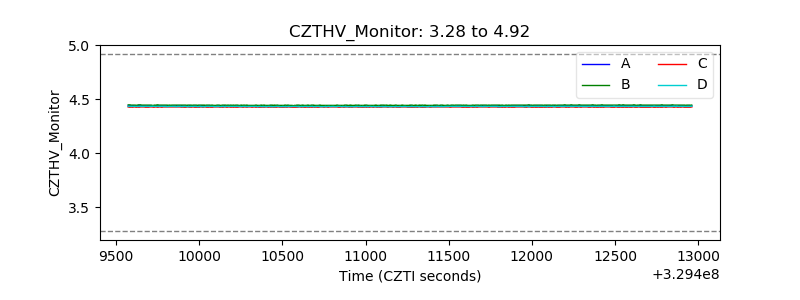 |
| D_VDD | 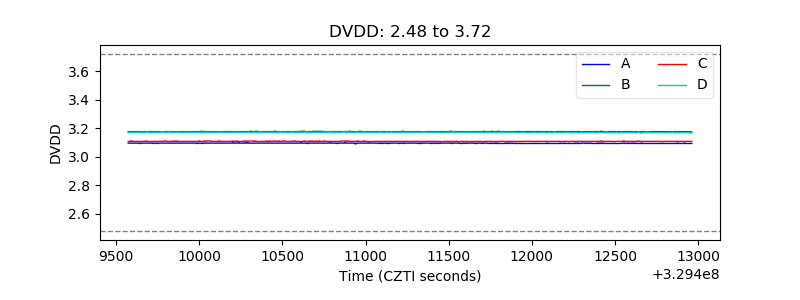 |
| Temperature 1 | 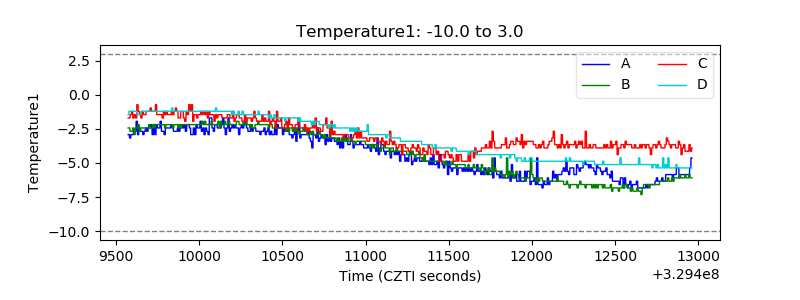 |
| Veto HV Monitor | 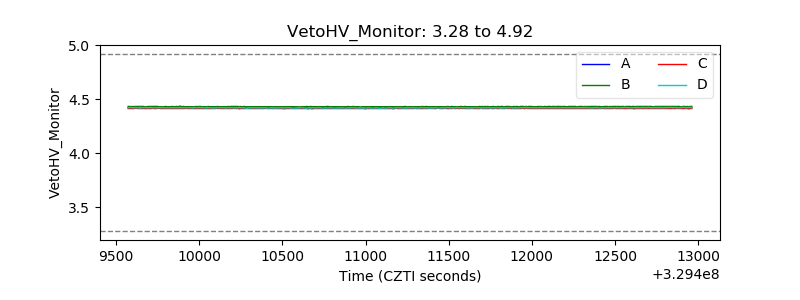 |
| Veto LLD | 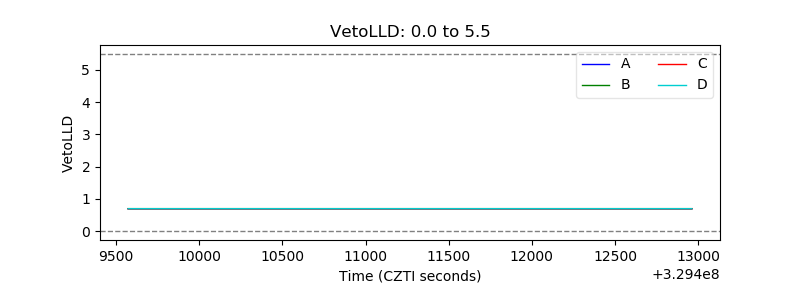 |
| Alpha Counter | 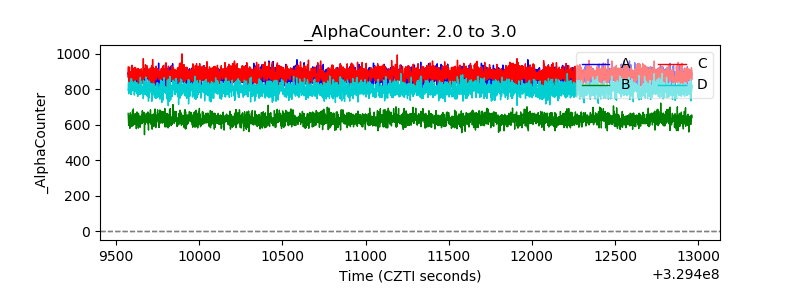 |
| _CPM_Rate | 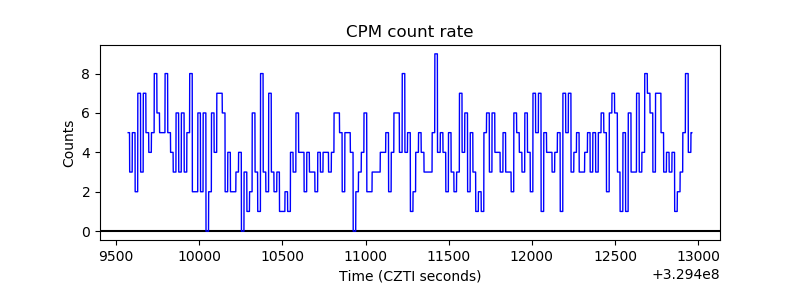 |
| CZT Counter | 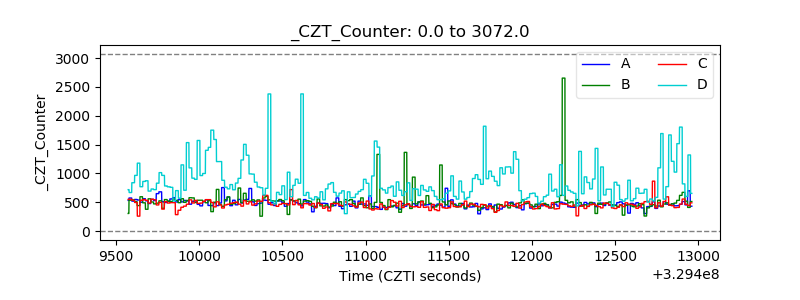 |
| +2.5 Volts monitor |  |
| +5 Volts monitor |  |
| _ROLL_ROT | 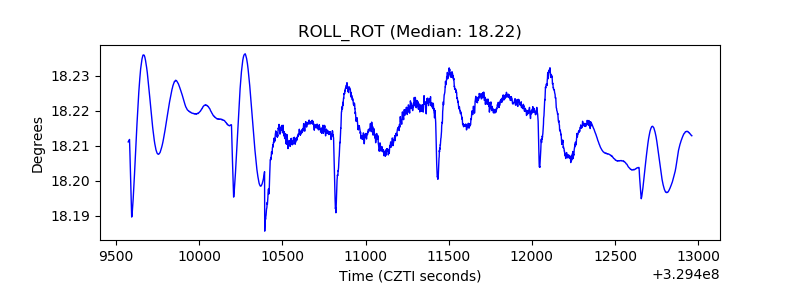 |
| _Roll_DEC | 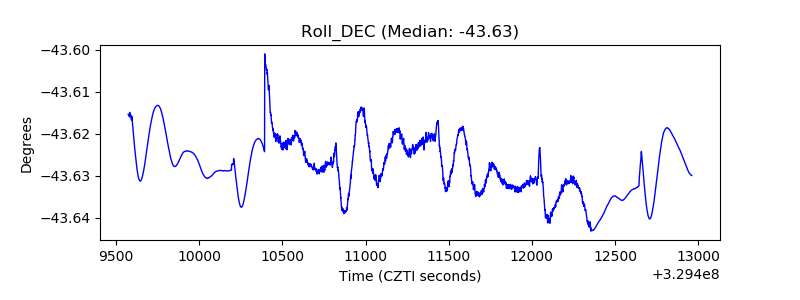 |
| _Roll_RA | 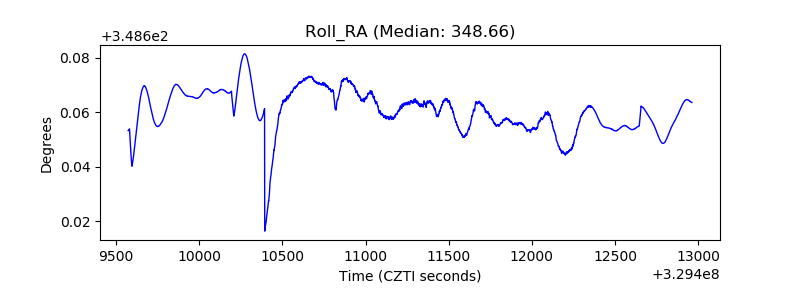 |
| Veto Counter | 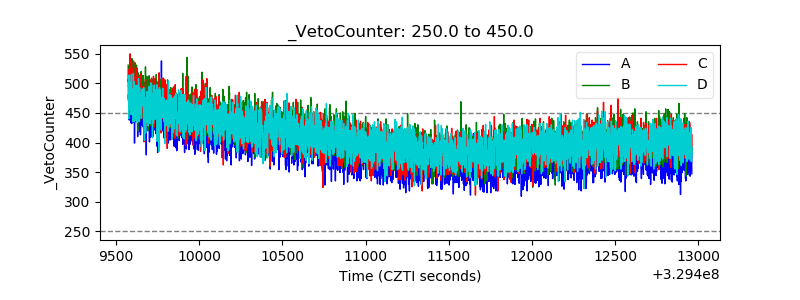 |