| Param | Original file | Final file |
|---|---|---|
| Filename | modeM0/AS1A09_047T01_9000003714_25407cztM0_level2.evt | modeM0/AS1A09_047T01_9000003714_25407cztM0_level2_quad_clean.evt |
| Size (bytes) | 221,757,120 | 55,143,360 |
| Size | 211.5 MB | 52.6 MB |
| Events in quadrant A | 1,504,846 | 376,184 |
| Events in quadrant B | 1,648,135 | 379,133 |
| Events in quadrant C | 1,480,713 | 360,943 |
| Events in quadrant D | 1,887,155 | 350,383 |
| Mode M9 | |||
|---|---|---|---|
| Quadrant | BADHDUFLAG | Total packets | Discarded packets |
| A | 0 | 4 | 0 |
| B | 0 | 4 | 0 |
| C | 0 | 4 | 0 |
| D | 0 | 4 | 0 |
| Mode M0 | |||
|---|---|---|---|
| Quadrant | BADHDUFLAG | Total packets | Discarded packets |
| A | 0 | 6131 | 0 |
| B | 0 | 6588 | 0 |
| C | 0 | 6112 | 0 |
| D | 0 | 7405 | 0 |
| Quadrant | Total seconds | Saturated seconds | Saturation percentage |
|---|---|---|---|
| A | 2840 | 62 | 2.183099% |
| B | 2839 | 88 | 3.099683% |
| C | 2839 | 64 | 2.254315% |
| D | 2839 | 121 | 4.262064% |
Noise dominated data is calculated using 1-second bins in cleaned event files. If a bin has >2000 counts, and if more than 50% of those come from <1% of pixels, then it is considered to be noise-dominated and hence unusable.
| Quadrant | # 1 sec bins | Bins with >0 counts | Bins with >2000 counts | High rate bins dominated by noise | Noise dominated (total time) | Noise dominated (detector-on time) | Marked lightcurve |
|---|---|---|---|---|---|---|---|
| A | 3220 | 2840 | 0 | 0 | 0.00% | 0.00% |  |
| B | 3219 | 2839 | 15 | 15 | 0.47% | 0.53% |  |
| C | 3219 | 2839 | 0 | 0 | 0.00% | 0.00% |  |
| D | 3219 | 2840 | 68 | 68 | 2.11% | 2.39% |  |
Top three noisy pixels from each quadrant. If the there are fewer than three noisy pixels in the level2.evt file, extra rows are filled as -1
| Pixel properties | Quadrant properties | ||||||
|---|---|---|---|---|---|---|---|
| Quadrant | DetID | PixID | Counts | Sigma | Mean | Median | Sigma |
| A | 6 | 16 | 26907 | 333.37 | 383 | 373 | 79.6 |
| A | 13 | 254 | 3891 | 44.2 | 383 | 373 | 79.6 |
| A | 3 | 137 | 3761 | 42.57 | 383 | 373 | 79.6 |
| B | 3 | 112 | 152693 | 2044.49 | 373 | 362 | 74.5 |
| B | 0 | 229 | 21236 | 280.16 | 373 | 362 | 74.5 |
| B | 12 | 111 | 9013 | 116.11 | 373 | 362 | 74.5 |
| C | 14 | 238 | 57886 | 662.55 | 360 | 361 | 86.8 |
| C | 3 | 233 | 7800 | 85.68 | 360 | 361 | 86.8 |
| C | 7 | 247 | 5759 | 62.17 | 360 | 361 | 86.8 |
| D | 7 | 238 | 298672 | 3340.15 | 364 | 353 | 89.3 |
| D | 8 | 195 | 130929 | 1462.0 | 364 | 353 | 89.3 |
| D | 1 | 52 | 39781 | 441.46 | 364 | 353 | 89.3 |
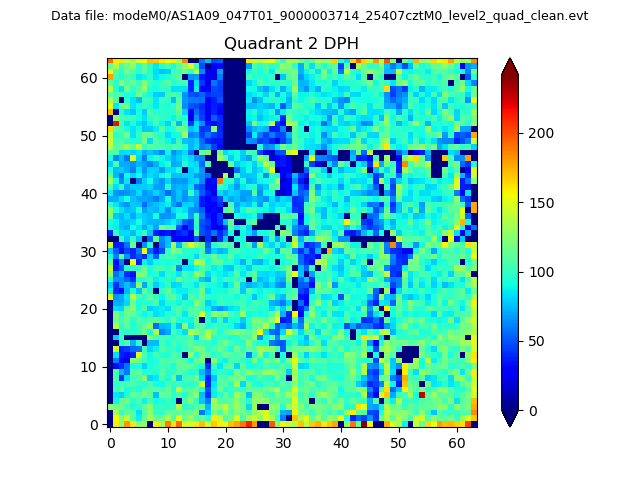
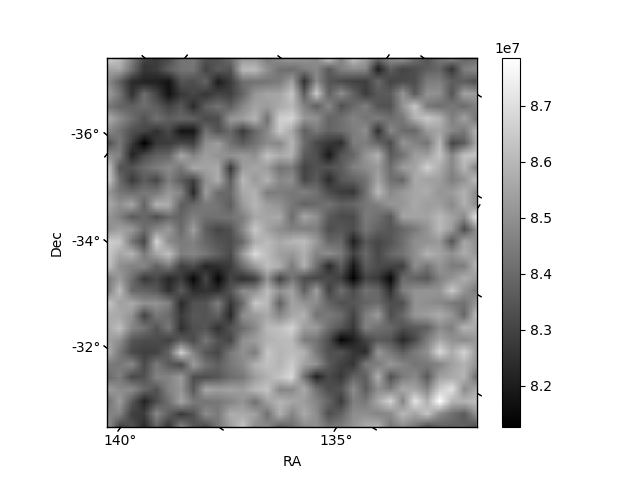
Histogram calculated using DETX and DETY for each event in the final _common_clean file
| Quadrant A | 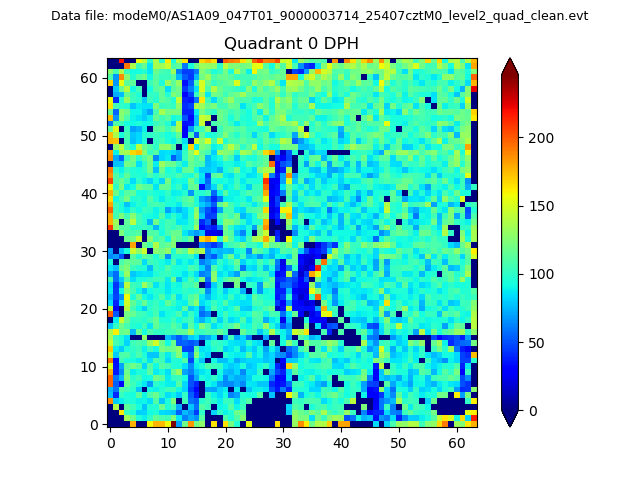 |
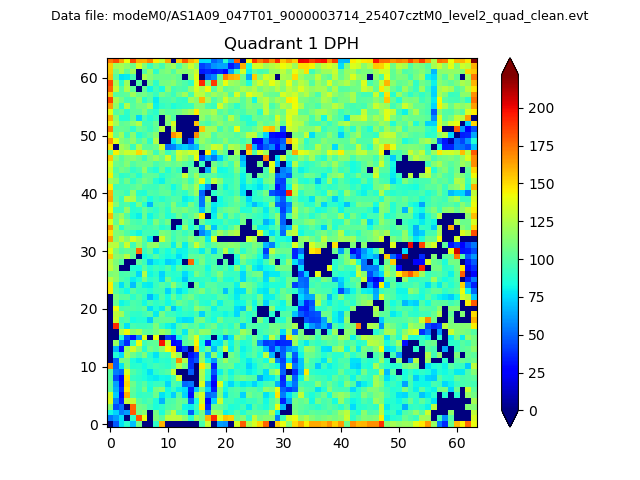 |
Quadrant B |
|---|---|---|---|
| Quadrant D | 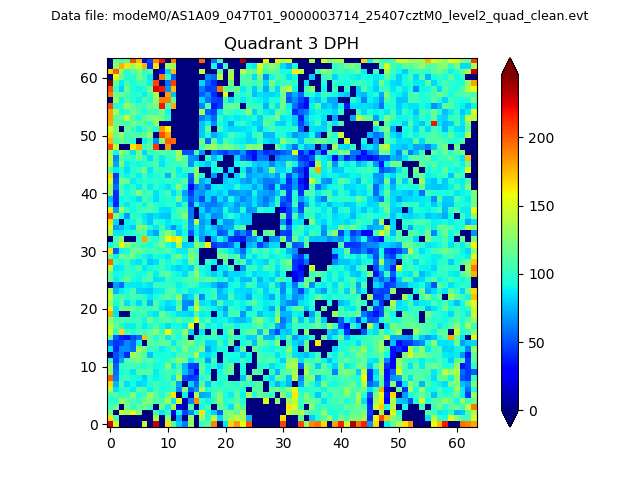 |
 |
Quadrant C |
| Plot type | Count rate plots | Images |
|---|---|---|
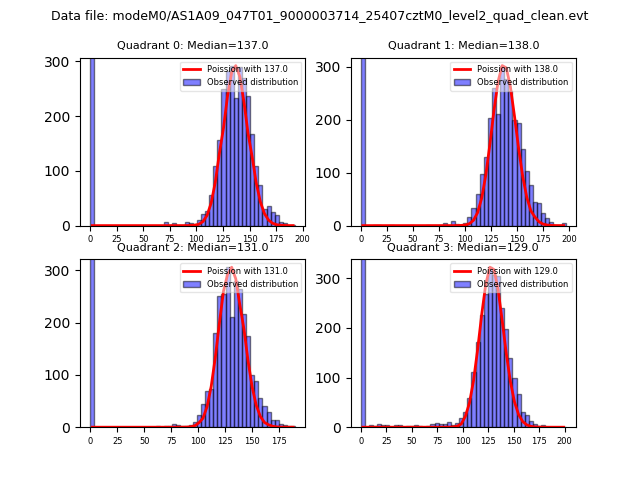
| Comparison with Poisson distribution Blue bars denote a histogram of data divided into 1 sec bins. Red curve is a Poisson curve with rate = median count rate of data. |
 |
 |
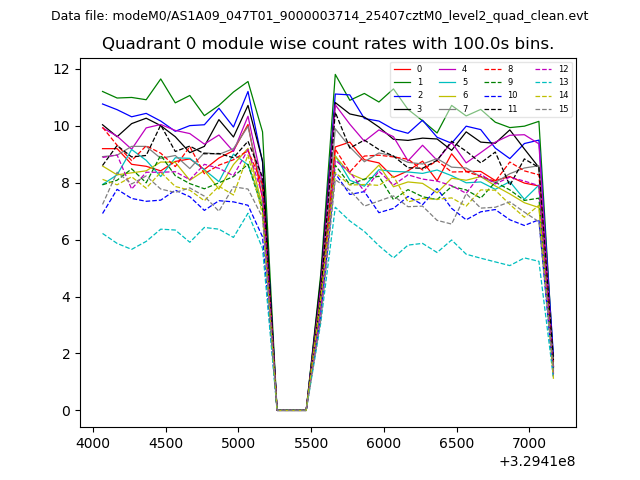
| Quadrant-wise count rates Data is divided into 100 sec bins |
 |
|
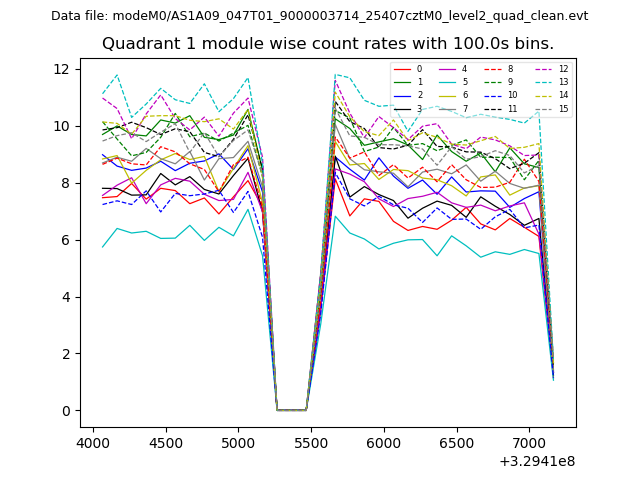
| Module-wise count rates for Quadrant A Data is divided into 100 sec bins |
 |
 |
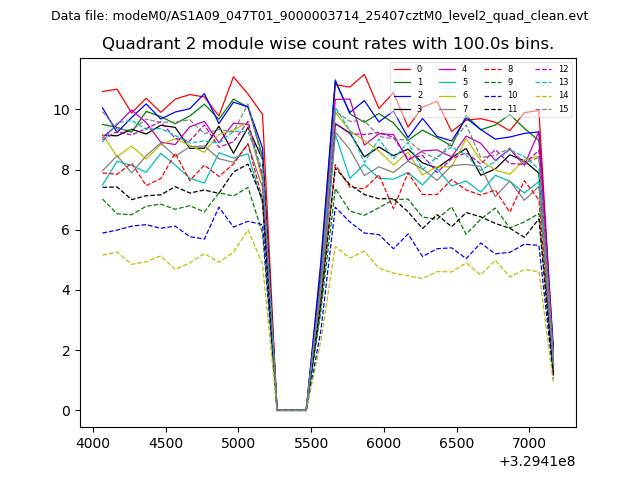
| Module-wise count rates for Quadrant B Data is divided into 100 sec bins |
 |
 |
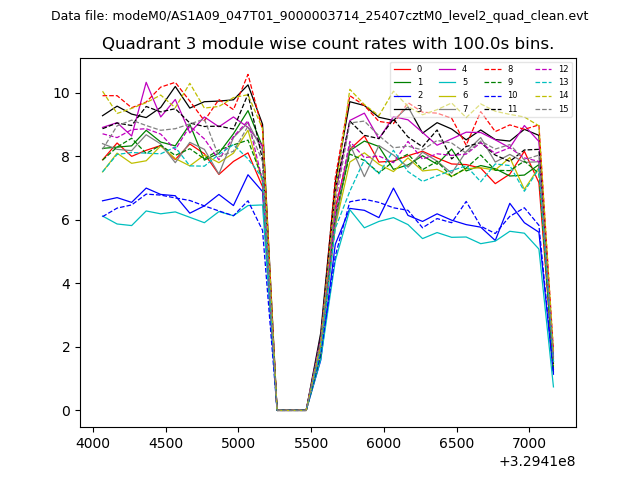
| Module-wise count rates for Quadrant C Data is divided into 100 sec bins |
 |
 |
| Module-wise count rates for Quadrant D Data is divided into 100 sec bins |
 |
 |
| Parameter | Plot |
|---|---|
| CZT HV Monitor | 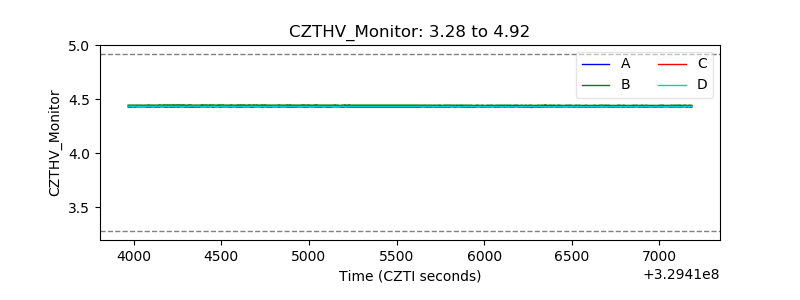 |
| D_VDD | 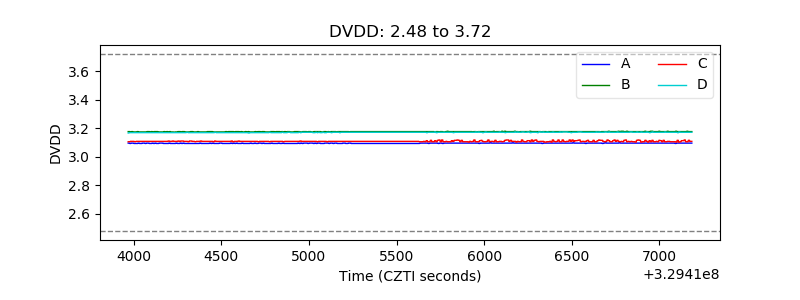 |
| Temperature 1 | 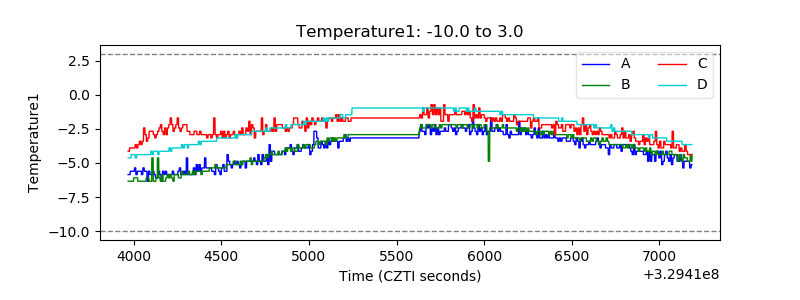 |
| Veto HV Monitor | 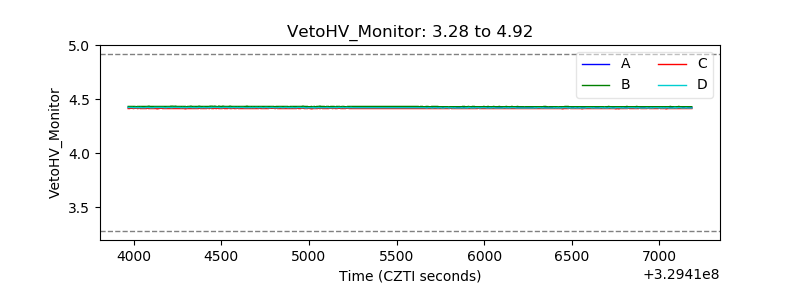 |
| Veto LLD | 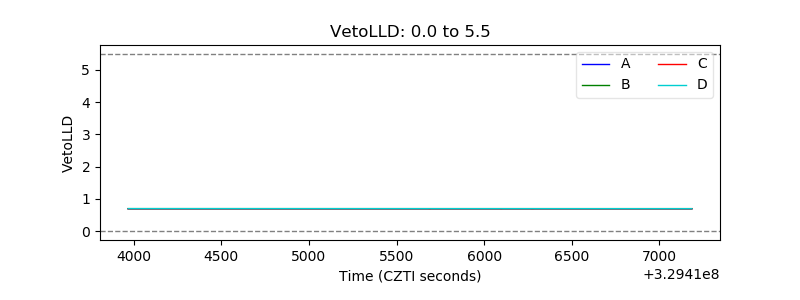 |
| Alpha Counter |  |
| _CPM_Rate |  |
| CZT Counter | 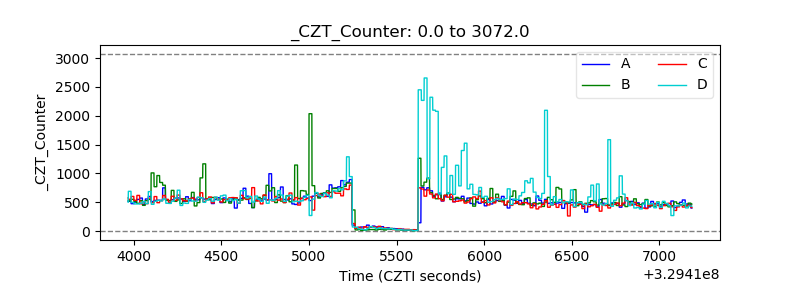 |
| +2.5 Volts monitor |  |
| +5 Volts monitor |  |
| _ROLL_ROT | 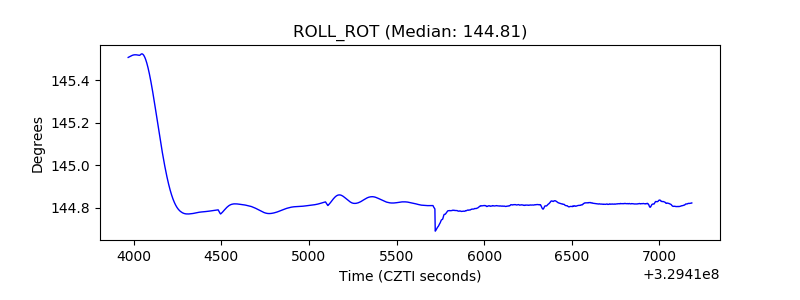 |
| _Roll_DEC | 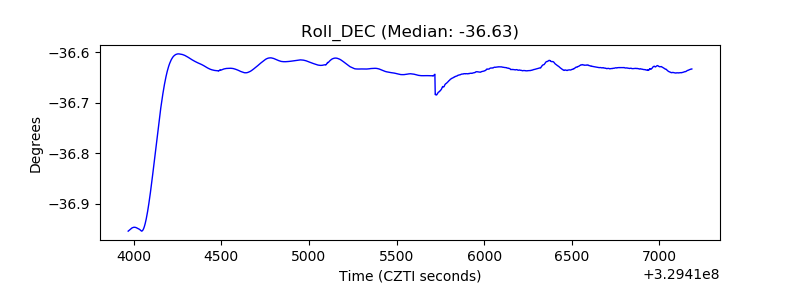 |
| _Roll_RA | 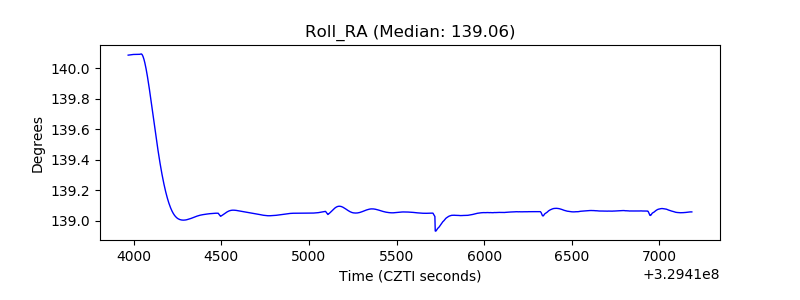 |
| Veto Counter | 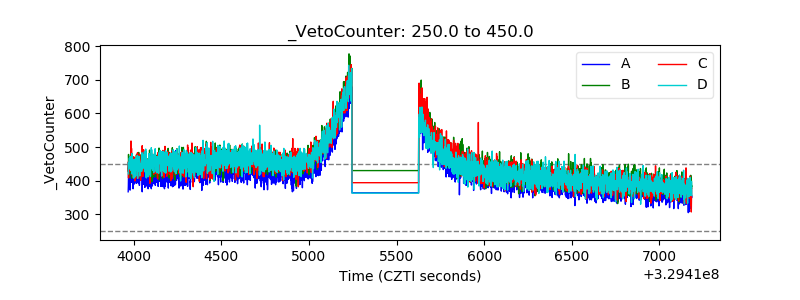 |