| Param | Original file | Final file |
|---|---|---|
| Filename | modeM0/AS1A09_047T01_9000003714_25408cztM0_level2.evt | modeM0/AS1A09_047T01_9000003714_25408cztM0_level2_quad_clean.evt |
| Size (bytes) | 540,213,120 | 103,841,280 |
| Size | 515.2 MB | 99.0 MB |
| Events in quadrant A | 3,496,747 | 683,100 |
| Events in quadrant B | 4,085,886 | 679,017 |
| Events in quadrant C | 3,386,516 | 651,307 |
| Events in quadrant D | 4,903,365 | 630,550 |
| Mode M9 | |||
|---|---|---|---|
| Quadrant | BADHDUFLAG | Total packets | Discarded packets |
| A | 0 | 3 | 0 |
| B | 0 | 3 | 0 |
| C | 0 | 3 | 0 |
| D | 0 | 3 | 0 |
| Mode M0 | |||
|---|---|---|---|
| Quadrant | BADHDUFLAG | Total packets | Discarded packets |
| A | 0 | 14906 | 0 |
| B | 0 | 16743 | 0 |
| C | 0 | 14745 | 0 |
| D | 0 | 19245 | 0 |
| Quadrant | Total seconds | Saturated seconds | Saturation percentage |
|---|---|---|---|
| A | 7197 | 33 | 0.458524% |
| B | 7198 | 126 | 1.750486% |
| C | 7198 | 63 | 0.875243% |
| D | 7198 | 353 | 4.904140% |
Noise dominated data is calculated using 1-second bins in cleaned event files. If a bin has >2000 counts, and if more than 50% of those come from <1% of pixels, then it is considered to be noise-dominated and hence unusable.
| Quadrant | # 1 sec bins | Bins with >0 counts | Bins with >2000 counts | High rate bins dominated by noise | Noise dominated (total time) | Noise dominated (detector-on time) | Marked lightcurve |
|---|---|---|---|---|---|---|---|
| A | 7457 | 7198 | 0 | 0 | 0.00% | 0.00% |  |
| B | 7458 | 7199 | 50 | 50 | 0.67% | 0.69% |  |
| C | 7458 | 7199 | 2 | 2 | 0.03% | 0.03% | 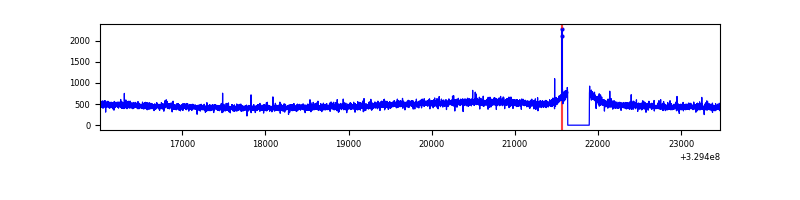 |
| D | 7458 | 7198 | 308 | 308 | 4.13% | 4.28% | 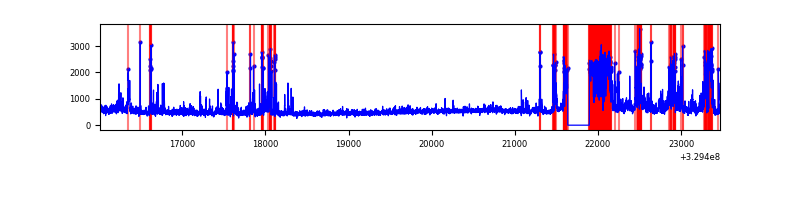 |
Top three noisy pixels from each quadrant. If the there are fewer than three noisy pixels in the level2.evt file, extra rows are filled as -1
| Pixel properties | Quadrant properties | ||||||
|---|---|---|---|---|---|---|---|
| Quadrant | DetID | PixID | Counts | Sigma | Mean | Median | Sigma |
| A | 6 | 16 | 113901 | 640.07 | 874 | 856 | 176.6 |
| A | 13 | 254 | 10590 | 55.11 | 874 | 856 | 176.6 |
| A | 3 | 137 | 7974 | 40.3 | 874 | 856 | 176.6 |
| B | 3 | 112 | 617815 | 3747.24 | 859 | 838 | 164.6 |
| B | 0 | 229 | 59743 | 357.76 | 859 | 838 | 164.6 |
| B | 0 | 190 | 21652 | 126.41 | 859 | 838 | 164.6 |
| C | 14 | 238 | 133294 | 686.51 | 823 | 829 | 193.0 |
| C | 8 | 128 | 14822 | 72.52 | 823 | 829 | 193.0 |
| C | 7 | 247 | 14391 | 70.29 | 823 | 829 | 193.0 |
| D | 7 | 238 | 1185914 | 5963.71 | 825 | 801 | 198.7 |
| D | 8 | 195 | 360691 | 1811.03 | 825 | 801 | 198.7 |
| D | 12 | 233 | 154424 | 773.06 | 825 | 801 | 198.7 |
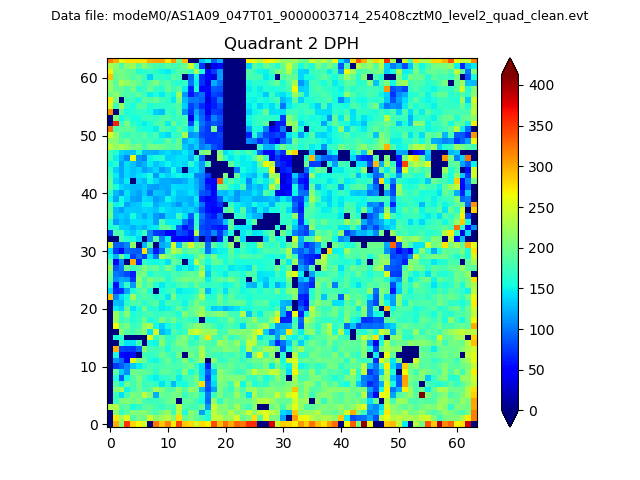
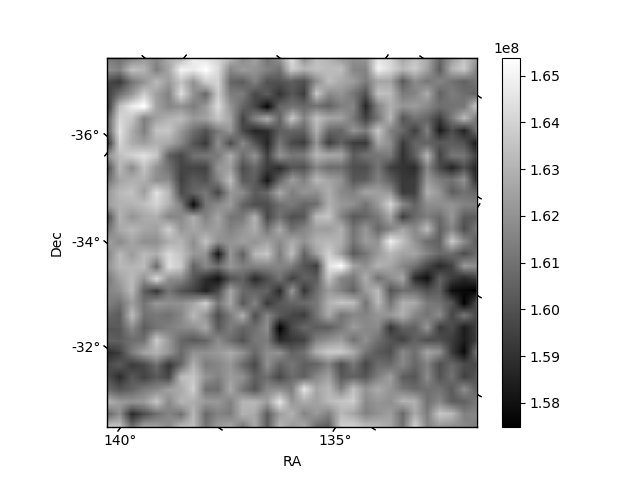
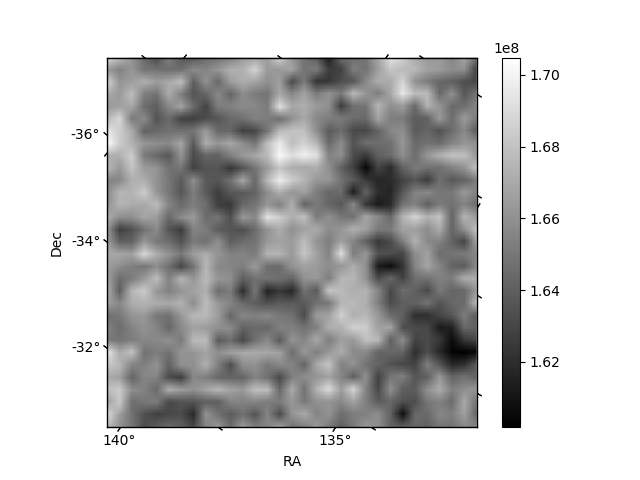
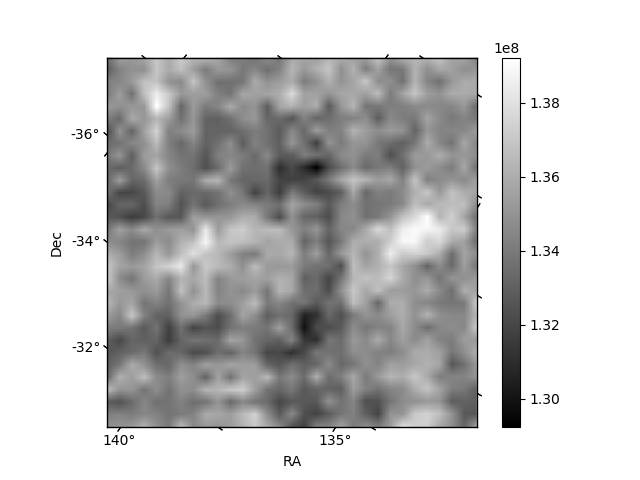
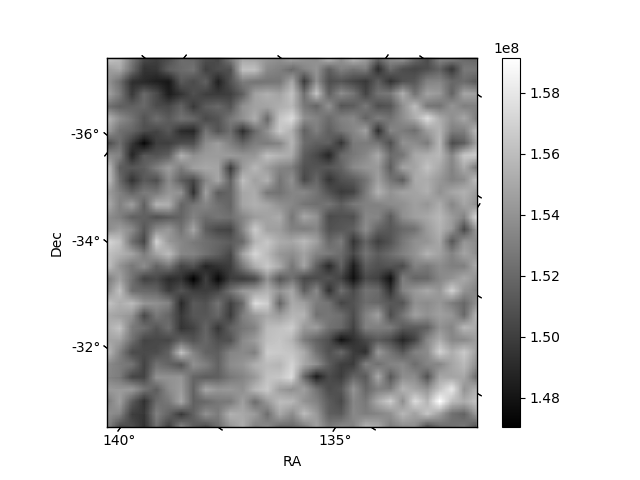
Histogram calculated using DETX and DETY for each event in the final _common_clean file
| Quadrant A | 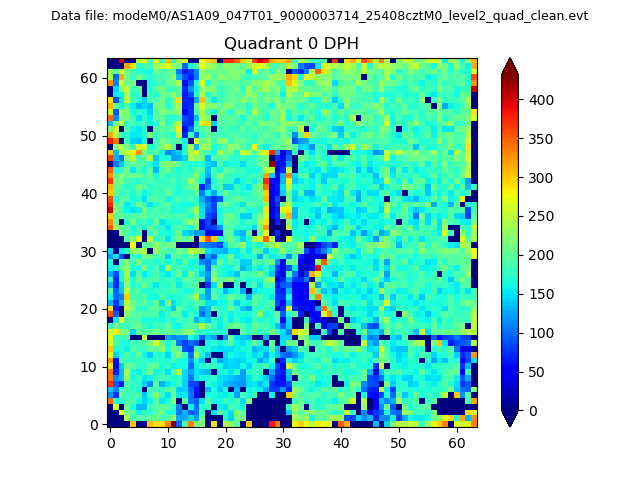 |
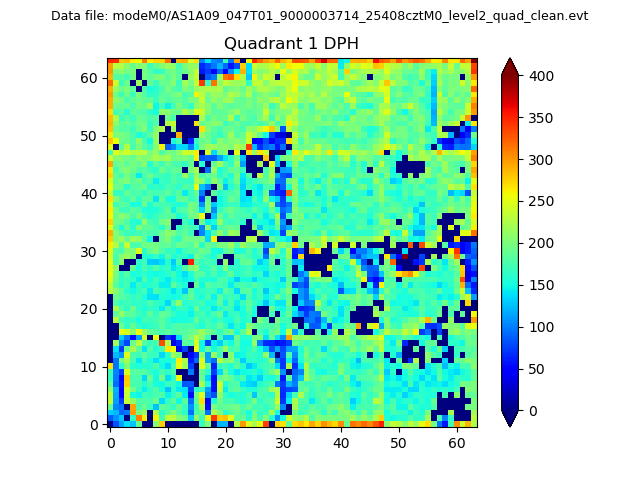 |
Quadrant B |
|---|---|---|---|
| Quadrant D | 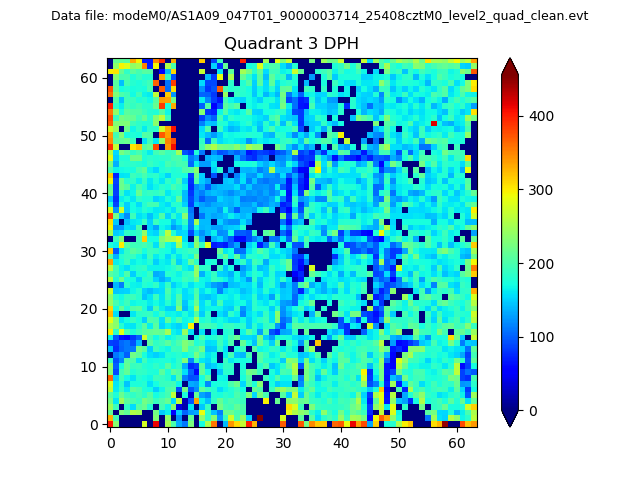 |
 |
Quadrant C |
| Plot type | Count rate plots | Images |
|---|---|---|
| Comparison with Poisson distribution Blue bars denote a histogram of data divided into 1 sec bins. Red curve is a Poisson curve with rate = median count rate of data. |
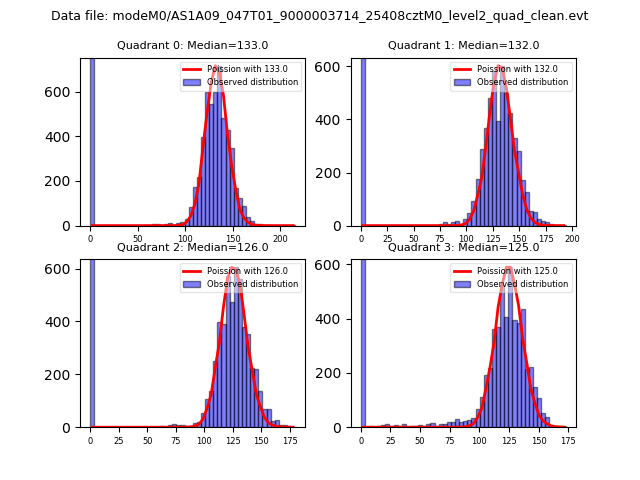 |
 |
| Quadrant-wise count rates Data is divided into 100 sec bins |
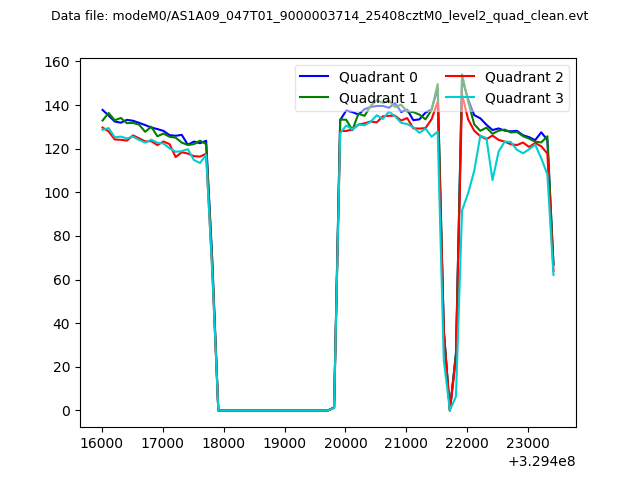 |
|
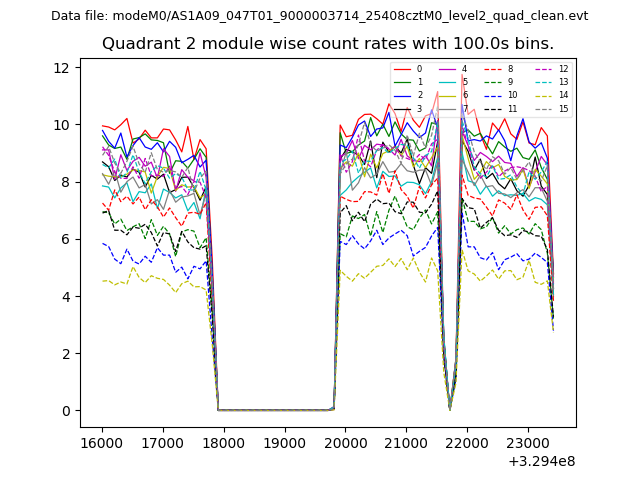
| Module-wise count rates for Quadrant A Data is divided into 100 sec bins |
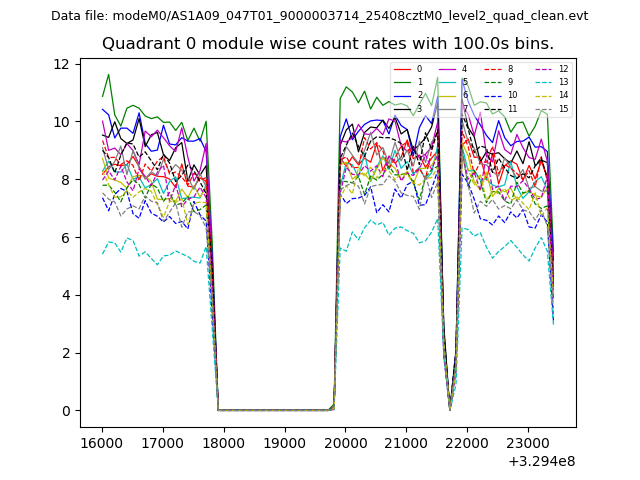 |
 |
| Module-wise count rates for Quadrant B Data is divided into 100 sec bins |
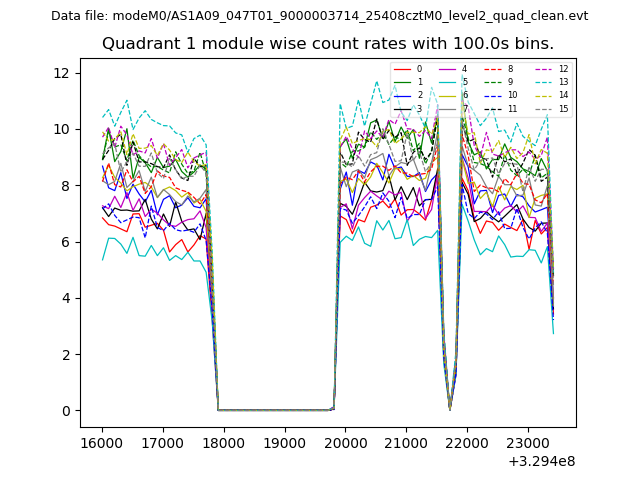 |
 |
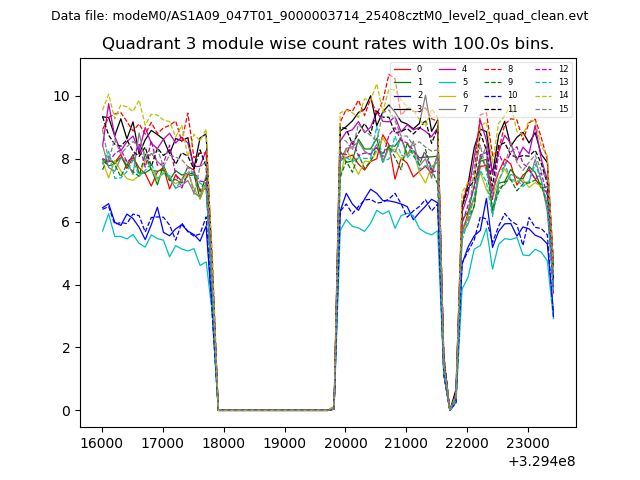
| Module-wise count rates for Quadrant C Data is divided into 100 sec bins |
 |
 |
| Module-wise count rates for Quadrant D Data is divided into 100 sec bins |
 |
 |
| Parameter | Plot |
|---|---|
| CZT HV Monitor | 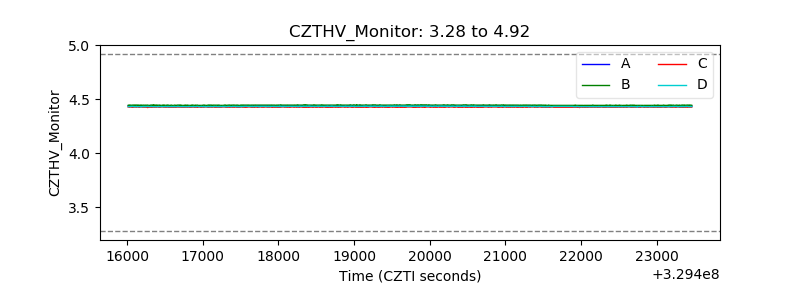 |
| D_VDD | 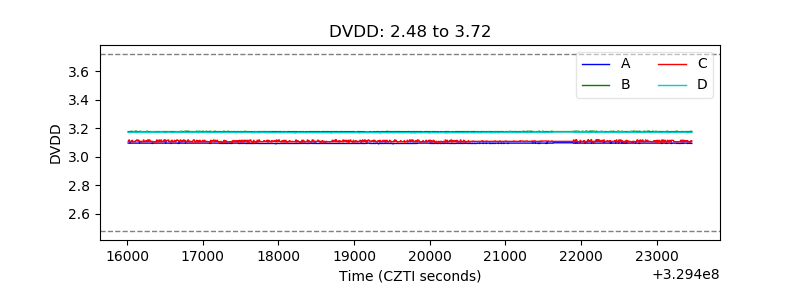 |
| Temperature 1 | 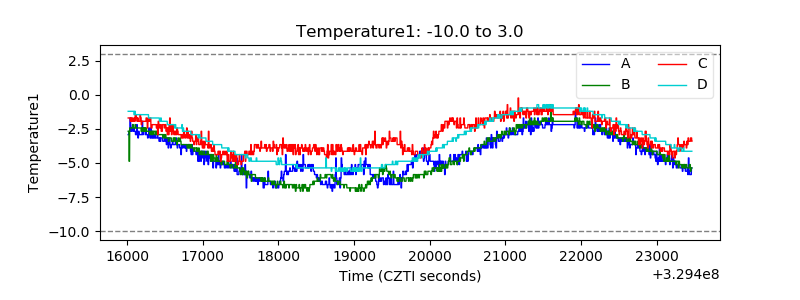 |
| Veto HV Monitor | 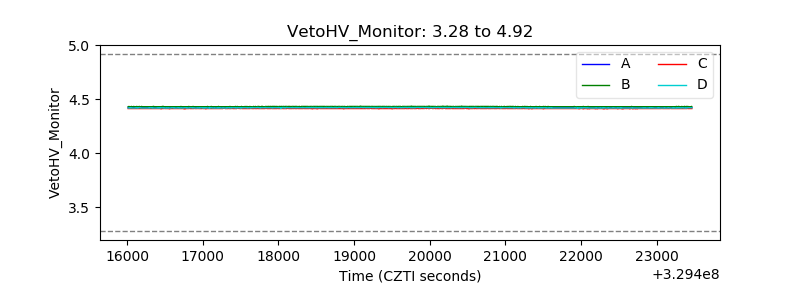 |
| Veto LLD | 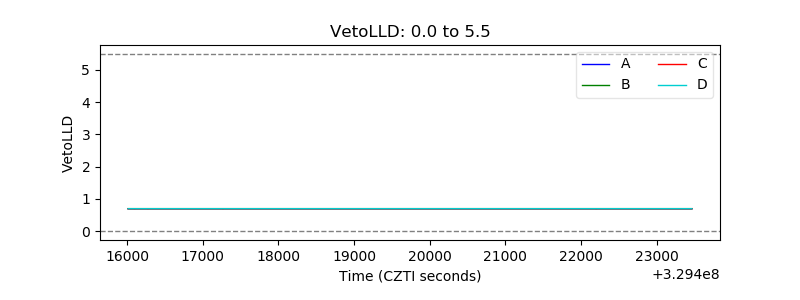 |
| Alpha Counter | 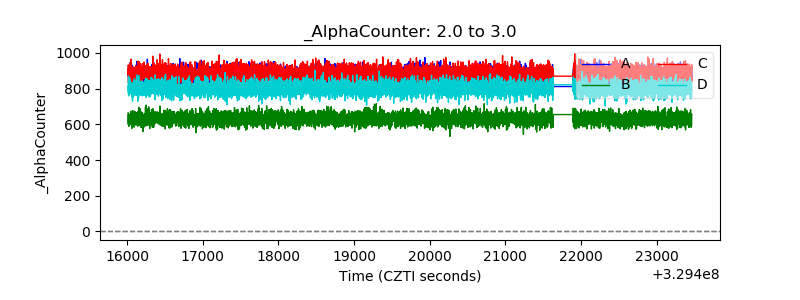 |
| _CPM_Rate | 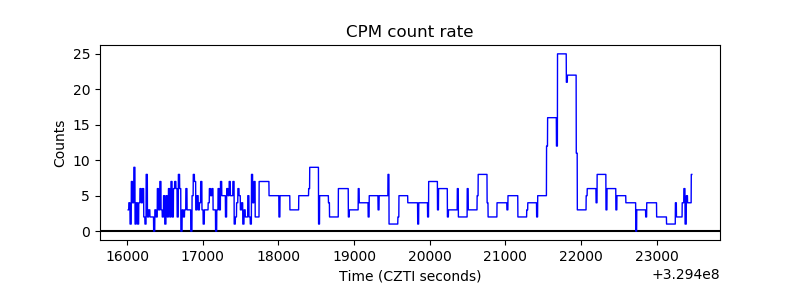 |
| CZT Counter | 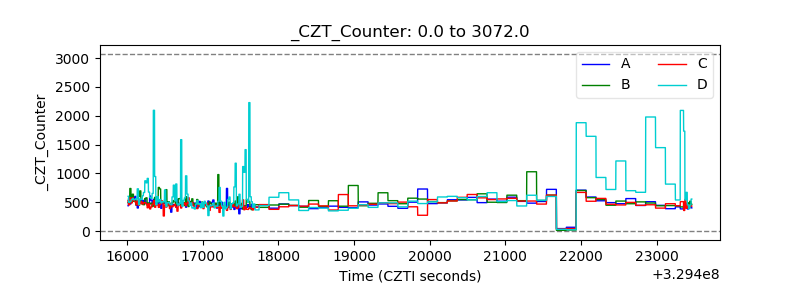 |
| +2.5 Volts monitor | 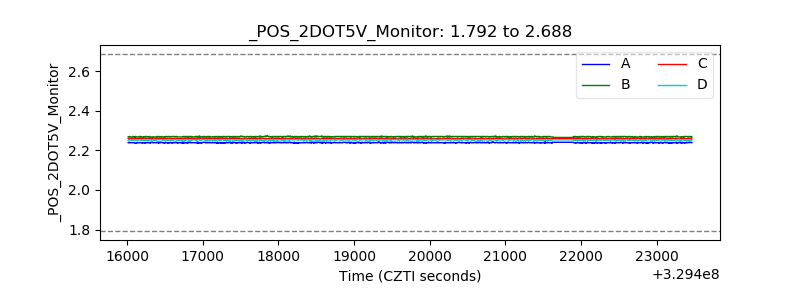 |
| +5 Volts monitor | 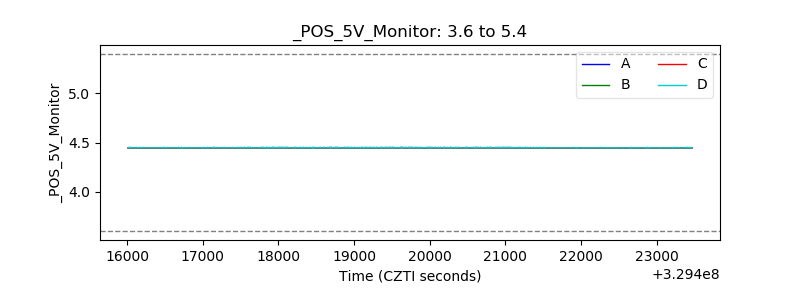 |
| _ROLL_ROT | 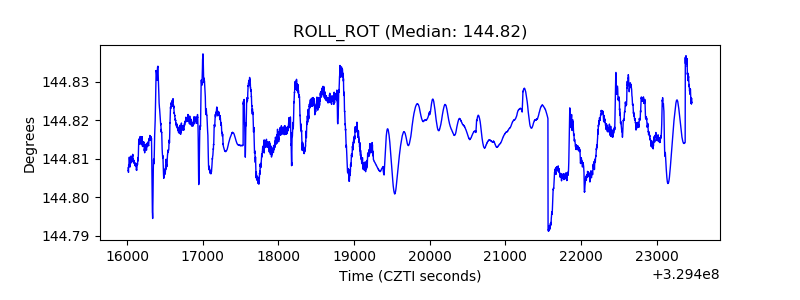 |
| _Roll_DEC | 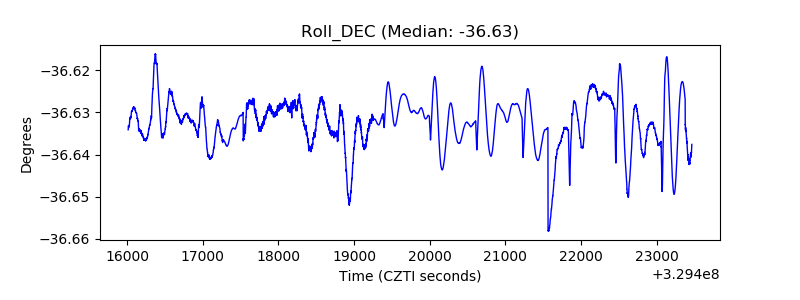 |
| _Roll_RA | 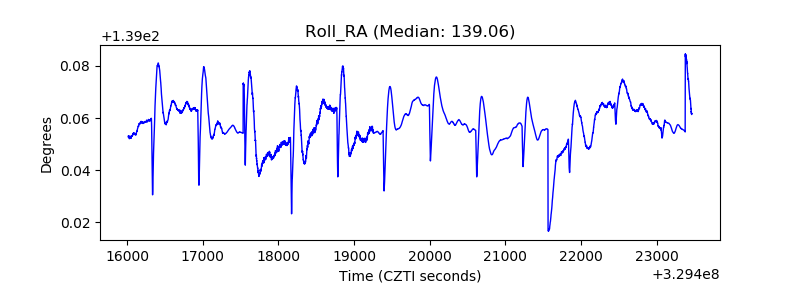 |
| Veto Counter | 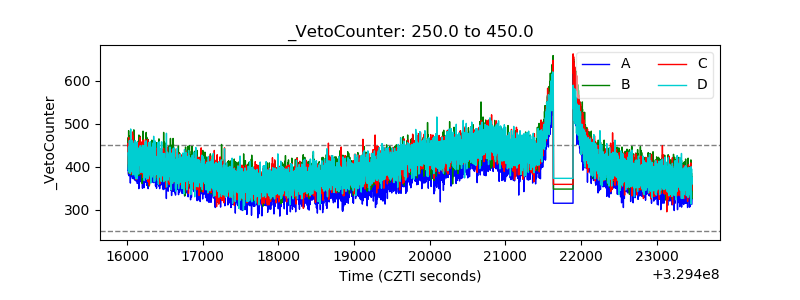 |