| Param | Original file | Final file |
|---|---|---|
| Filename | modeM0/AS1A09_047T01_9000003714_25409cztM0_level2.evt | modeM0/AS1A09_047T01_9000003714_25409cztM0_level2_quad_clean.evt |
| Size (bytes) | 597,199,680 | 104,250,240 |
| Size | 569.5 MB | 99.4 MB |
| Events in quadrant A | 3,886,393 | 684,448 |
| Events in quadrant B | 3,688,567 | 689,061 |
| Events in quadrant C | 3,552,253 | 657,807 |
| Events in quadrant D | 6,451,121 | 604,181 |
| Mode M9 | |||
|---|---|---|---|
| Quadrant | BADHDUFLAG | Total packets | Discarded packets |
| A | 0 | 4 | 0 |
| B | 0 | 5 | 0 |
| C | 0 | 5 | 0 |
| D | 0 | 5 | 0 |
| Mode M0 | |||
|---|---|---|---|
| Quadrant | BADHDUFLAG | Total packets | Discarded packets |
| A | 0 | 16361 | 0 |
| B | 0 | 15750 | 0 |
| C | 0 | 15437 | 0 |
| D | 0 | 24411 | 0 |
| Quadrant | Total seconds | Saturated seconds | Saturation percentage |
|---|---|---|---|
| A | 7494 | 46 | 0.613824% |
| B | 7493 | 64 | 0.854131% |
| C | 7493 | 58 | 0.774056% |
| D | 7493 | 826 | 11.023622% |
Noise dominated data is calculated using 1-second bins in cleaned event files. If a bin has >2000 counts, and if more than 50% of those come from <1% of pixels, then it is considered to be noise-dominated and hence unusable.
| Quadrant | # 1 sec bins | Bins with >0 counts | Bins with >2000 counts | High rate bins dominated by noise | Noise dominated (total time) | Noise dominated (detector-on time) | Marked lightcurve |
|---|---|---|---|---|---|---|---|
| A | 7904 | 7495 | 3 | 3 | 0.04% | 0.04% | 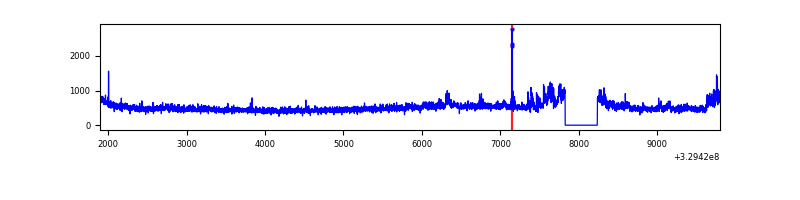 |
| B | 7903 | 7494 | 17 | 17 | 0.22% | 0.23% | 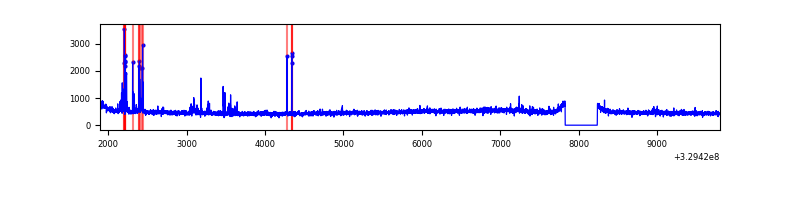 |
| C | 7903 | 7493 | 0 | 0 | 0.00% | 0.00% | 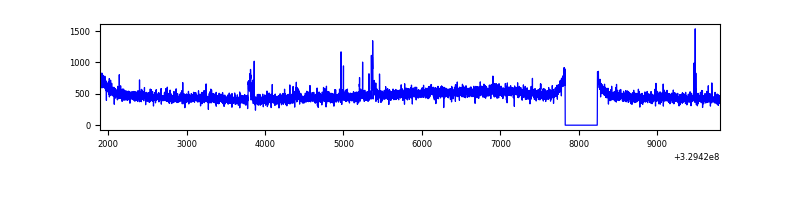 |
| D | 7903 | 7493 | 737 | 737 | 9.33% | 9.84% | 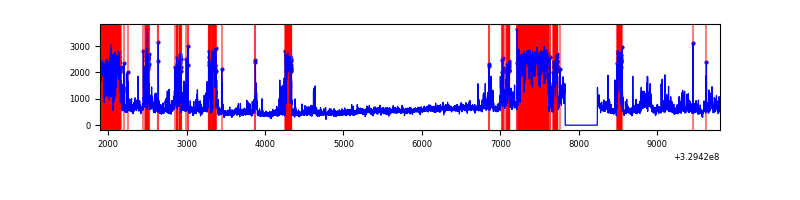 |
Top three noisy pixels from each quadrant. If the there are fewer than three noisy pixels in the level2.evt file, extra rows are filled as -1
| Pixel properties | Quadrant properties | ||||||
|---|---|---|---|---|---|---|---|
| Quadrant | DetID | PixID | Counts | Sigma | Mean | Median | Sigma |
| A | 6 | 16 | 365468 | 1981.67 | 906 | 887 | 184.0 |
| A | 13 | 254 | 11646 | 58.48 | 906 | 887 | 184.0 |
| A | 14 | 250 | 8812 | 43.08 | 906 | 887 | 184.0 |
| B | 3 | 112 | 146915 | 850.95 | 896 | 871 | 171.6 |
| B | 12 | 111 | 20998 | 117.27 | 896 | 871 | 171.6 |
| B | 0 | 229 | 18912 | 105.12 | 896 | 871 | 171.6 |
| C | 14 | 238 | 135817 | 676.01 | 853 | 857 | 199.6 |
| C | 7 | 87 | 34480 | 168.42 | 853 | 857 | 199.6 |
| C | 7 | 247 | 26293 | 127.41 | 853 | 857 | 199.6 |
| D | 7 | 238 | 1355353 | 6704.07 | 829 | 802 | 202.0 |
| D | 12 | 233 | 1077230 | 5327.56 | 829 | 802 | 202.0 |
| D | 8 | 195 | 799766 | 3954.31 | 829 | 802 | 202.0 |
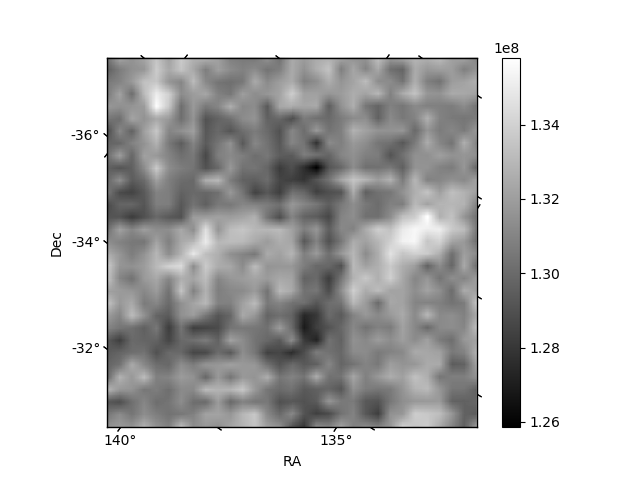
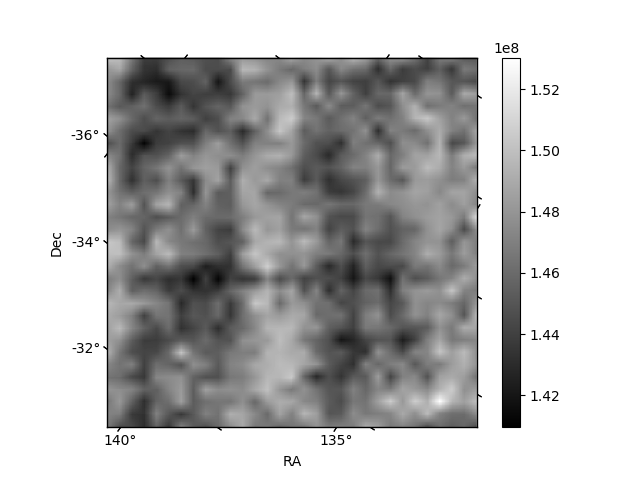
Histogram calculated using DETX and DETY for each event in the final _common_clean file
| Quadrant A | 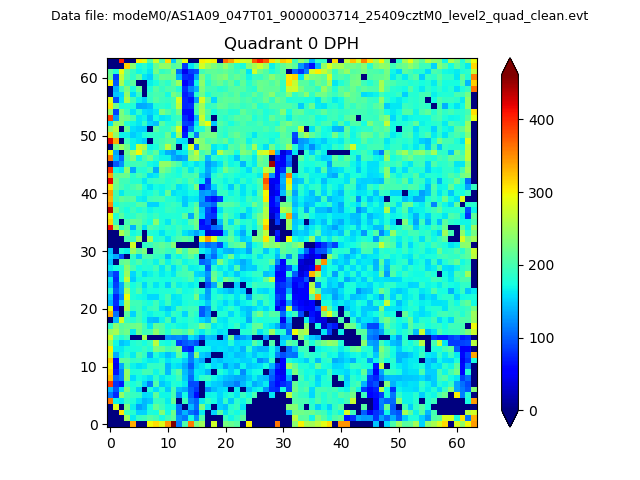 |
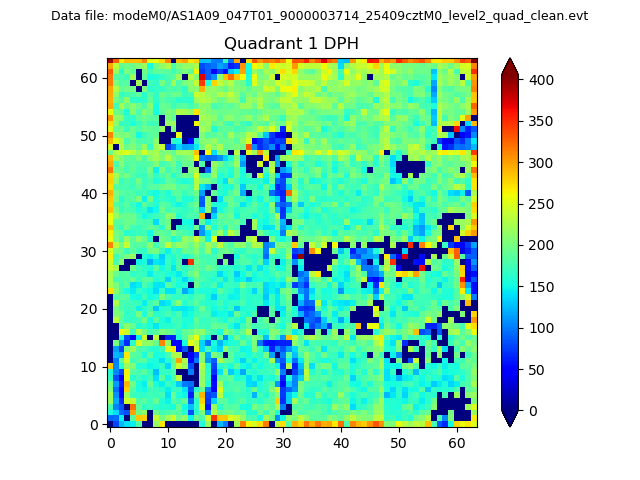 |
Quadrant B |
|---|---|---|---|
| Quadrant D | 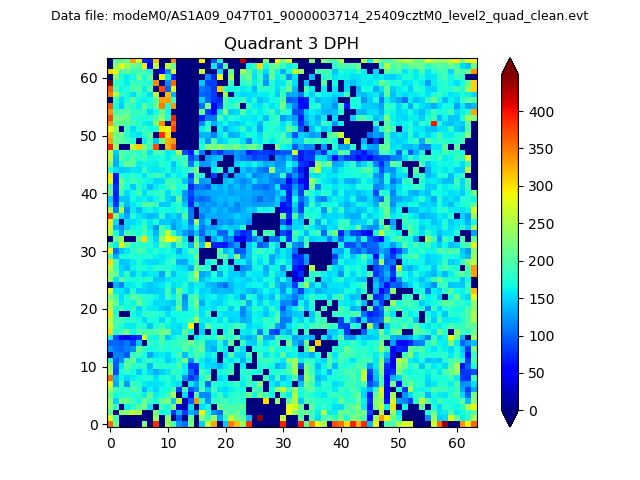 |
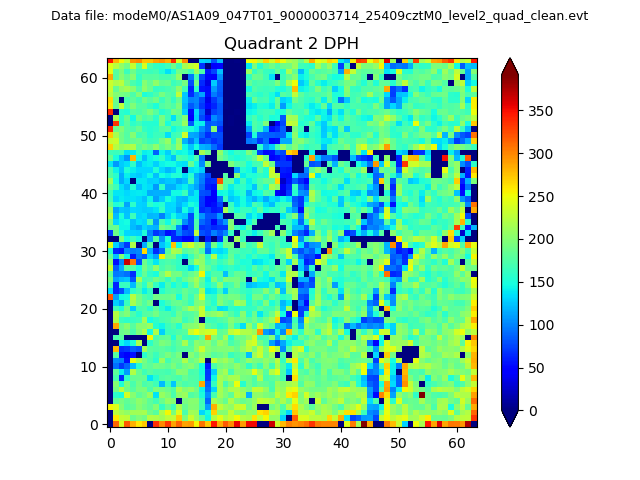 |
Quadrant C |
| Plot type | Count rate plots | Images |
|---|---|---|
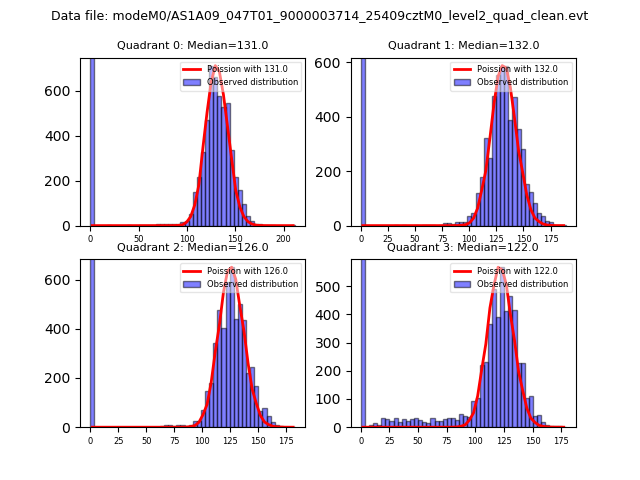
| Comparison with Poisson distribution Blue bars denote a histogram of data divided into 1 sec bins. Red curve is a Poisson curve with rate = median count rate of data. |
 |
 |
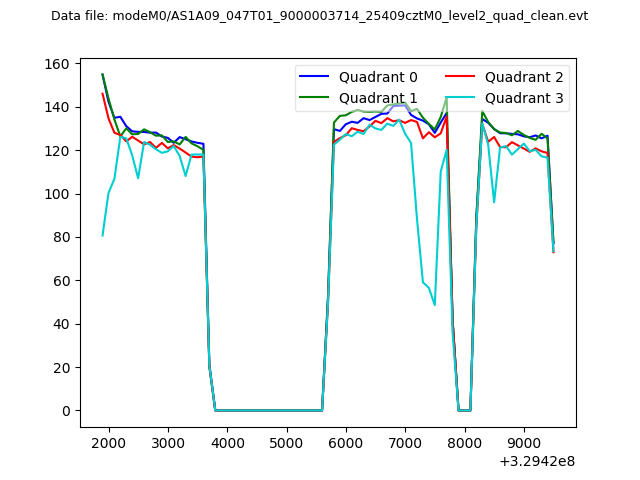
| Quadrant-wise count rates Data is divided into 100 sec bins |
 |
|
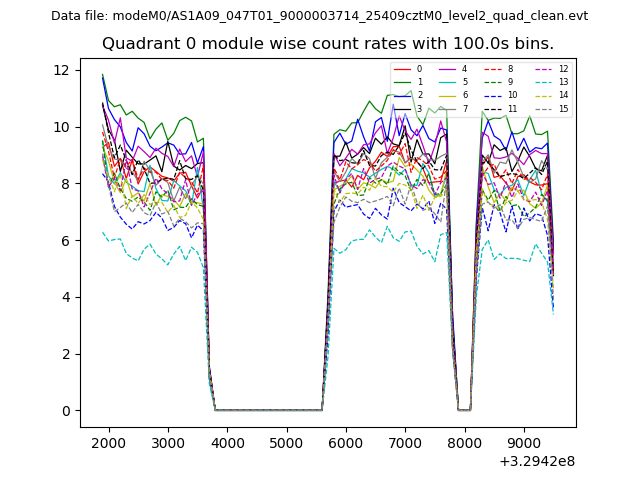
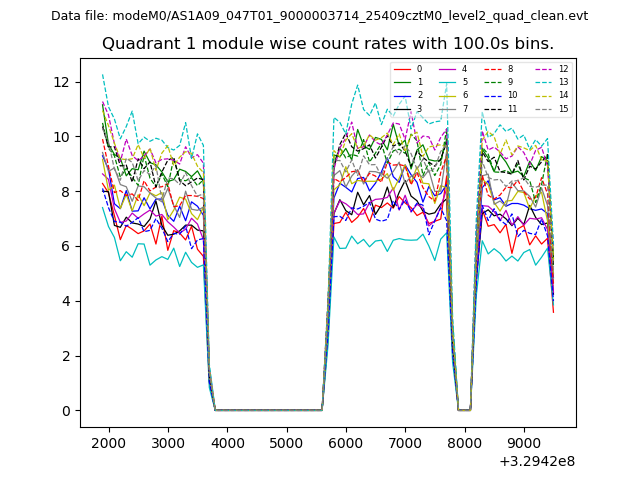
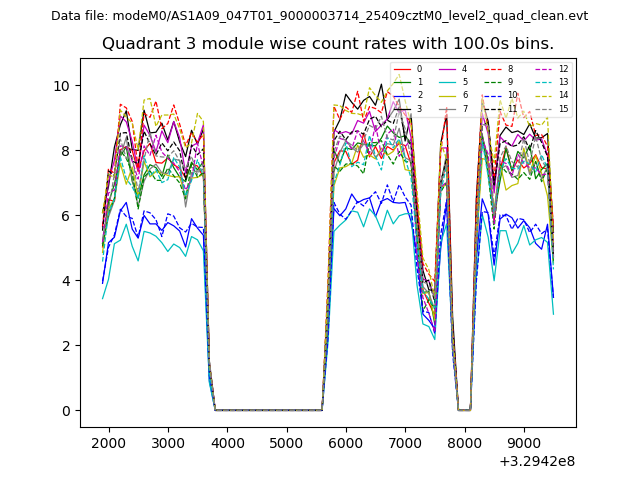
| Module-wise count rates for Quadrant A Data is divided into 100 sec bins |
 |
 |
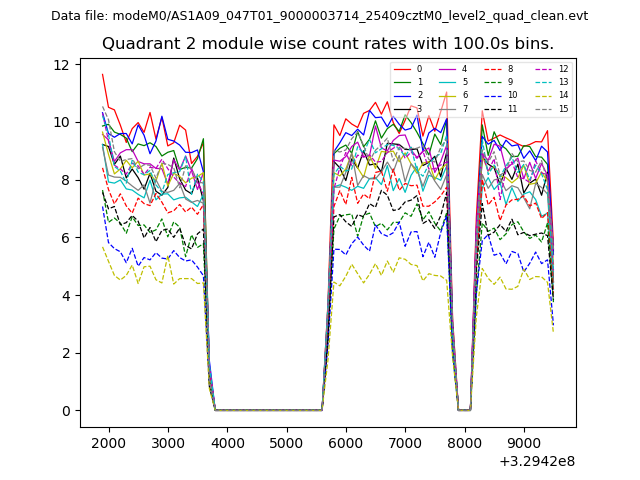
| Module-wise count rates for Quadrant B Data is divided into 100 sec bins |
 |
 |
| Module-wise count rates for Quadrant C Data is divided into 100 sec bins |
 |
 |
| Module-wise count rates for Quadrant D Data is divided into 100 sec bins |
 |
 |
| Parameter | Plot |
|---|---|
| CZT HV Monitor |  |
| D_VDD | 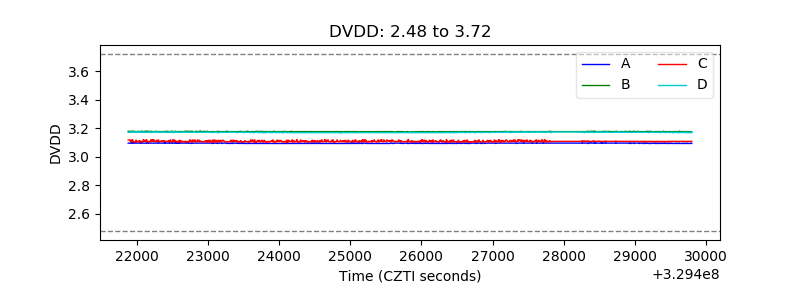 |
| Temperature 1 | 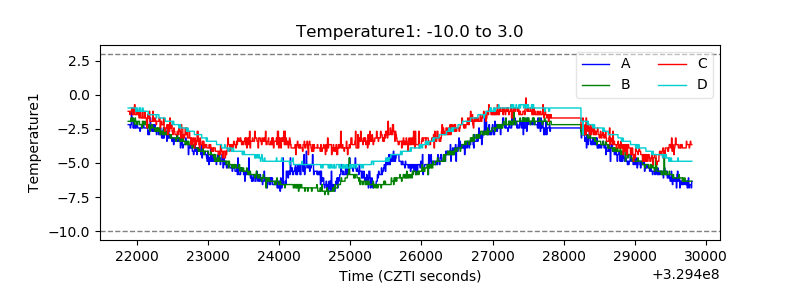 |
| Veto HV Monitor | 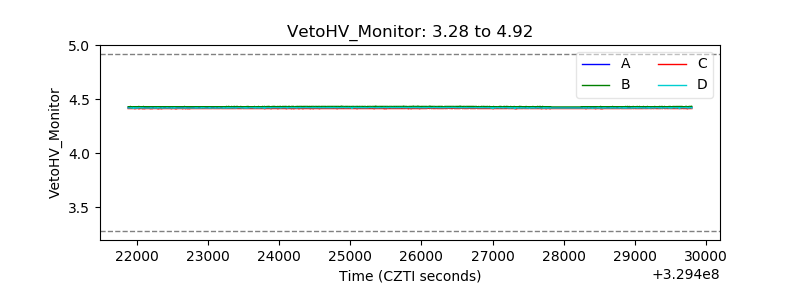 |
| Veto LLD | 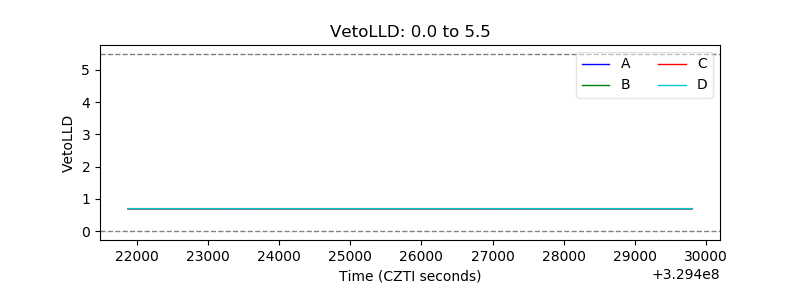 |
| Alpha Counter |  |
| _CPM_Rate | 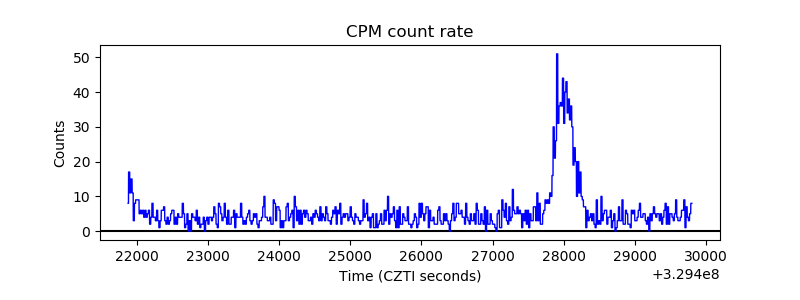 |
| CZT Counter | 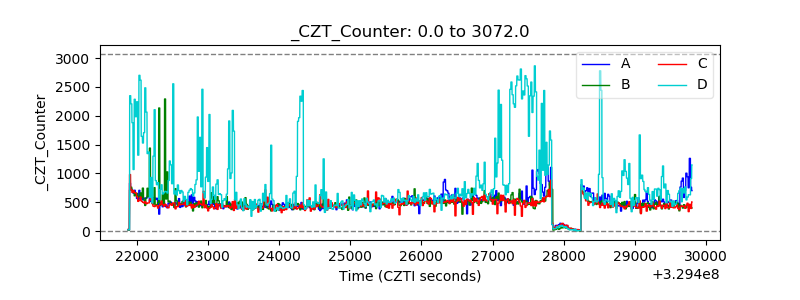 |
| +2.5 Volts monitor |  |
| +5 Volts monitor | 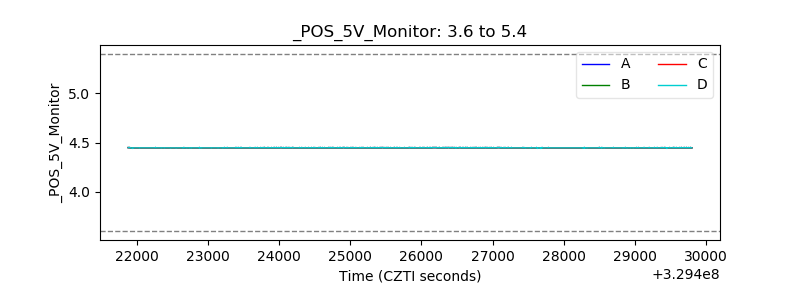 |
| _ROLL_ROT | 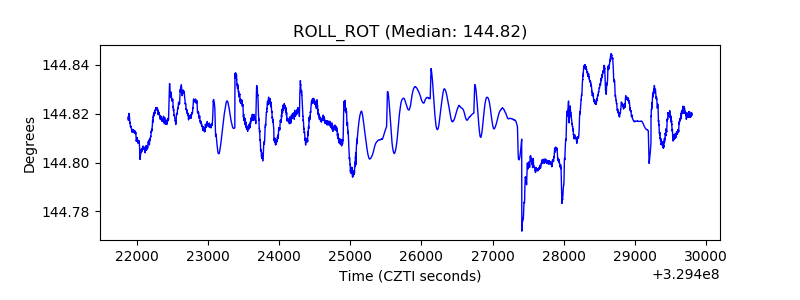 |
| _Roll_DEC | 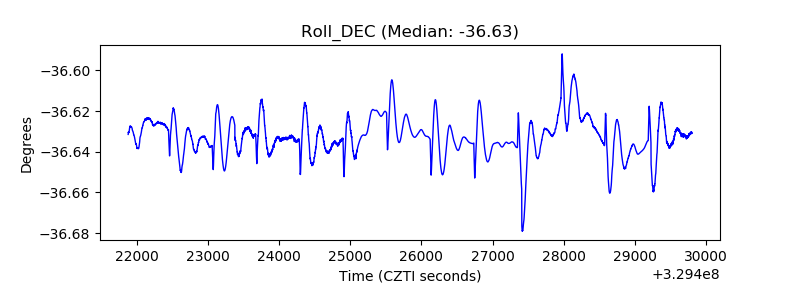 |
| _Roll_RA | 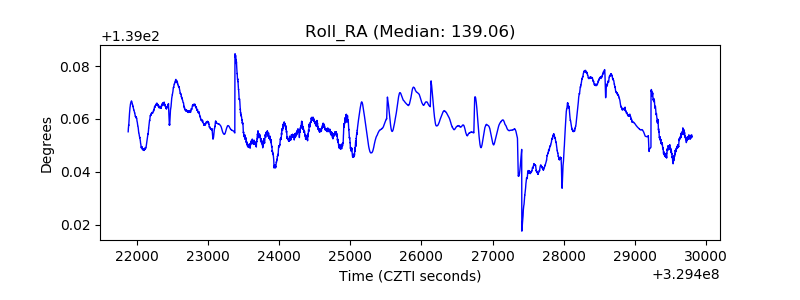 |
| Veto Counter | 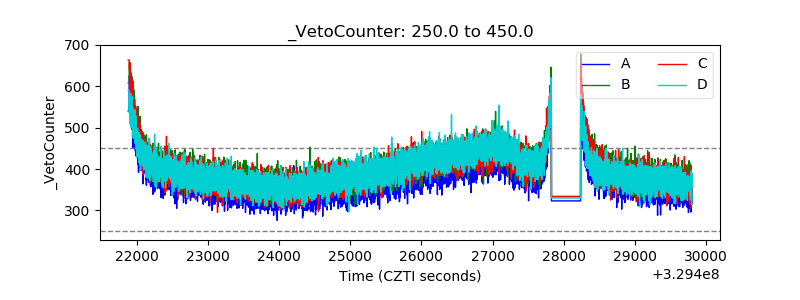 |